Thanks for the drivers. Just bought the VINDSTYRKA yesterday, and been recording metrics since.
Do we know what the units are for airQualityIndex ?
And what the values can be for airQualityLevel ?
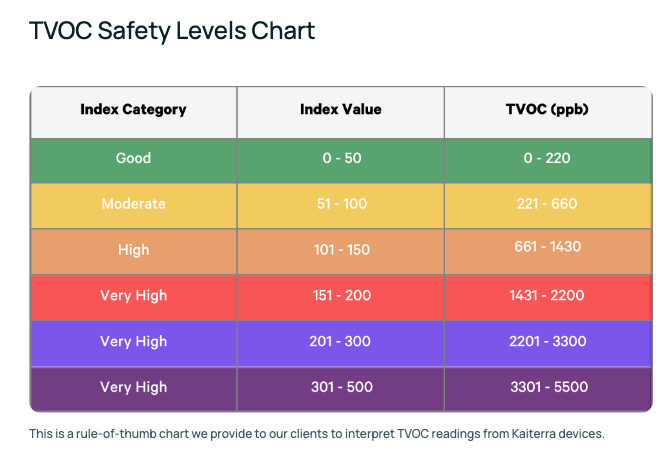
Is it based on this chart from Understanding TVOC: What You Need To Know About Volatile Organic Compounds