Copied from another post...
And here we go...
Copied from another post...
And here we go...
Looks interesting...
This data means something to you? @TechMedX 
{
    "Global Quote": {
        "01. symbol": "IBM",
        "02. open": "122.7100",
        "03. high": "122.9900",
        "04. low": "121.0900",
        "05. price": "122.9400",
        "06. volume": "5277652",
        "07. latest trading day": "2020-07-31",
        "08. previous close": "122.9000",
        "09. change": "0.0400",
        "10. change percent": "0.0325%"
    }
}or this...
Time Series (Daily)": {
        "2020-07-31": {
            "1. open": "122.7100",
            "2. high": "122.9900",
            "3. low": "121.0900",
            "4. close": "122.9400",
            "5. volume": "5277652"
        },
        "2020-07-30": {
            "1. open": "123.7100",
            "2. high": "123.9046",
            "3. low": "121.6400",
            "4. close": "122.9000",
            "5. volume": "3988062"
        },
        "2020-07-29": {
            "1. open": "124.5600",
            "2. high": "125.9900",
            "3. low": "124.0700",
            "4. close": "125.3200",
            "5. volume": "2833141"
        },
        "2020-07-28": {
            "1. open": "125.8200",
            "2. high": "126.3400",
            "3. low": "124.1500",
            "4. close": "124.4700",
            "5. volume": "4178176"
        },
Looks like with this I could setup some tracking
I  cool devs!!
I options!!!

Looks simply enough.... I got my API Key and I'm going in! 

Update: data extraction has begun, time to make the first report.
Looking at the data you provided there that doesn't look like it will let you make a ticker. It looks like only open/close data?
The ability to send a notification and throw a virtual switch if a stock/crypto goes above or below a certain value would be cool. I will get my living room lights to show red or green depending on the market lol. A lot of green recently, but some red today... 

Does the API only give daily stats or do you get it faster (per hour/minute/tick)?
That's the daily report, time set to 1 hour increments. It can go as low as 1 min but that's a lot of data coming in (last 100 data points each time)! Remember we are still bound to the 1024 characters per tile limit, so that's what you see here. Each tile is about 900 characters.
So whether you have it set to 1 min or 1 hour, you will only get about 5 lines of data on a tile. Up to you.
Sent PM
I'm personally interested in something like.
Equity
Current Price (Green or Red)
$ increase/decrease (since open) % increase/decrease (since open)
Could be done...
Equity | Current Price (Green or Red) | $ increase/decrease (since open) % increase/decrease (since open)
We can easily over come that with CSS. These have 7 and 4 tiles respectively. We can easily add multiple tiles, and make them look like one using the smartly quarter height mod.

As markets open I realize I made a mistake. It should be 'since last closing price' not since open (gotta count the pre/post hours market)
Equity | Current Price | $ increase/decrease (since last close) % increase/decrease (since last close)
Examples: PayPal , Disney
PYPL - $197.77 - [green] - $1.70 (0.86%) [green]
DIS - $116.14 [red] - -$0.80 (-0.68%) [red]
Numbers should round to nearest penny.
Thanks bunched for doing this! Your donation will come via PYPL to help my portfolio 
API to where?
Pretty sure their API that provides this data isn't free.
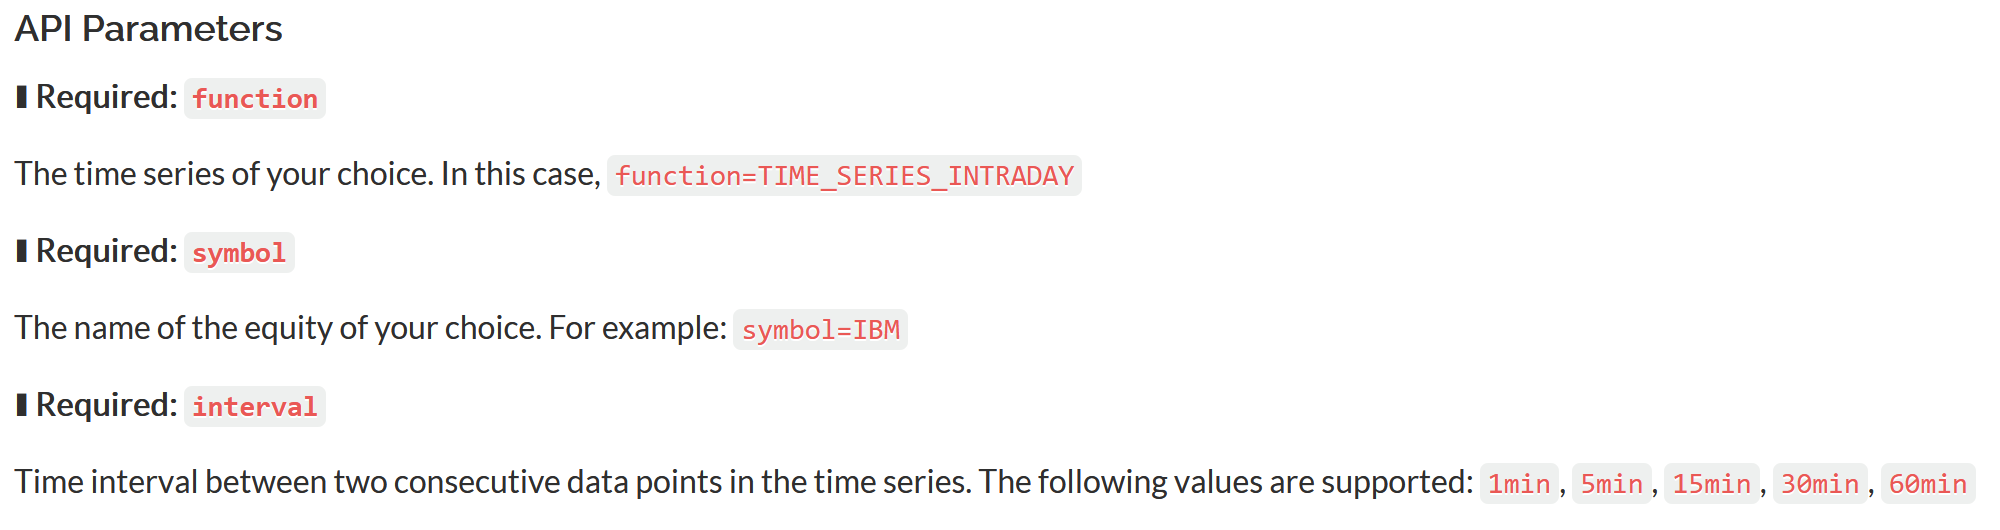
It looks like their TIME_SERIES_INTRADAY can pull data as quickly as every '1min' or am I reading this wrong?
Yup, just like I said. lol ![]()
![]()
Hopefully I'll have time to work on this today.
For a fee. It lists a coupon code right under that api call.
Download the Hubitat app