I think there is a problem once I copy the JSON to the website and save it..... Let me see how I can fix that.
Greetings from the rabbit hole!
I've been dealing with a frequently non-responsive hub. It's most assuredly a result of something I've done, but still, I want metrics. Since we don't have any profiling tools (I kid, I kid!) and my wife gets cranky if the lights don't come on when I'm not home, I came up with this flow.
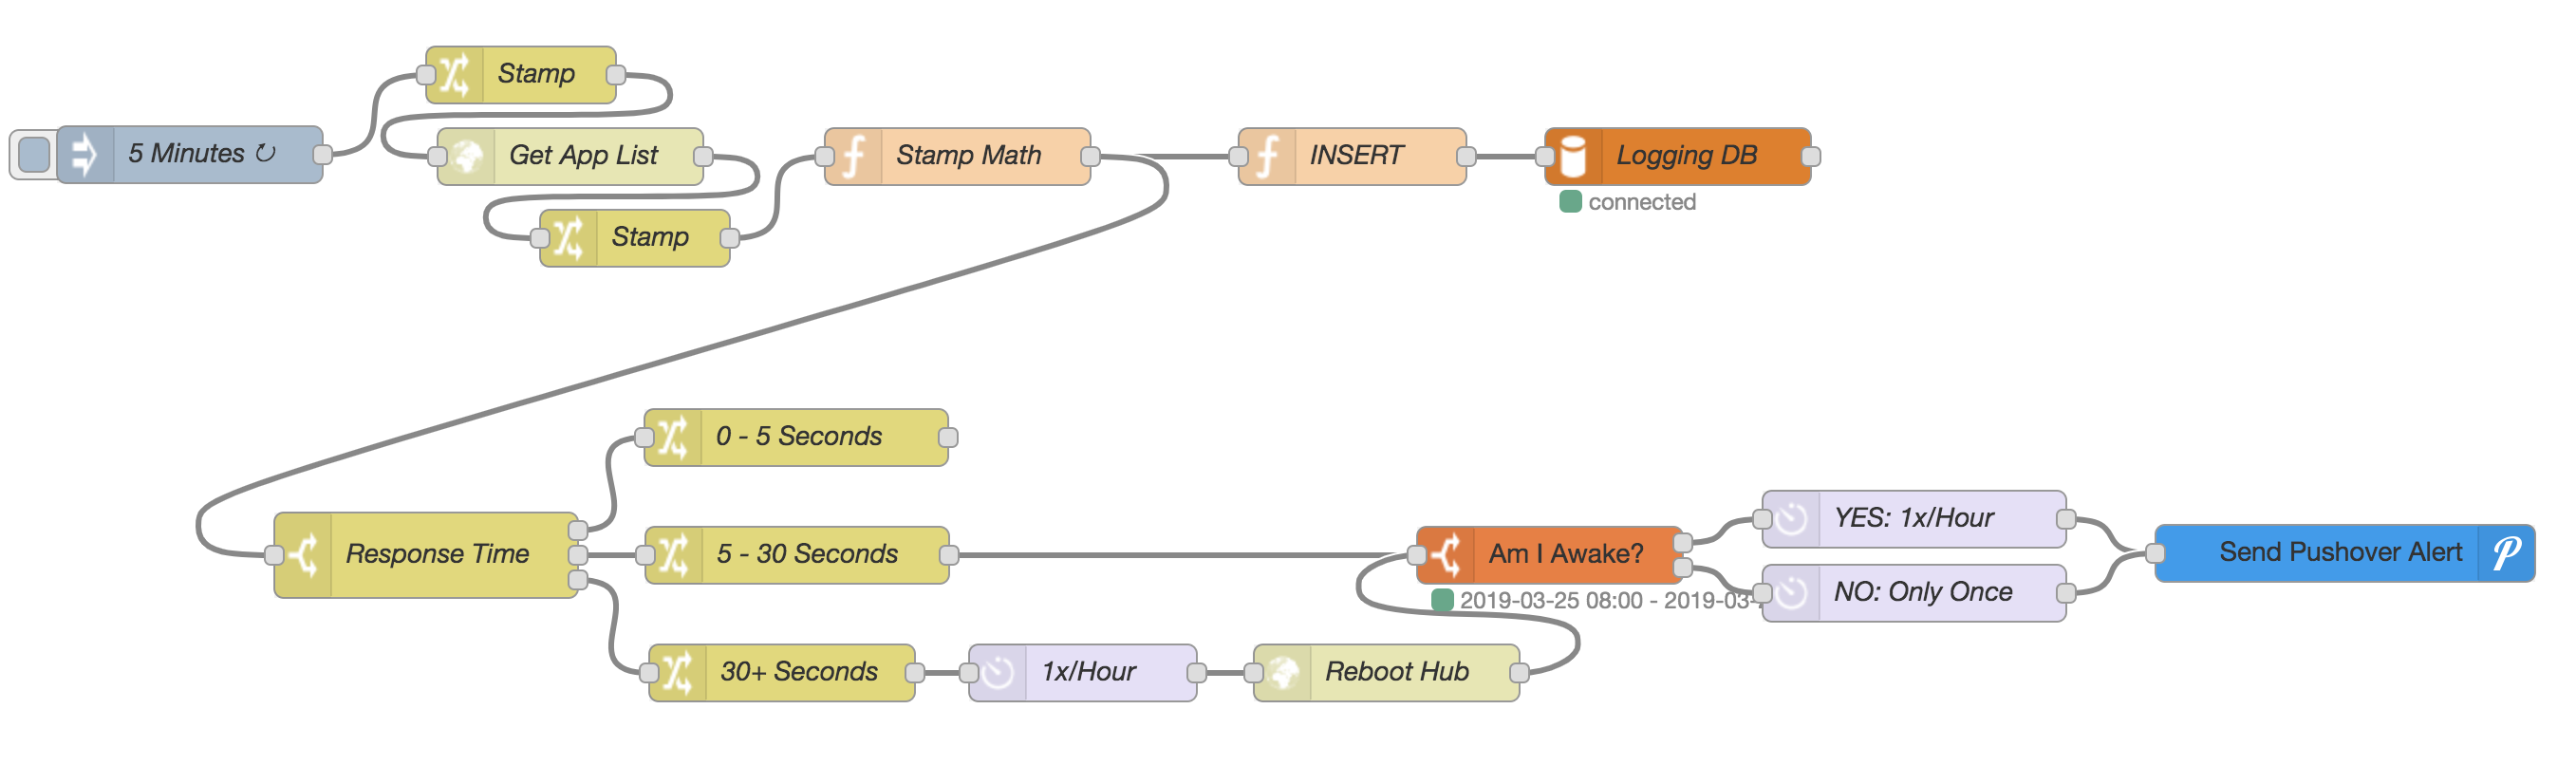
It does the following:
- Gets the list of installed apps and calculates the time it took to complete the request
- Shoves the elapsed time into the database for graphing/reporting
- Checks the response times.
- If response times start to become concerning, it sends a Pushover alert.
- If I'm awake, it's allowed to do it once an hour.
- If I'm sleeping, it does it once so I see the notification in the morning and then shuts up for the rest of the night.
- If they get really bad, it will reboot the hub up to once an hour.
- Notifications via Pushover follow the same restrictions as above.
- Hub response times immediately after a reboot can potentially be very high while the services are still starting. This check avoids false positives.
- If response times start to become concerning, it sends a Pushover alert.
5 Likes
Rabbit hole indeed! I really like the calc on the hub response times after a reboot. would you mind sharing the flow?
I also came across this the other day. It allows you to send Alexa notifications from pretty much anything that can do a HTTP request out. I'm using it for a status report and some alerts. Might be nice to use along with pushover alerts.
Hey Coby,
I uploaded the JSON to github here: HE 2 Influx
That should work. I also adjusted my original message above.
Let me know if you still have problems
2 Likes
@dan.t, I imported your flow but it's not writing anything to my influxDB. I'm new to nodeRed so it's probably something I'm doing wrong.
I am using the 8086 port and I put in the name of my DB in the required field. What am I missing?
A couple of questions:
- Did you install node-red-contrib-filter and node-red-contrib-influxbd?
- Did you enable the flow (double click on the tab with the flow name and click on Enable)?
- Did you change the IP for the Hubitat Event Socket Prod?
- Click on the Debug tab (after you deploy it) and see if there are any errors showing up?
(ok, 4 == couple in my world  )
)
I think I just got it working by changing the message from "payload" to "entire message"
I had the socket already created and was just copying the rest of the flow from @dan.t.
But thanks for the steps above...didnt know about 2 or 4
1 Like
Sorry! I was copying @btk's code when @stephack sent the post. LOL
Edit: BTW, LOVE the code sir!
Found one bug (which I never fixed in my nodejs code either  )
)
Line 202: Change to value: (Array.isArray(v.value) ? v.value.join(',') : v.value),
This is to correct for threeAxis devices. Otherwise, InfluxDB throws a 400 error.
@dan.t for contact sensor, are you able to show in grafana both open and closed state? I am only seeing the close state only. I think the code is sending the status for both open and closed events right?
Hey @cuboy29,
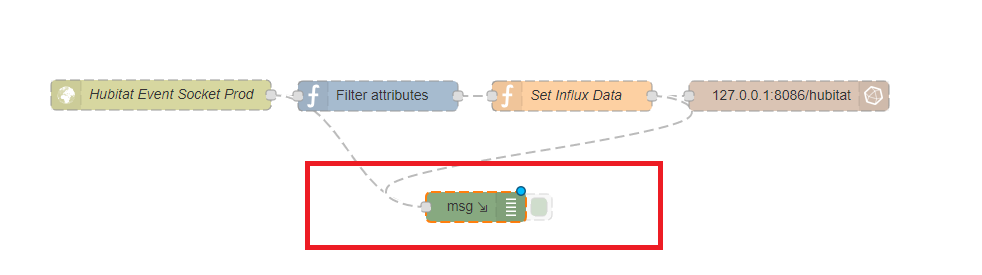
yes, I do get my contact sensors reported correctly. You could temporarily add a debug output to your Node-Red flow and see if it gets reported correctly on your end. Something like this:
@btk, your HE performance monitoring is awesome! Thanks.
One suggestion: I would add a time filter in front of the reboot action to exclude any time between 02:00 am and 03:00 am. HE does it's housekeeping and backups during that time and might be slow responding. You don't want to restart the Hub during a backup.... Happened to me last night
1 Like
Good idea. I'm adding a bunch of extra logic to this flow like requiring multiple consecutive >30s response times for a reboot. I'll take this into account as well.
@dan.t, I'm still getting errors with 3 axis after updating to your new flow. Are you seeing the errors still?
Not near a computer right now but will check on it ASAP. I don’t have the need to record a 3 axis device so need to play with it for a bit. Only added it for completeness in the first place.
Stay tuned
Just to confirm, the only changes you made was to the Set Influx Data node...correct? I just copied that one over to my flow.
Yes, that is correct

