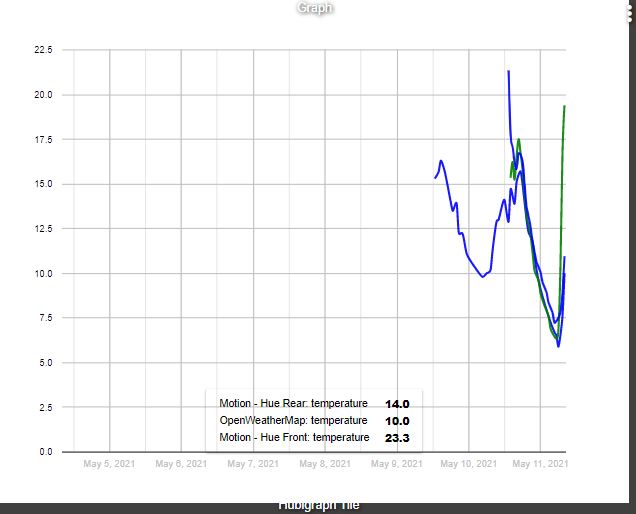
Can anyone give me a pointer on what changes i need to make to get the graph to pull in a longer history. The graph below is from 2 x Hue outdoor sensors giving temperature, and the OWM feed. The Hues are set to an event history size of 1000 at 0.5degree (c) intervals, but if i change this it doesnt seem to be affecting it?
LTS, new one on me. Skimmed the first 250 posts before asking, maybe I missed it! There’s a bit of info about 50 posts (thanks Google) back though, will look into it. Thanks for the tip.
Hubigraph: awesome! I have a couple questions though.
First, my graphs only show up connected to the local dashboard. Does anyone know if they will work via the remote access subscription or is there something else going on that should allow them to work, but I did it wrong?
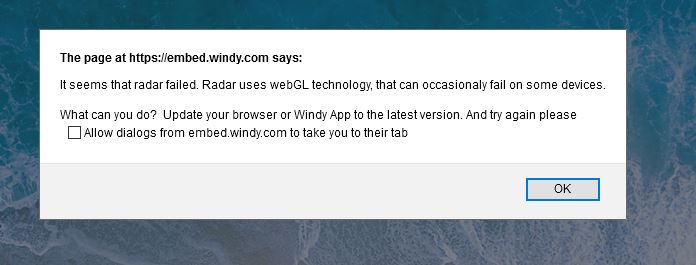
Second, I get this popup periodically using the weather tile:
I actually tried checking the box to prevent dialogs, but they came back anyway when I refreshed. In thinking about it though, I'd imagine there must be a fix for this that I am unaware of. My browser is already the latest version of FireFox so perhaps the Windy app? I really have no idea how that part works. I followed the instructions and it does work, but is there maybe a new version of API and this app isn't using it yet? I really don't know.
I have a graph that records daily energy data and it has been working great, until a couple days ago. I had over a months worth of energy data but for some reason it now only has about 5 days worth. The LTS file has been wiped for some reason.
If I look at the devices events it has data all the way back to Feb stored. It's a virtual sensor that gets a new energy reading every day at midnight. SO the normal HE buffer has enough data I really don't need LTS. So I turned it off.
Is there a way to get the graph to pull in the old event data?
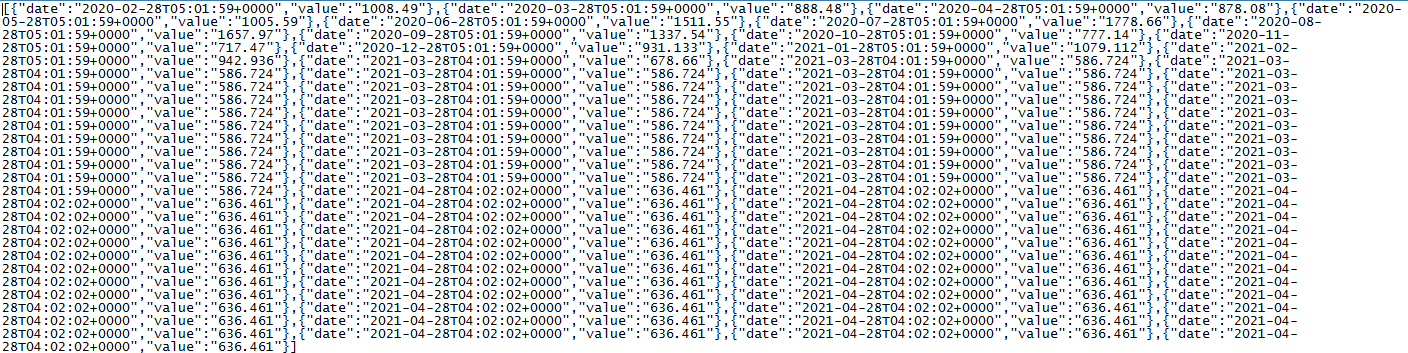
Also I still get several duplicate entries of data in the LTS file. I have another sensor that only gets updated every month. It looks like it re-writes the same month end reading every day. See below. I updated the file manually up to the last two months. After that it was being written by hubigraphs.
Install Hubigraphs using HPM - this should result in the app being available on your hub, but if it is not listed on your apps page you now need to enable it:
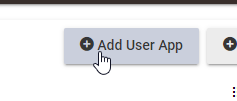
Add User App on the Apps page
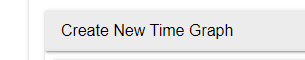
Create the graph you want (as you mention temperature sensors you likely want a Time Graph
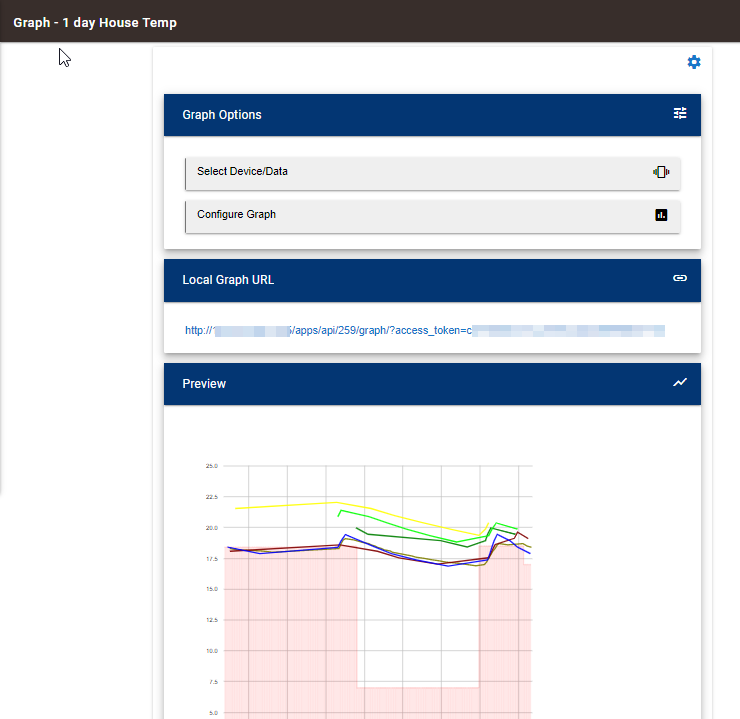
select the sensors you want to graph, set the axes and other settings for the graph. here is an example of mine
@thomas.c.howard or anyone who can answer. I guess I don't understand the buffers for a device.
I have a virtual sensor that I fill once a day with energy info. If I look at events for that virtual sensor then I see every energy value I loaded to that device since I added it. All the way back to August of last year. This is with the standard event and state history buffer sizes. I really only need 32 days worth of data. So it seems to me that the normal buffer is sufficient and I don't need to use LTS. If I turn off LTS I only can get 10 days worth of data in the graph. I increased the buffer size for event history and state history and it made no difference.
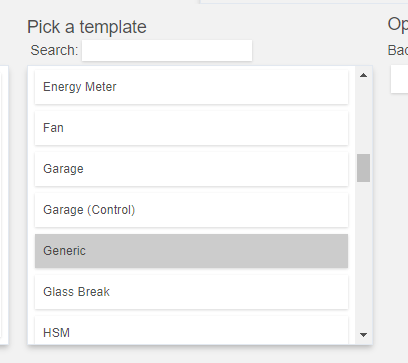
I'm having the same issue. There is no graph template for the dashboard. The child device is there with the graph attribute, it's just not available as a template.
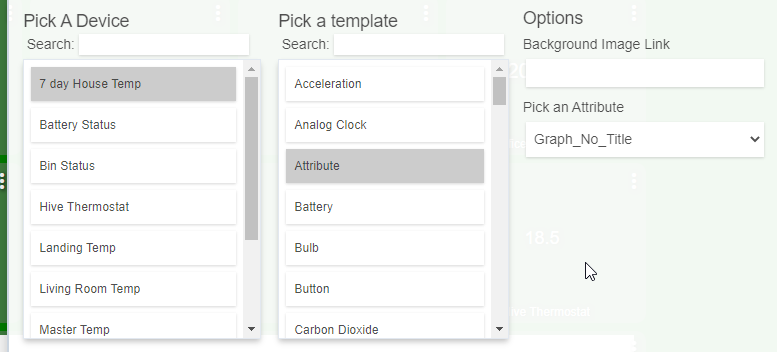
I know I'm probably missing something simple but......I created a radar tile (Windy) but it will not display. I choose the Radar Tile, then Attribute and then Graph but the tile displays blank. (It does show Hubigraph Radar Tile) at the bottom. Any guidance is appreciated