I tried the v2 tile before it's green in color. No option to modify it. It's way smaller than the first one. I'm about to give up on it because it looks even worse on my tablet. Actually all i see is a green blob LOL
Your comments make me wonder; what is the pixel size of the tile, then what is the tile size (from the dashboard); finally, what tablet device are you using?
V2 should never just show a blob; V2 is also a result of me learning some web programming… so to configure it… double click (on a desktop/laptop) on the ugly green tiles. To resize, drag the lower right corner….
@thomas.c.howard Not a issue at all.
But getting this when upgrading CoCoHue on HE.
Error Occurred During Installation
An error occurred while installing the package: Failed to install file https://raw.githubusercontent.com/tchoward/Hubitat/master/HubiGraph.js. Please notify the package developer.
If you get a chance can you steer me to a way to fix this - no rush, no problem - can work around it.
I'm having a weird problem that I hope folks can help me debug. Recently my weather tile has stopped updating. If I reload my dashboard the tile updates, but otherwise it never changes. The rest of my dashboard works fine, and I haven't made any recent changes to Hubigraphs or the Weather Tile. Thoughts?
How often are you updating? If too many instances update too frequently, OW will throttle…. Look at the logs, it should give an indication
I had it set for 5 minutes. HOWEVER, I discovered that somehow, I had the open weather child device installed twice. I removed the duplicate device and set the refresh to 10 min. Hopefully that will do it. Thanks!
Unfortunately deleting the duplicate child device and reducing the refresh frequency didn't help. My dashboards (running on Fully on some fire tablets) don't update. However, if I manually refresh the dashboard they display current data. In other words, the issue seems to be "pushing" the update to the dashboards rather than throttling from OW. The rest of the panel updates just fine. Suggestions? Should I remove and reinstall?
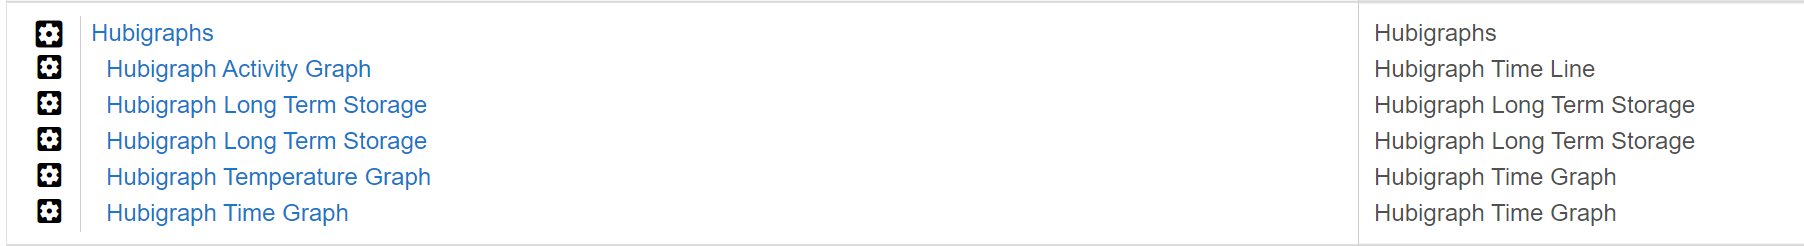
@thomas.c.howard I finally managed to pull the finger out and started to create a new temperature graph.
I have 14 devices selected and they all have data in LTS
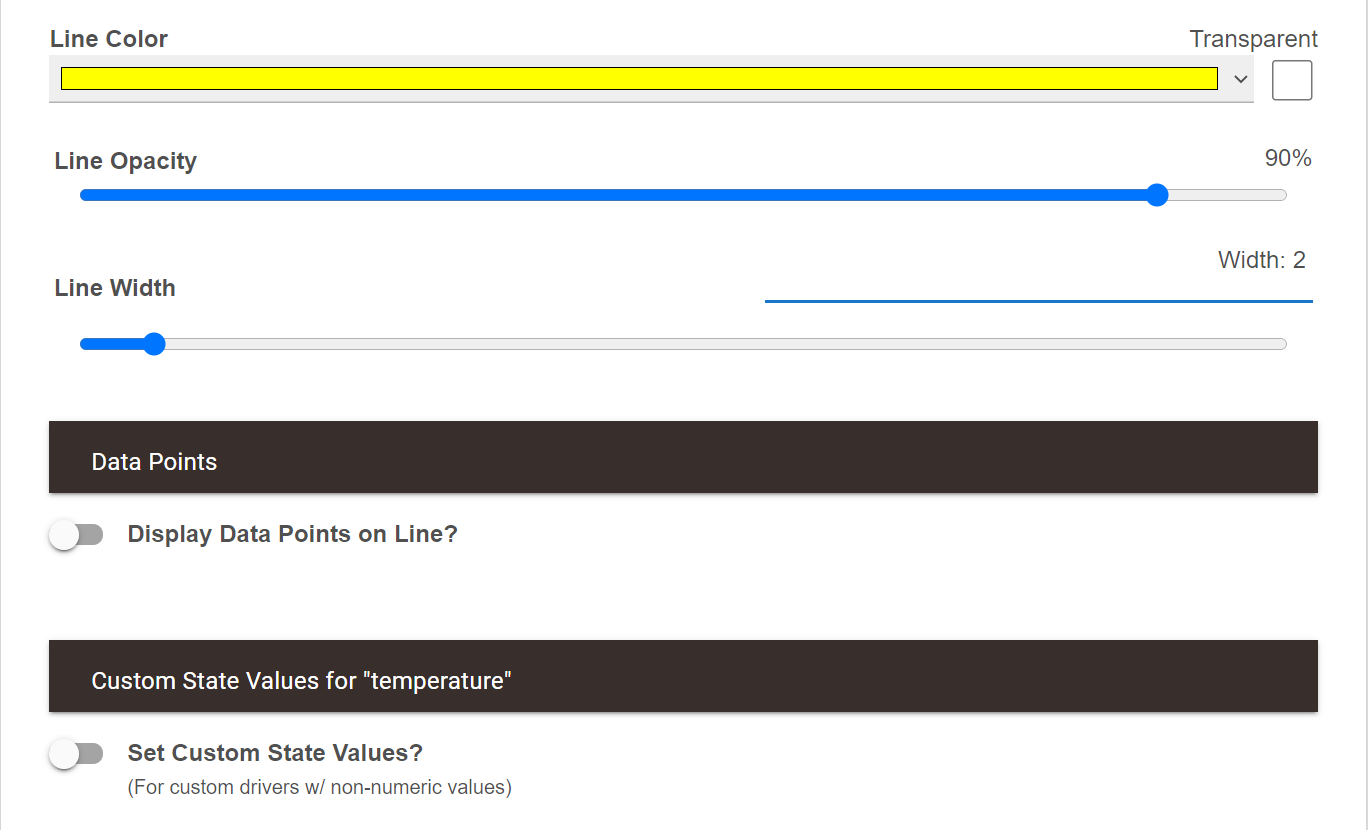
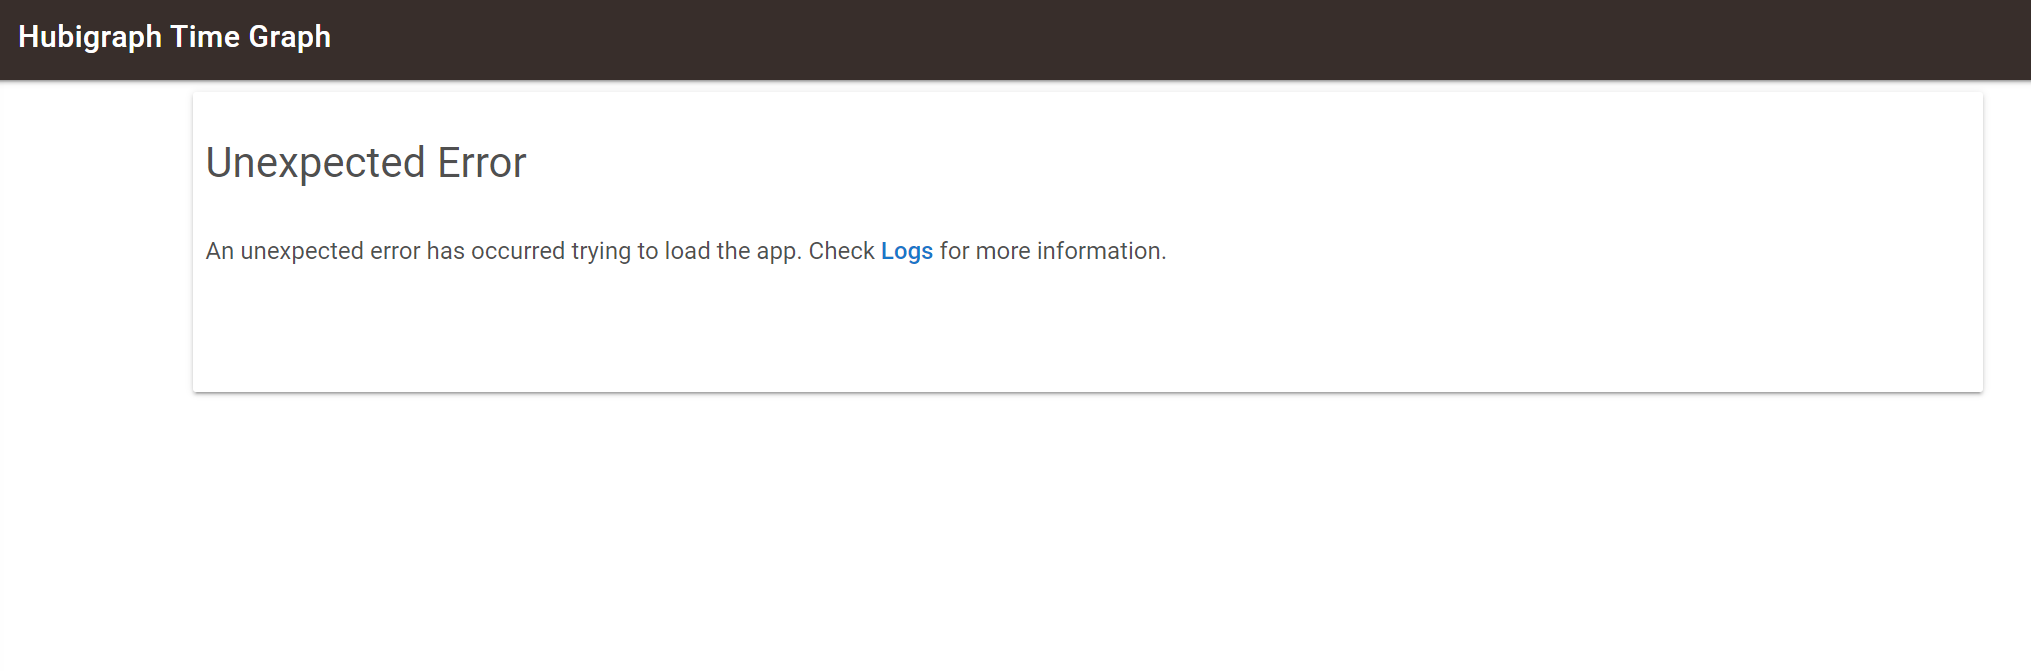
When I go and configure the various colours and display options for the data when I get to my 4th device and I try to enable Display Data Points on Line I get the Unexpected Error same as before and asking me to check the logs.
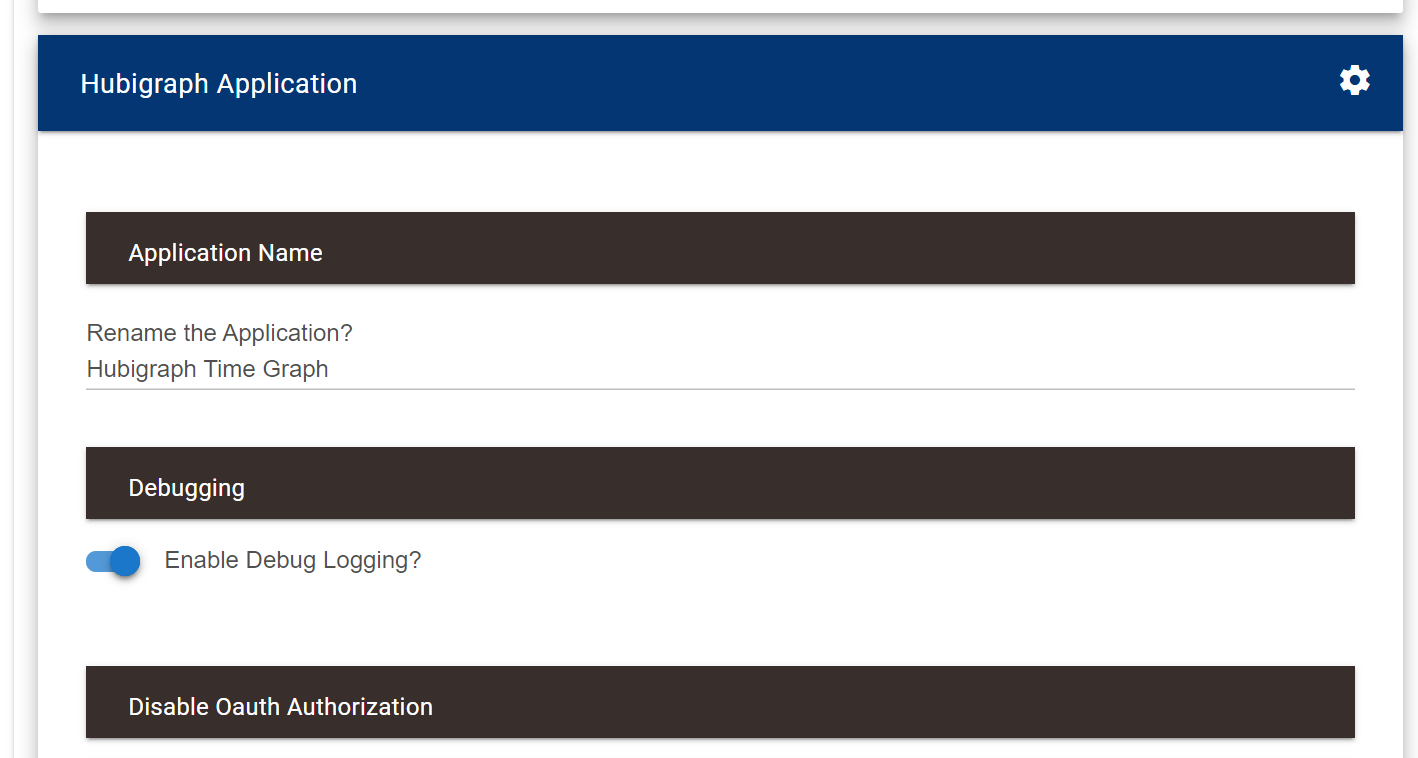
This is a brand new child app that I just created and I have enabled the debug logging, but nothing shows up in the logs.
Is there something fundamentally wrong if I don't get any logs from Hubigraphs?
Any suggestions for me to debug this issue? What things can I try to give you more information?
I still have the older Hubigraphs temperature child app that I left there so I can copy the various settings. That shouldn't be causing issues with a separate child instance should it?
The other thing that I'm doing in potentially a weird way is that I set up 2 Long term storage child apps. One stores the temperatures for my devices, the other one stores motion, acceleration and contact sensor information
No logs is strange. Do this: Bring up the logs in a separate tab and run it again. The current logs should show an error... Looking at the code I don't see anything that would cause a crash... But....
Input Validation suggestion: It took me a while to realize that the storage interval dropdown wasn't set on ONE of my temp sensors, causing all of them to light up red.
Thanks; I’ll make the fix
1 Like
Hubigraph long term storage is showing the below error in the log. Can someone tell me how to correct this?
app:1832021-04-24 02:00:01.066 errorError installing file: groovyx.net.http.HttpResponseException: Server Error
app:1832021-04-24 01:00:01.168 errorError installing file: groovyx.net.http.HttpResponseException: Server Error
app:1832021-04-23 18:00:01.678 errorError installing file: groovyx.net.http.HttpResponseException: Server Error
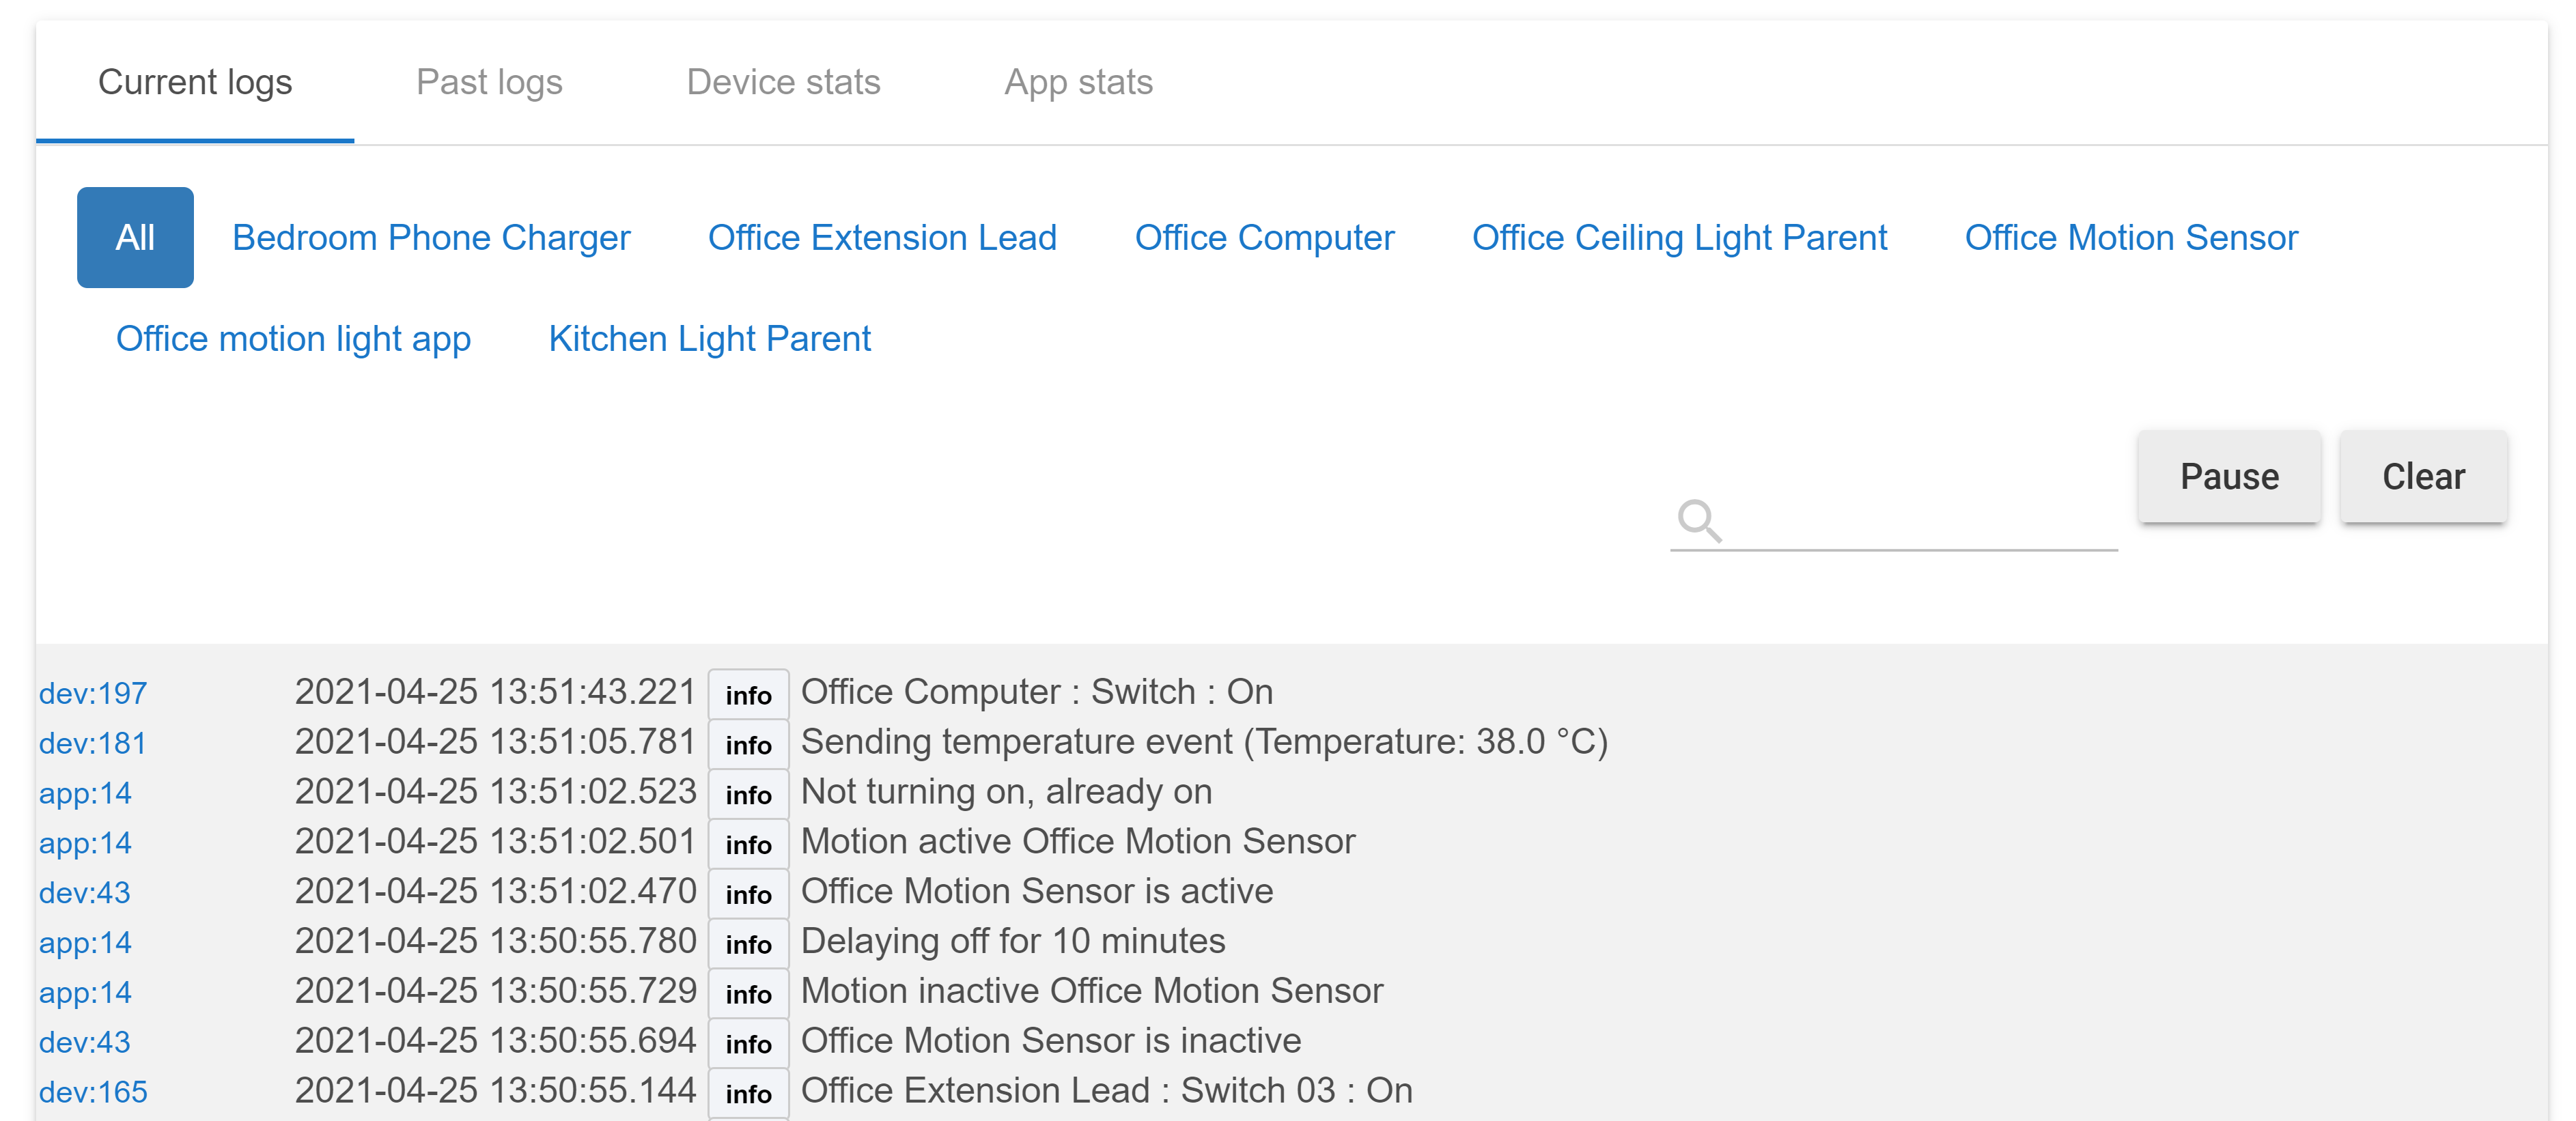
Yeah there's definitely no logs at all. Opened up the logs in a separate window and nothing comes up.
The debug logging is enabled
And as you can see no logs at all from Hubigraphs.
What my next course of action?
This is the error that's coming up like I shared before:
I am seeing the below ERROR in the my log by Hubigraph long term storage.
Can someone tell me how to correct this?
app:1832021-04-24 02:00:01.066 errorError installing file: groovyx.net.http.HttpResponseException: Server Error
app:1832021-04-24 01:00:01.168 errorError installing file: groovyx.net.http.HttpResponseException: Server Error
app:1832021-04-23 18:00:01.678 errorError installing file: groovyx.net.http.HttpResponseException: Server Error
TWO Minor requests:
- On the Ranges Graph can you support printing negative numbers in addition positive numbers
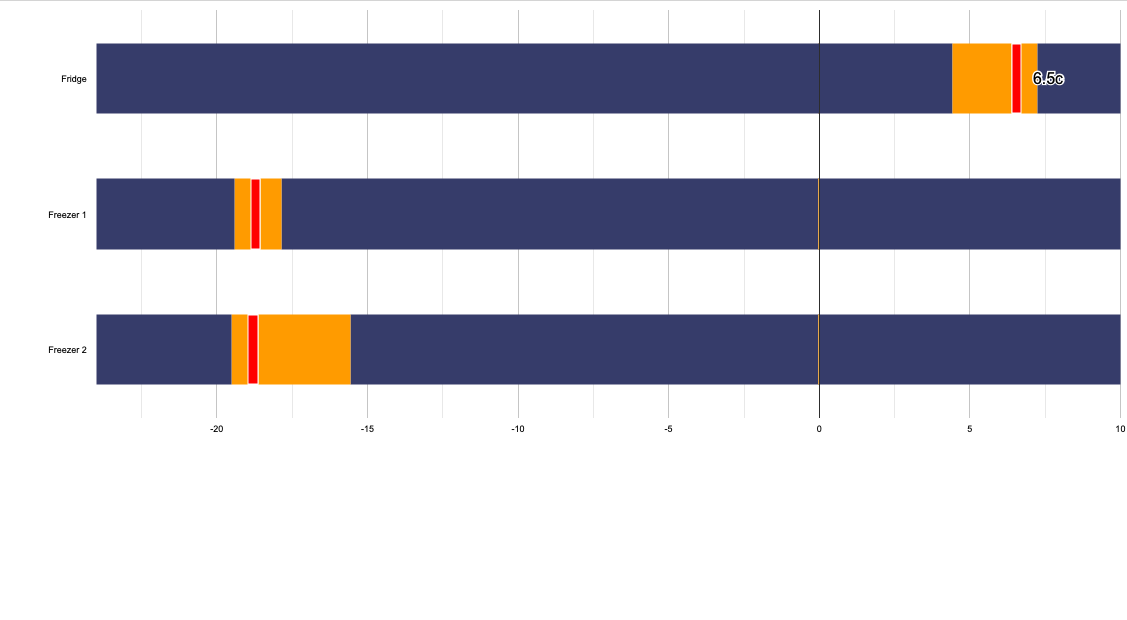
ie the Fridge, a positive number displays, the two Freezers do not show current temp as they are negative
AND 2
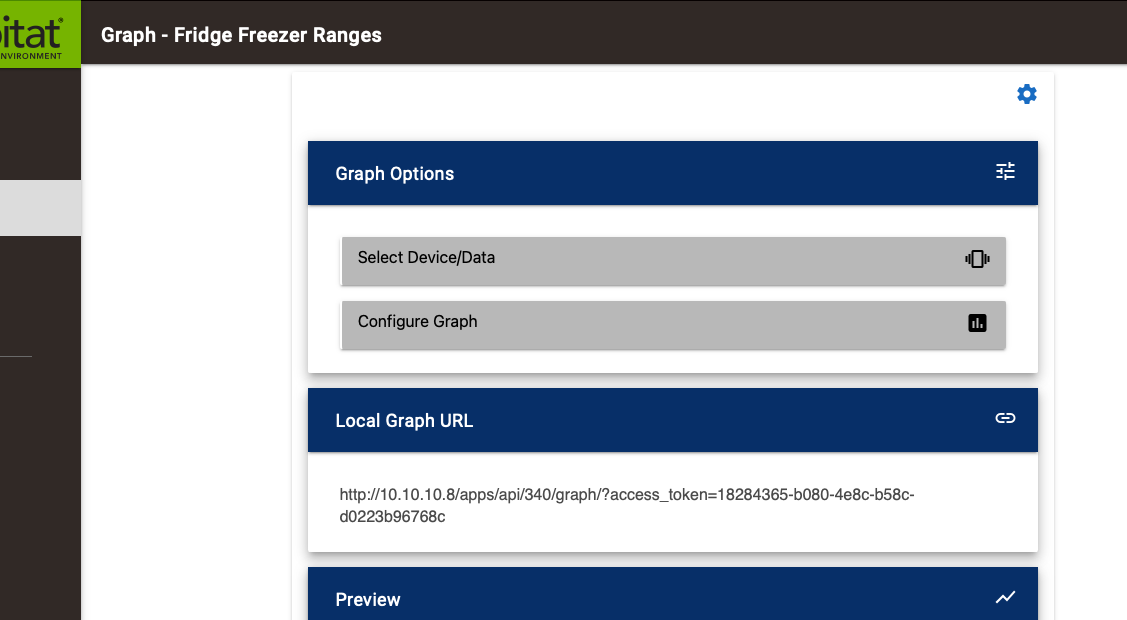
Can you make the Ranges Graph URL active so clicking on it takes you to the graph, the same as other graphs?
Thanks
1 Like
I have a similar problem with range graph that dashboard running with fully kiosk browser does not refresh range graphics. Time graphics is updated and refressed correctly.
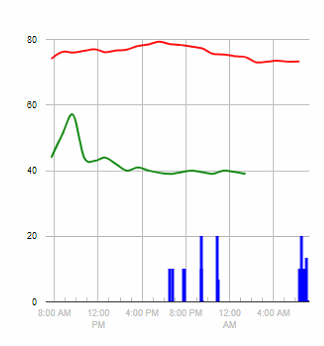
What is a good setting to show motion in graphs? Currently have it set to '20' on active, '0' for inactive. I have Time Integration as Average and this is what I get (in blue).
This is for bathroom humidity/temp/motion for the curious.
This is awesome! I have an 11 year old ASD/ADHD child that I would LOVE to get into scripting/programming, but I am NOT a coder. Did you teach your son or did he pick it up on his own? If he got it on his own, how?
3 Likes
Hubigraphs is mind-blowing, far exceeds what I was looking for, thank you @thomas.c.howard !
how do I fix this, for the cloud view? dug through the posts, found/fixed the "allow insecure content" thing, now this...
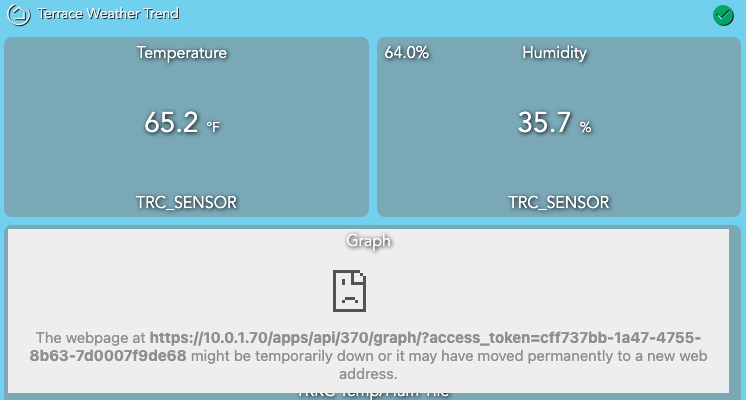
Is the IP address shown the current IP of your hub? Is it possible that your hub IP has changed recently?

