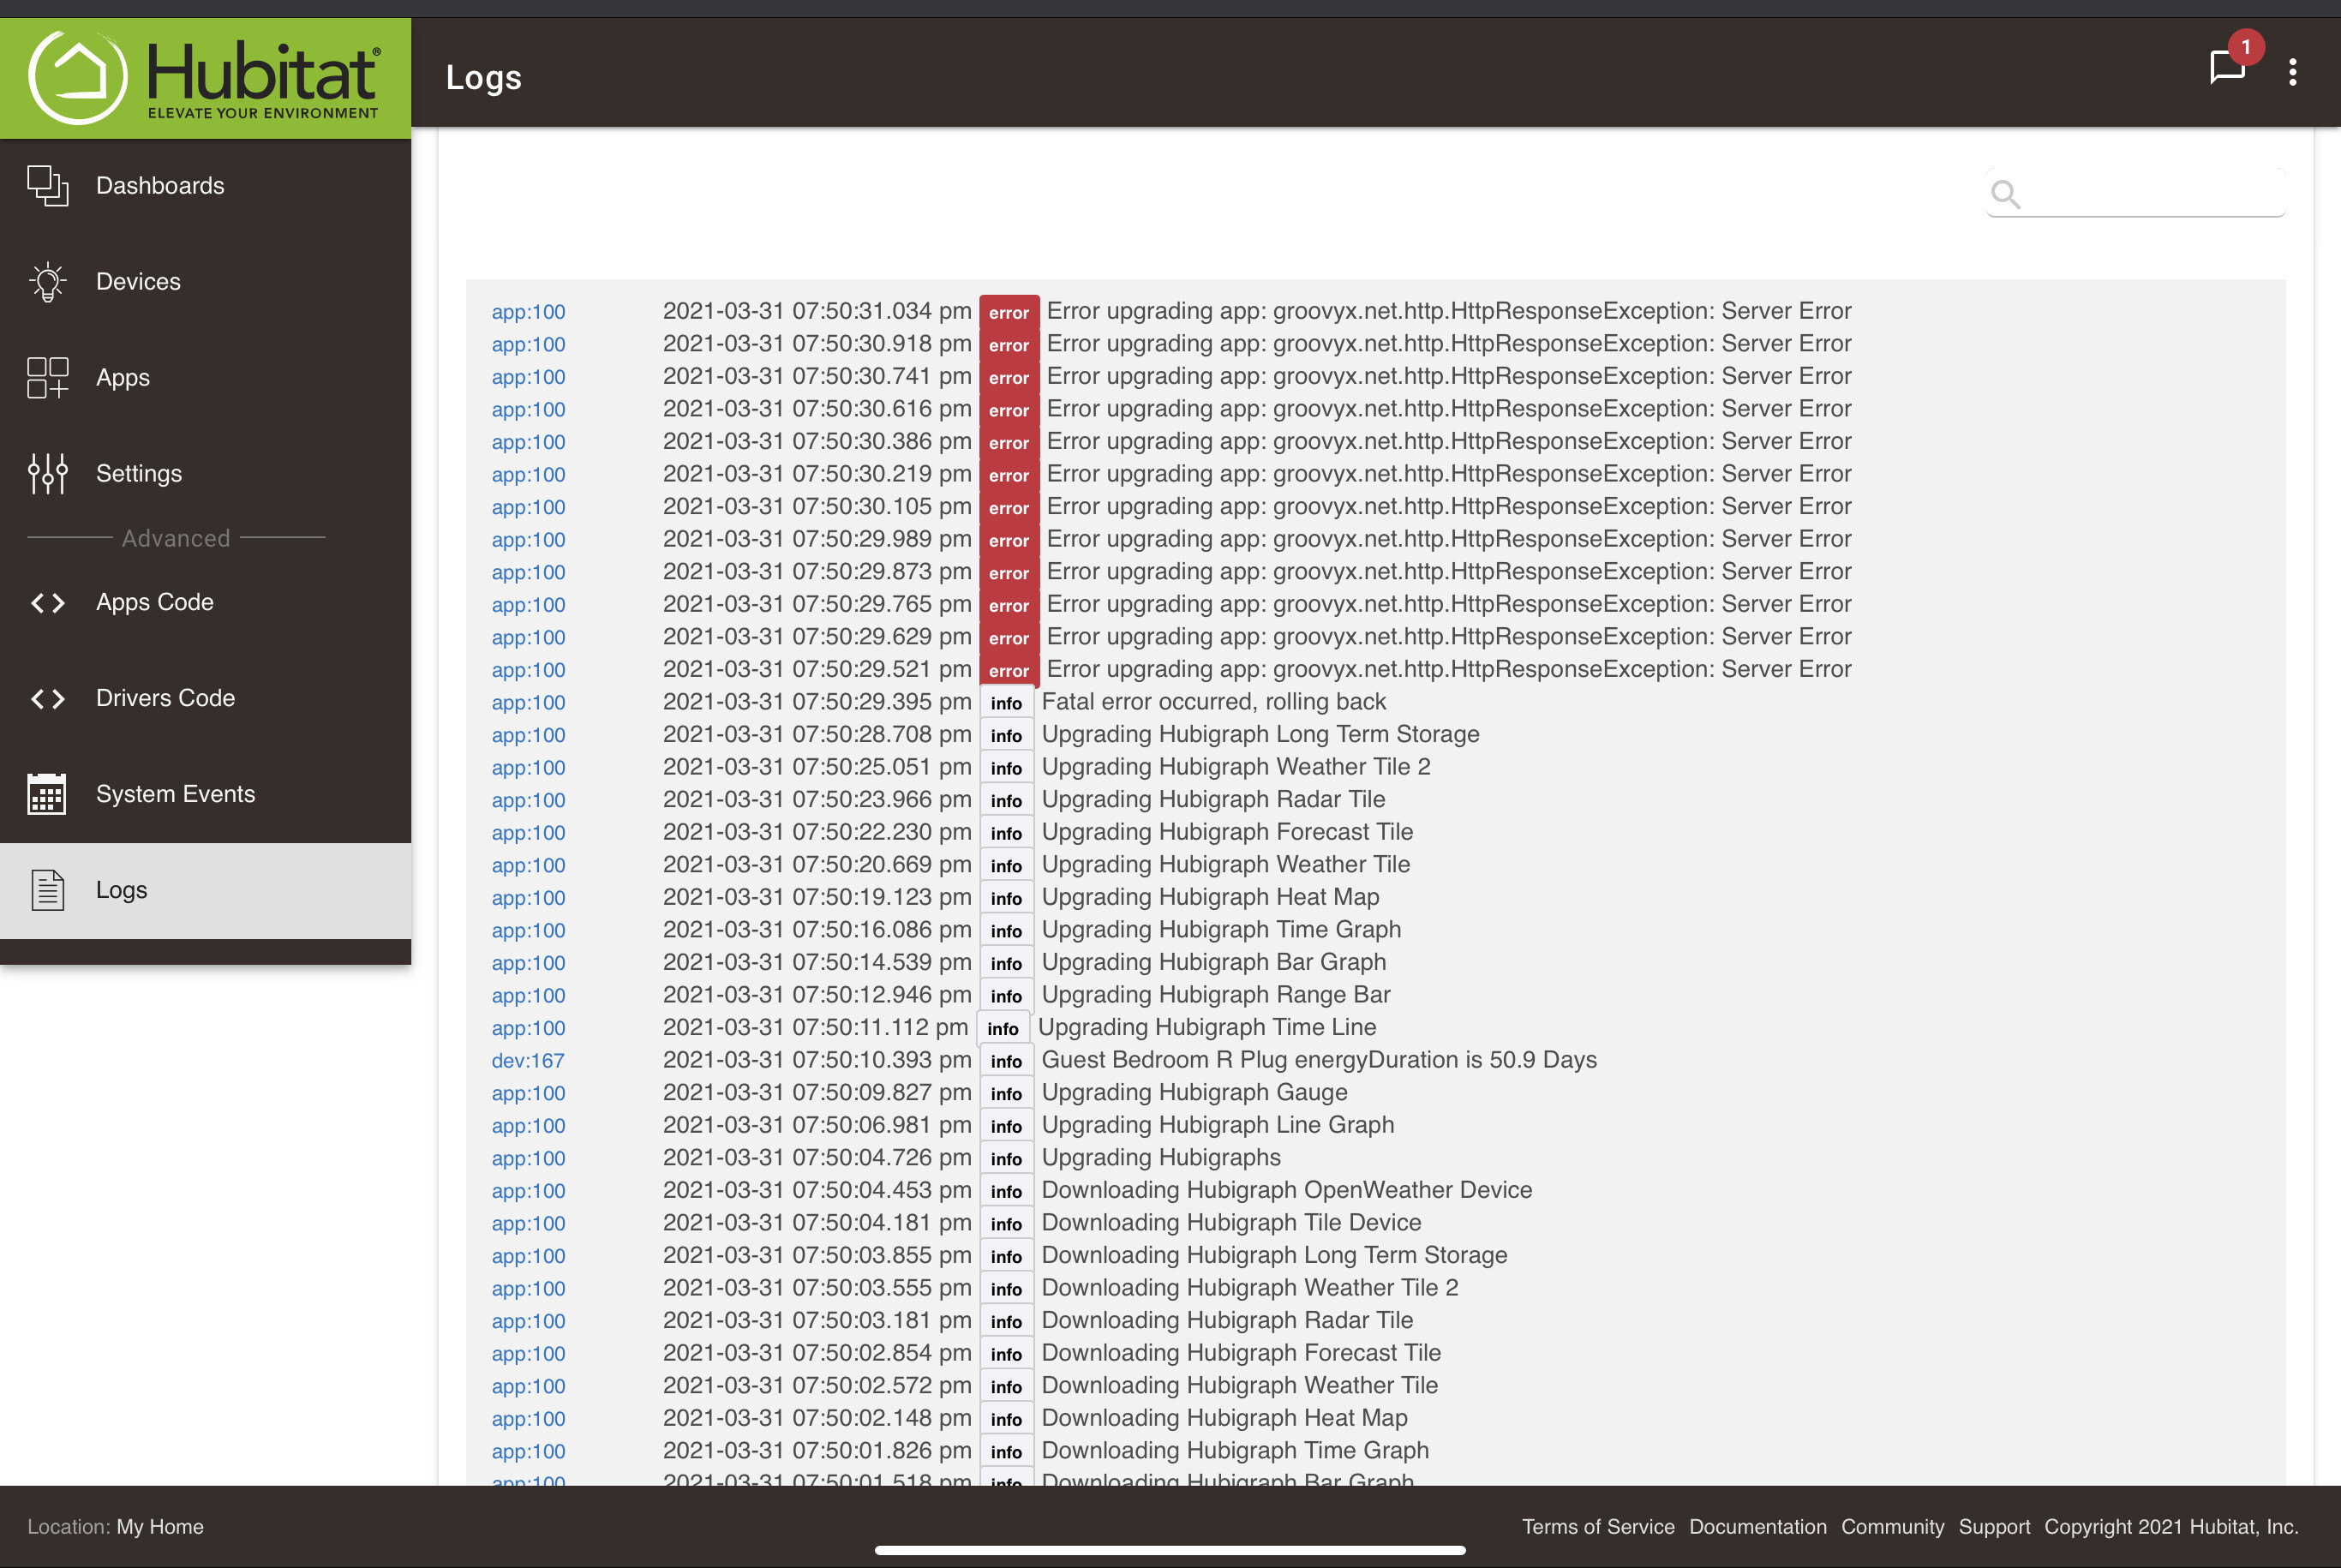
I have the logs opened up and I don't see any new logs being generated.
I did however notice earlier on some errors when I was opening up various settings on the graph.
app:832021-03-31 18:18:18.228 errorgroovy.lang.MissingMethodException: No signature of method: user_app_tchoward_Hubigraph_Time_Graph_87.longTermStorageUpdate() is applicable for argument types: () values: [] (longTermStorageUpdate)
app:832021-03-31 12:18:18.234 errorgroovy.lang.MissingMethodException: No signature of method: user_app_tchoward_Hubigraph_Time_Graph_87.longTermStorageUpdate() is applicable for argument types: () values: [] (longTermStorageUpdate)
Could this be causing my issue or is there anything else I should be looking at?
The debug logging is enabled, but I don't seem to see any debug logs showing up.
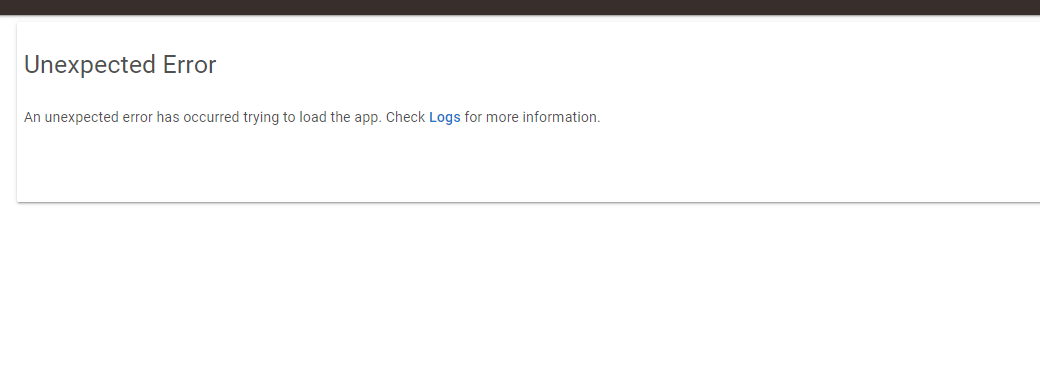
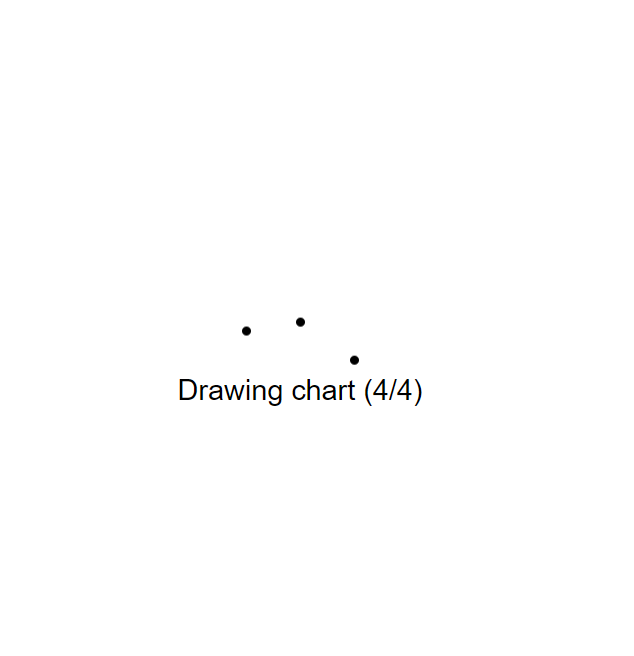
One more thing to add is that after the error shows up I can reload the app and it displays ok, however the graph itself gets stuck on drawing chart
Is there a limit on how many devices I can have a graph for? At the moment I have 11 and when I try to add a 12th that's when I see the issue. Or is there a limit on the number of datapoints that can be graphed before there are errors?
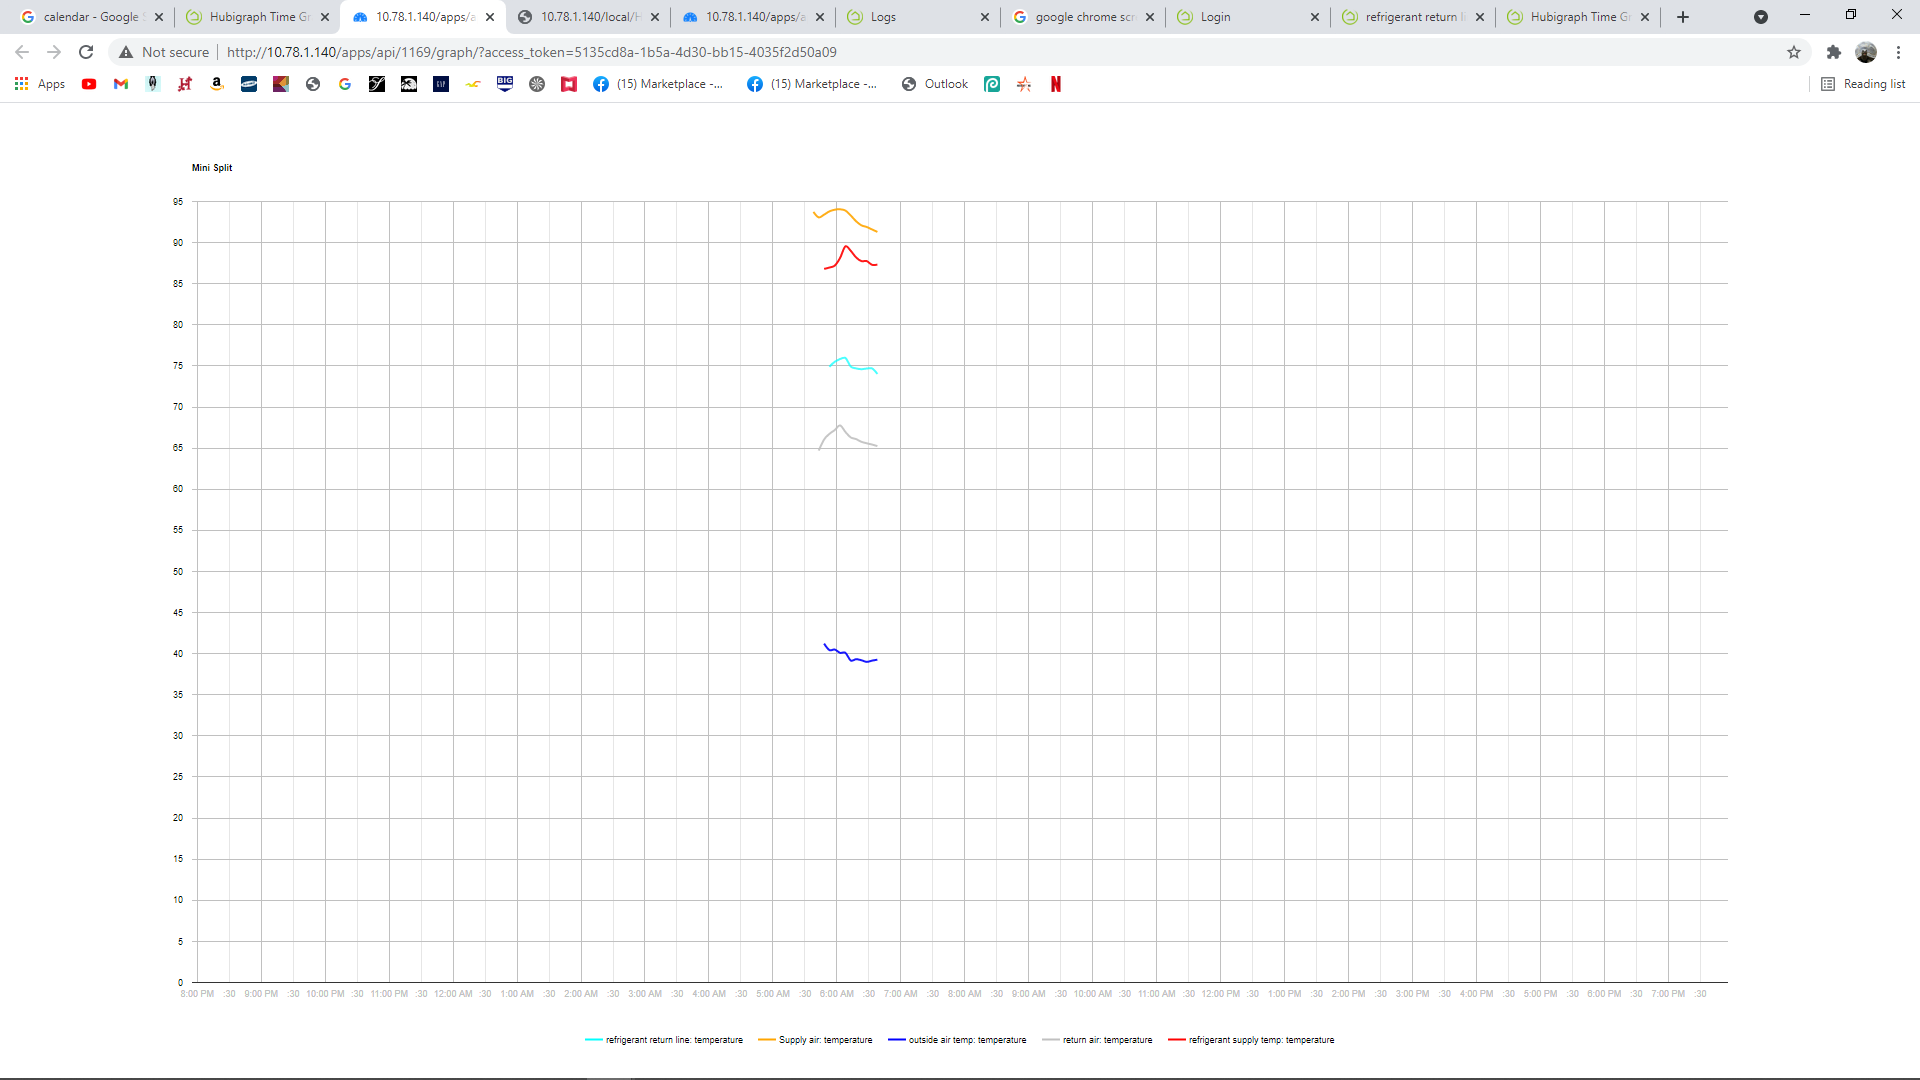
I had this graph of my Fibero smart implant working for the past week and this morning it stopped updating. In the logs I am getting a error that looks like the temp is out of range, but when I go to the device all of the reading are normal. I have rebooted the hub and am now looking for any other advice.
app:11692021-03-31 08:19:38.599 pm debugBad value in Parse: 4E+1
app:11692021-03-31 08:19:38.596 pm debugBad value in Parse: 4E+1
app:11692021-03-31 07:55:31.002 pm debugBad value in Parse: 4E+1
app:11692021-03-31 07:55:30.999 pm debugBad value in Parse: 4E+1
app:11692021-03-31 07:55:27.097 pm debugBad value in Parse: 4E+1
app:11692021-03-31 07:55:27.094 pm debugBad value in Parse: 4E+1
What is this device? the issue is the driver presenting the data as scientific notation....
I just took a look and I explicitly restrict the use of alpha characters (too many people had issues with the value being stored as a string with the units)....
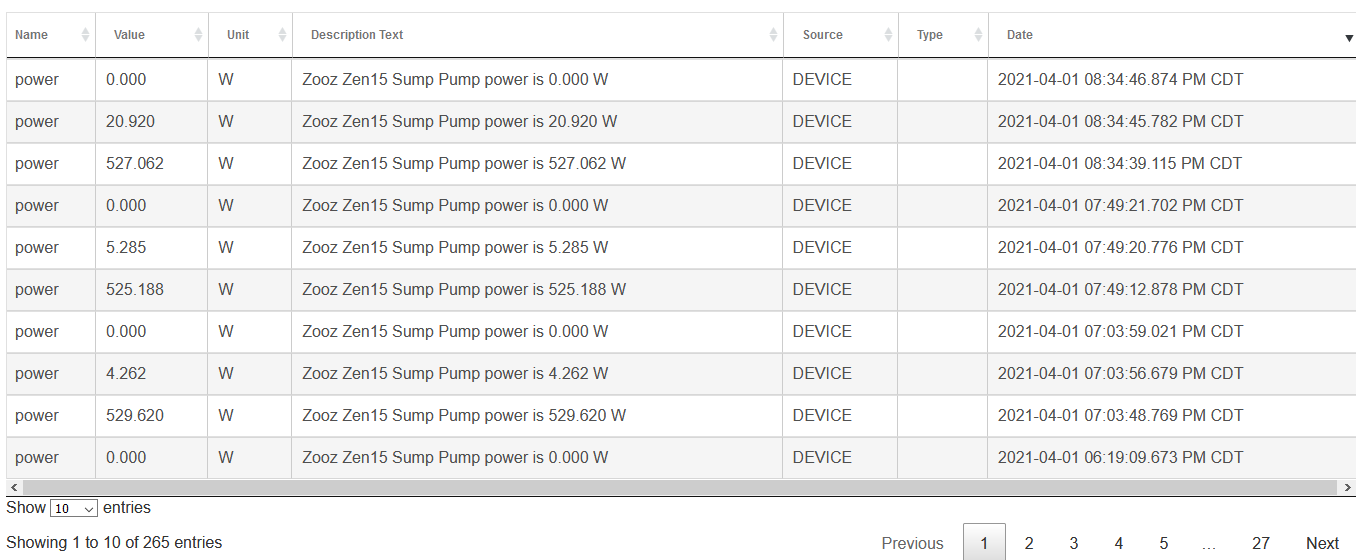
I have timeline setup to monitor a zooz zen15 switch that I have my sump pump on. The device is set up to report when the power changes by 400W. Here is a screenshot of a typical log:
I have the timeline set up with a start value of >450 and end value <300. Problem is sometimes the timeline shows long blocks of time as though power was high for extended time, as below, which isn't the case. Any help on how I can configure this better? MY goal is just to have a timeline of when the pump is on.
@thomas.c.howard I had hoped you weren't going to say that. Yeah I did notice that longTermStorage had changed a lot.
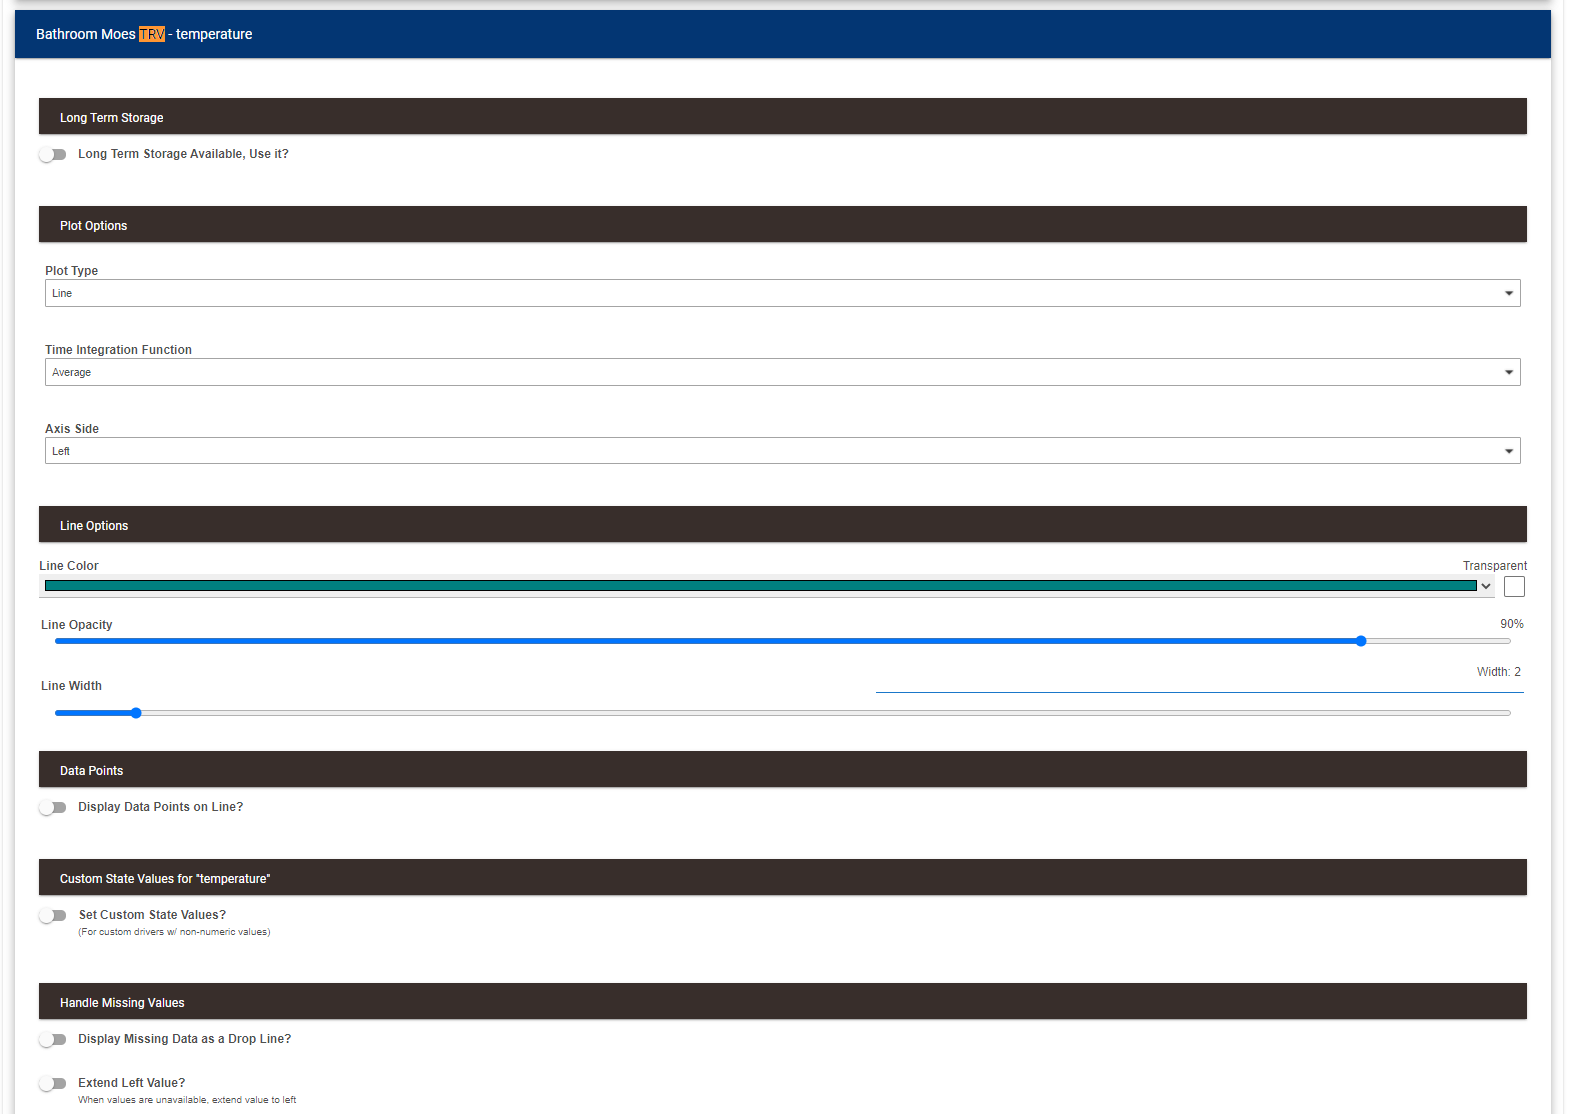
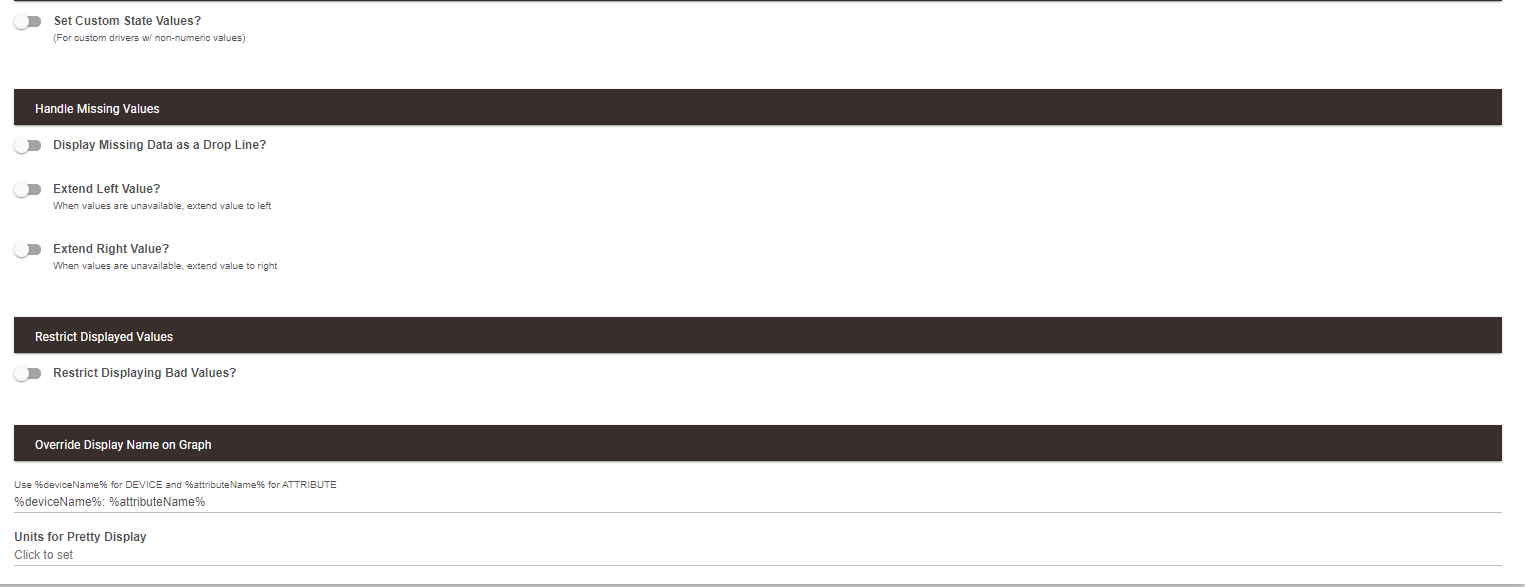
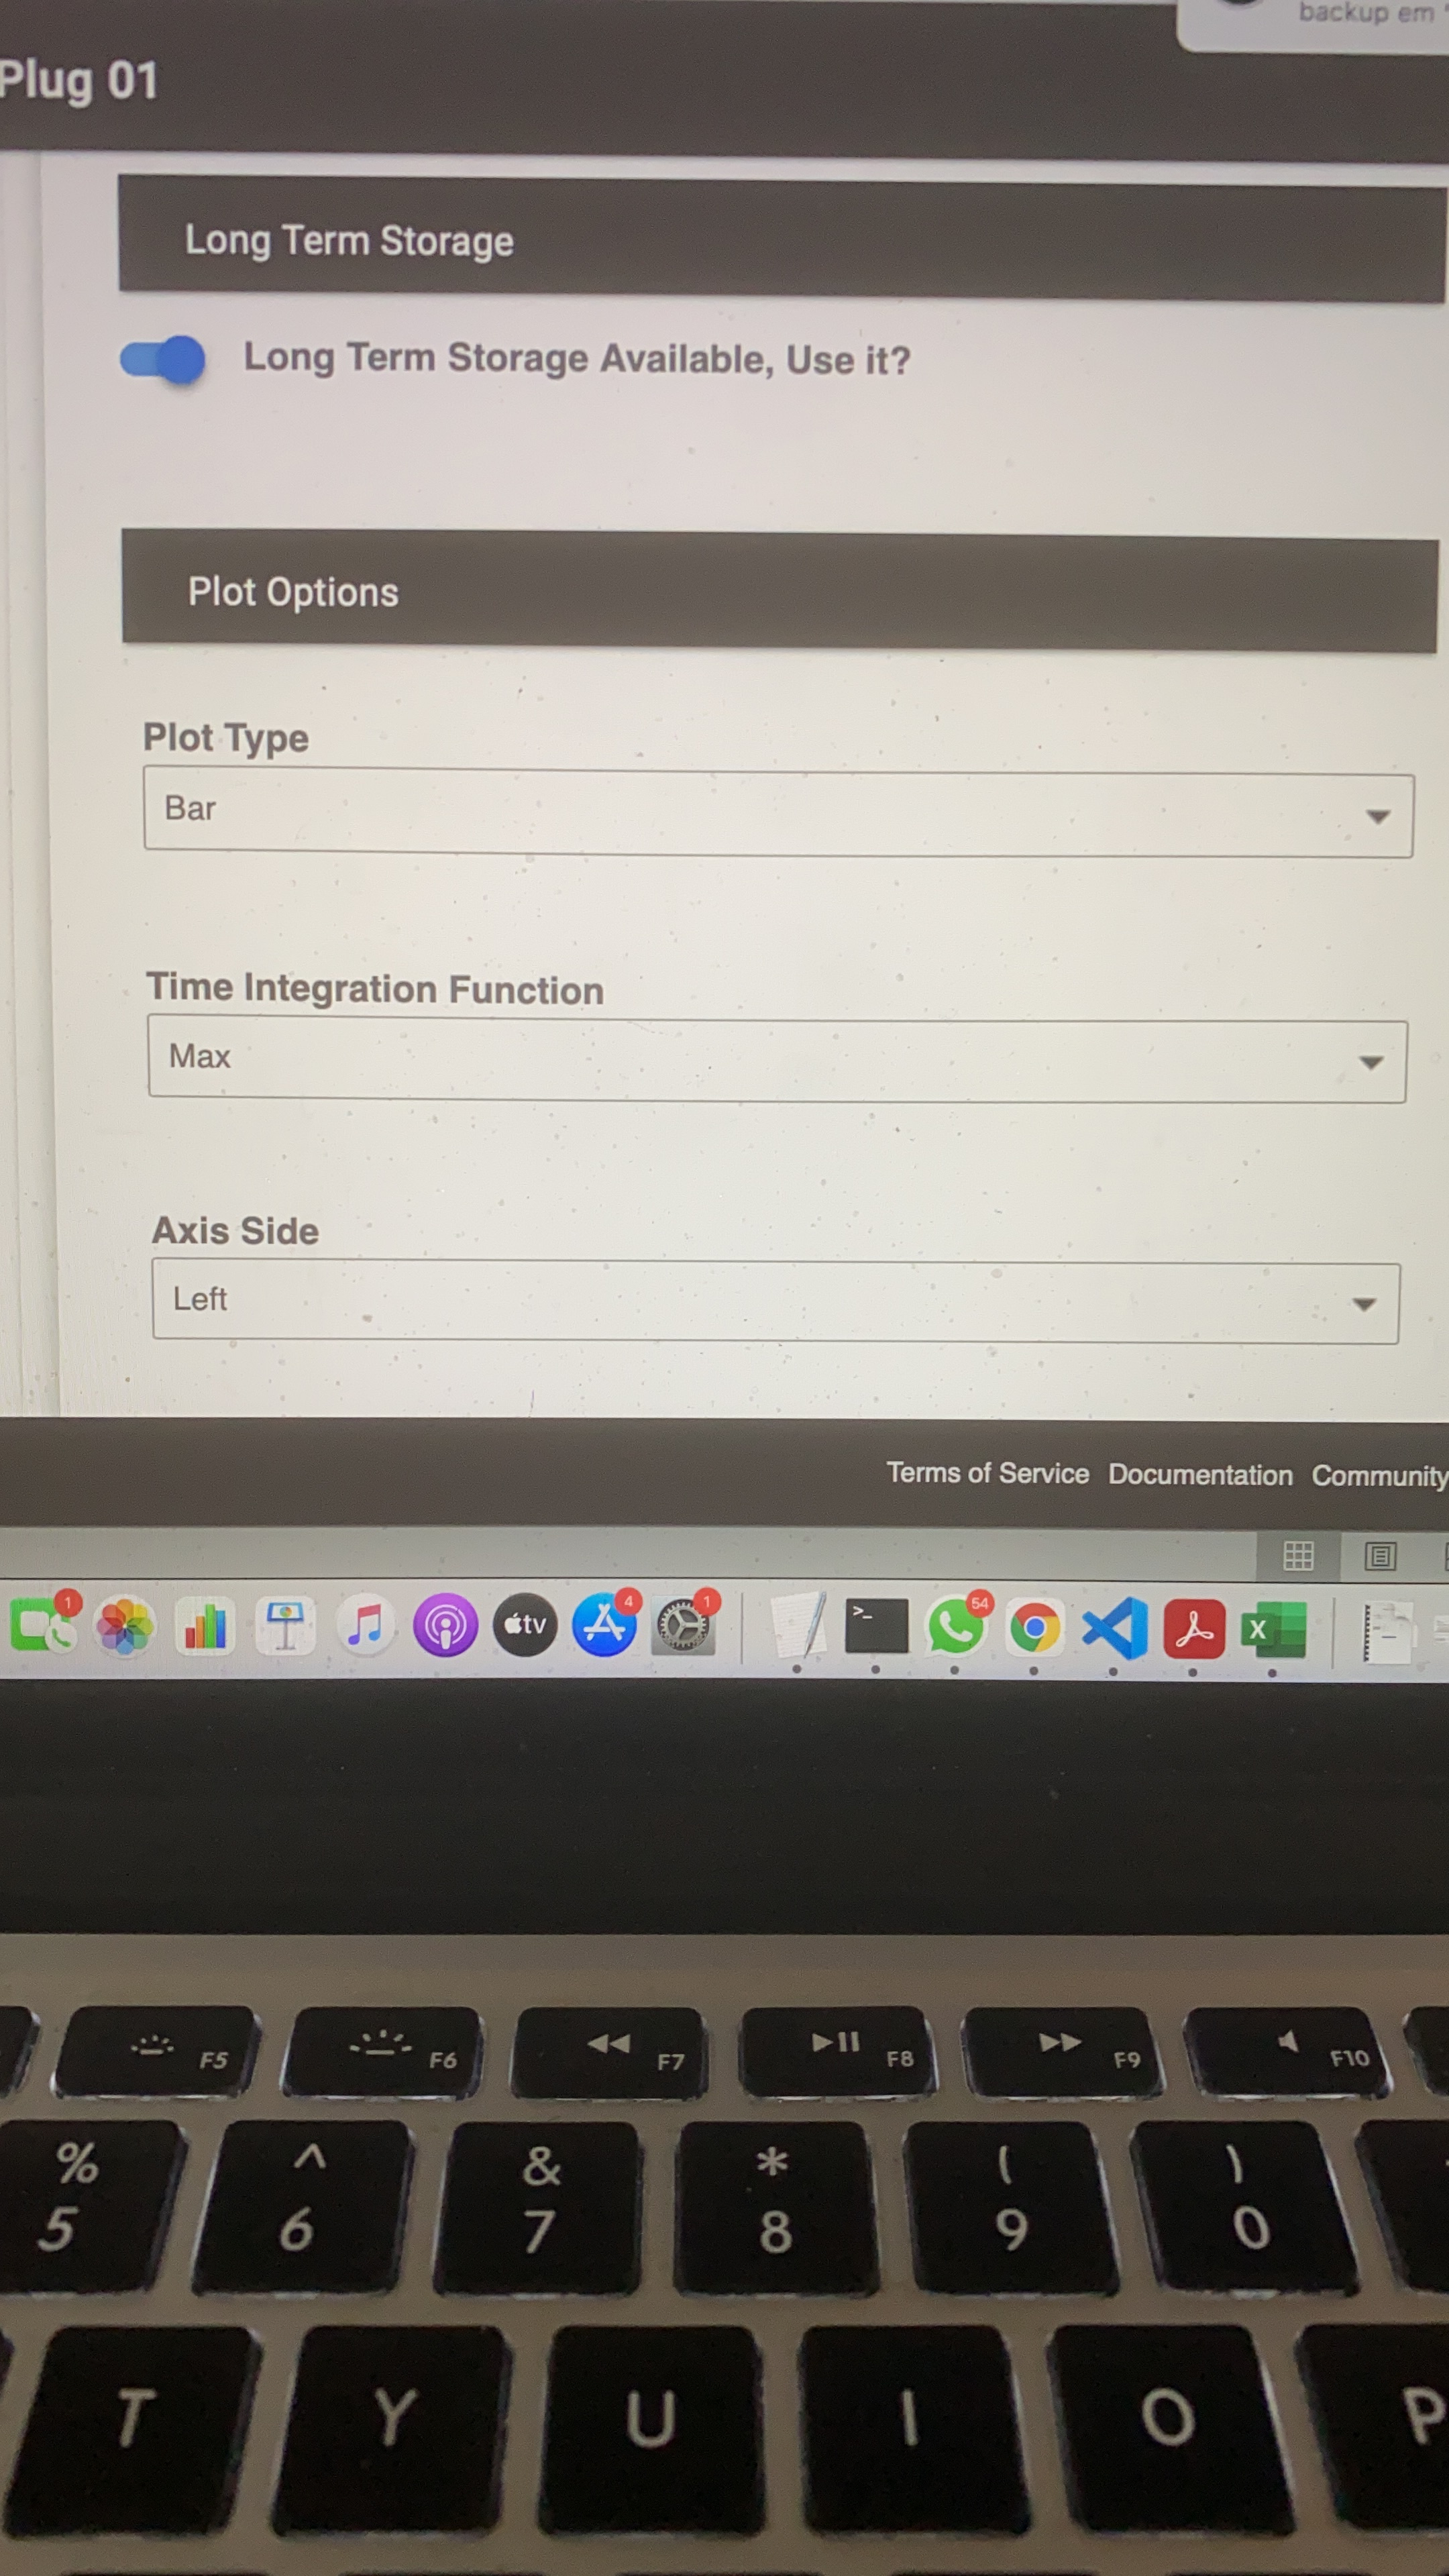
Before I bite the bullet and do that, can you please explain why the existing sensors, still work and the long term storage for them works after enabling the use of long term storage data in the graph itself for every device.
It's only when I try to add new sensors that I get that error.
I'm a bit slow to make a new graph just yet because there's a lot of settings and I customized al lot of the options. I supposed I wish I could write a script to take the settings from one app and apply them to another hubigraphs app
Hi Thomas, Can you help with the following?
I recently had to factory reset my router which has resulted in my static IP addresses being lost and new ones allocated and my hubitat now has a new IP address. I am busy rebuilding my system, but it has resulted in two problems.
(1) The Radar tile; when I went into settings, the Local Graph URL showed the old URL, I can't edit this and as a result I deleted the tile and created a new one. I have selected "install a Hubigraph Tile", but when I do into the dashboards, there is no option so select the new Radar tile. The preview works fine. Do I need to do anything else to display it on a tile?
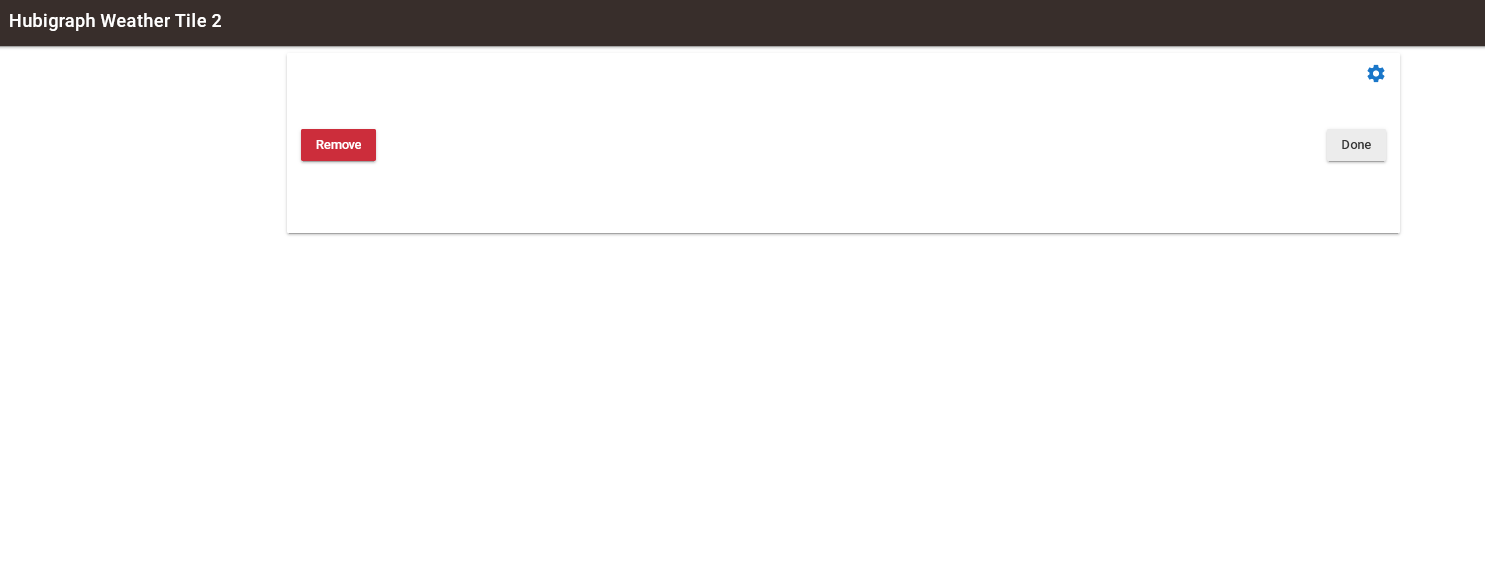
(2) Weather Tile; I had a similar problem with Weather Tile 2 (I needed to change the IP address), but when I go into settings, there is nothing there. I created a new graph under Apps, but again when I go to settings it is blank. Any ideas what the problem is?
I have updated to the latest version of Hubigraphs; I am unsure what the problems are and if they are related to the IP change or whether there is something wrong with my Hubigraph (although it was working fine previously).
This appears to be an issue with the number of State History events for the device. I am betting it is set to 30.... Up that number to cover a full day (or wait until I enable LTS) wait a day and you should be good.
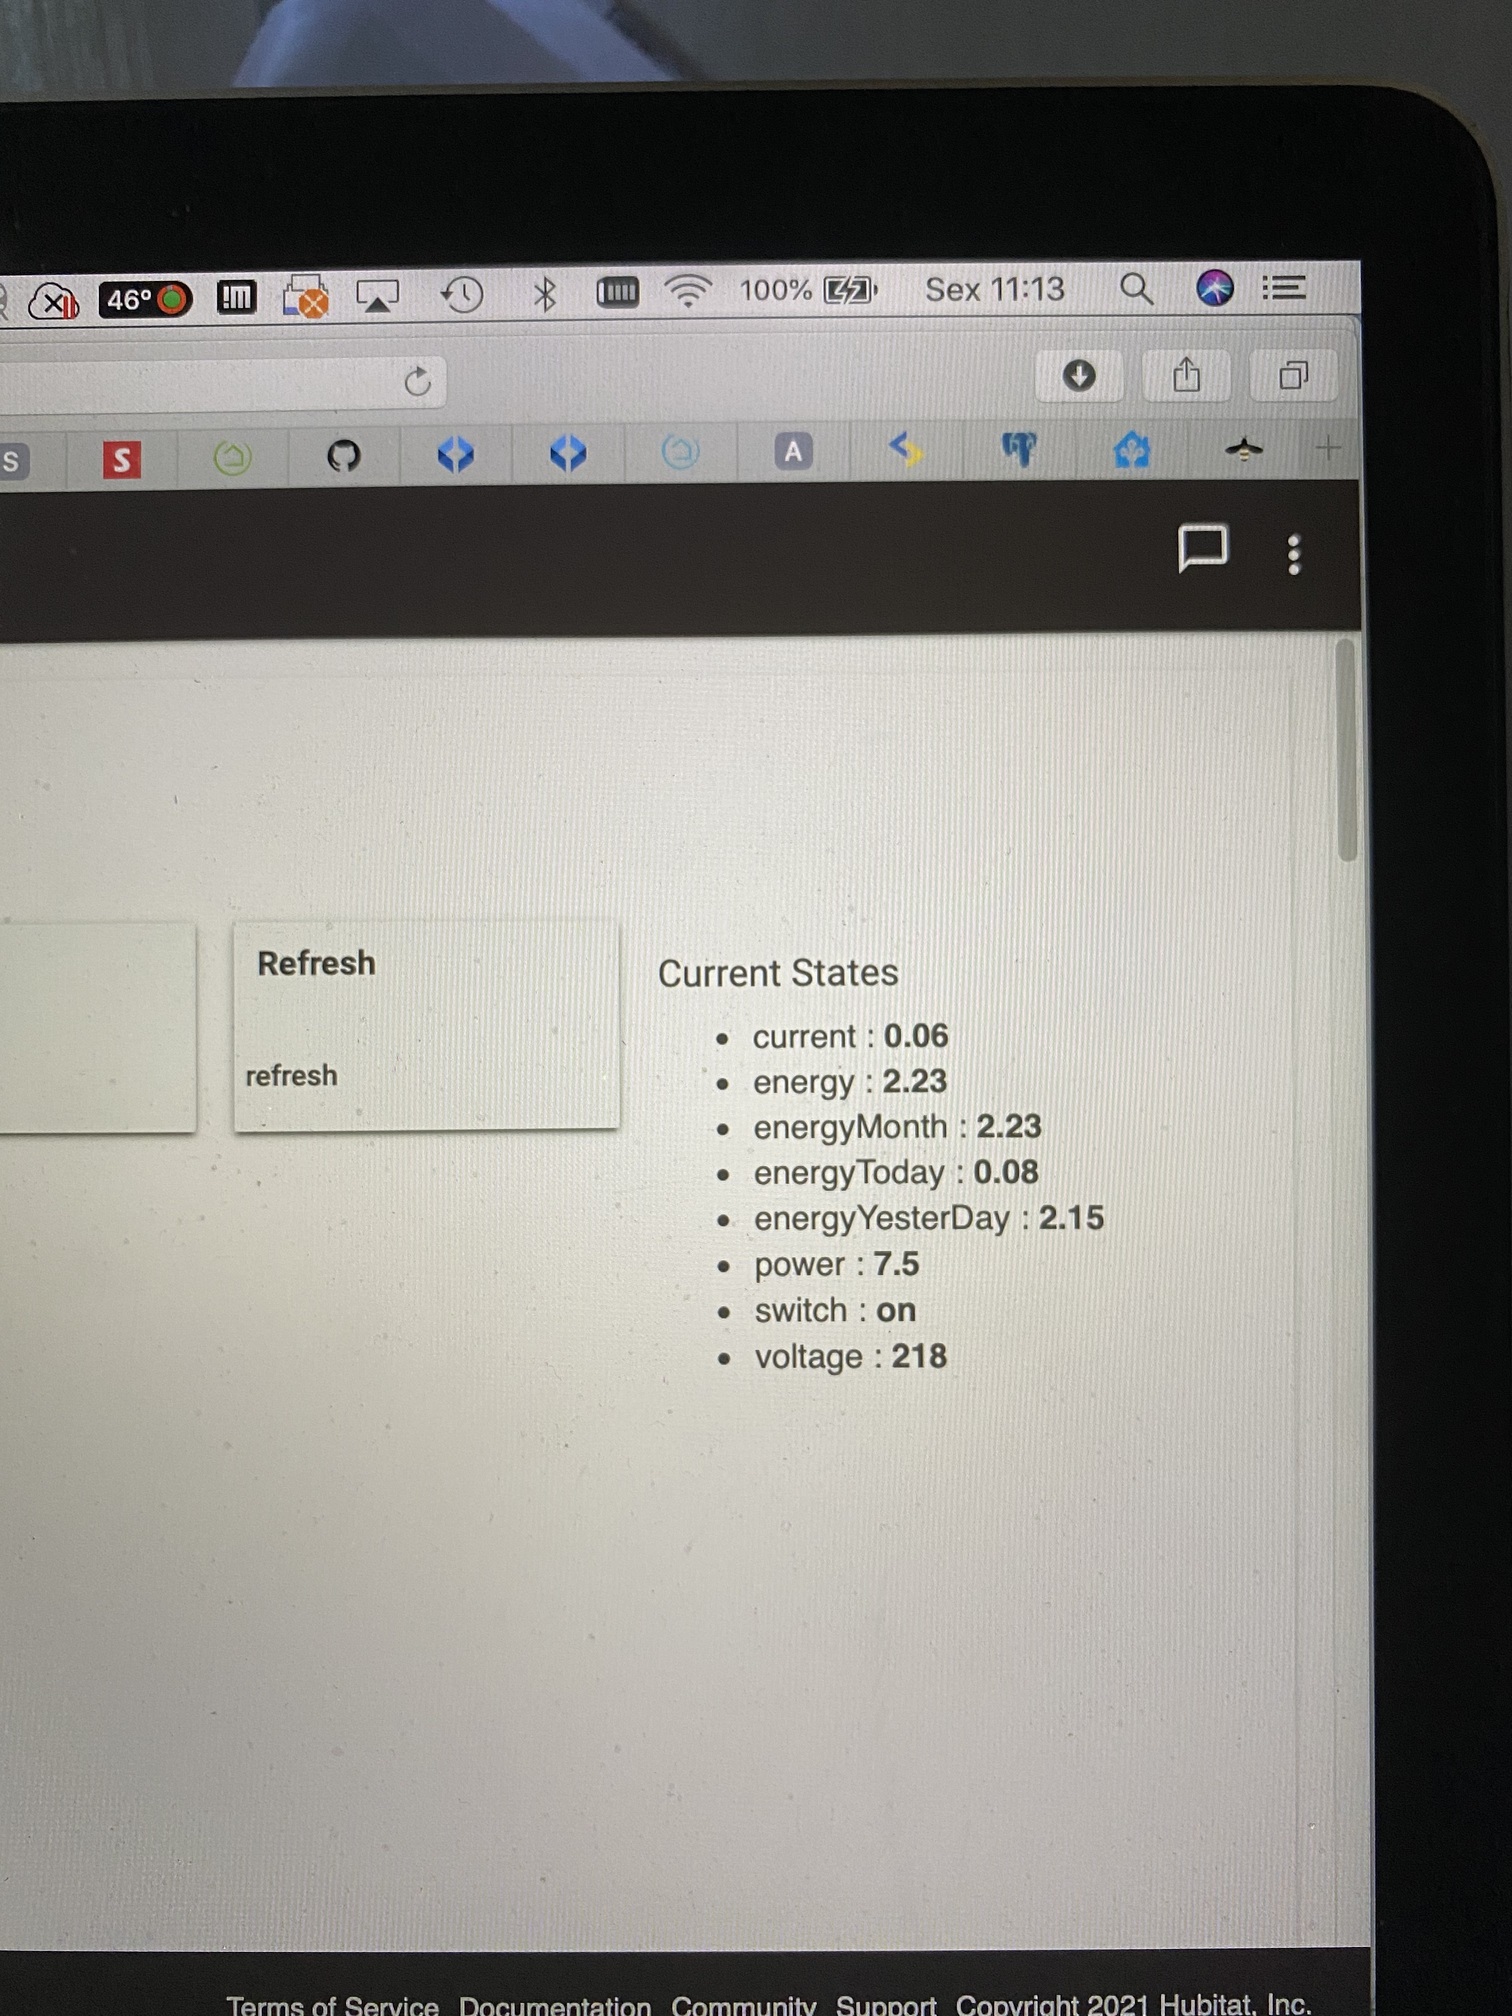
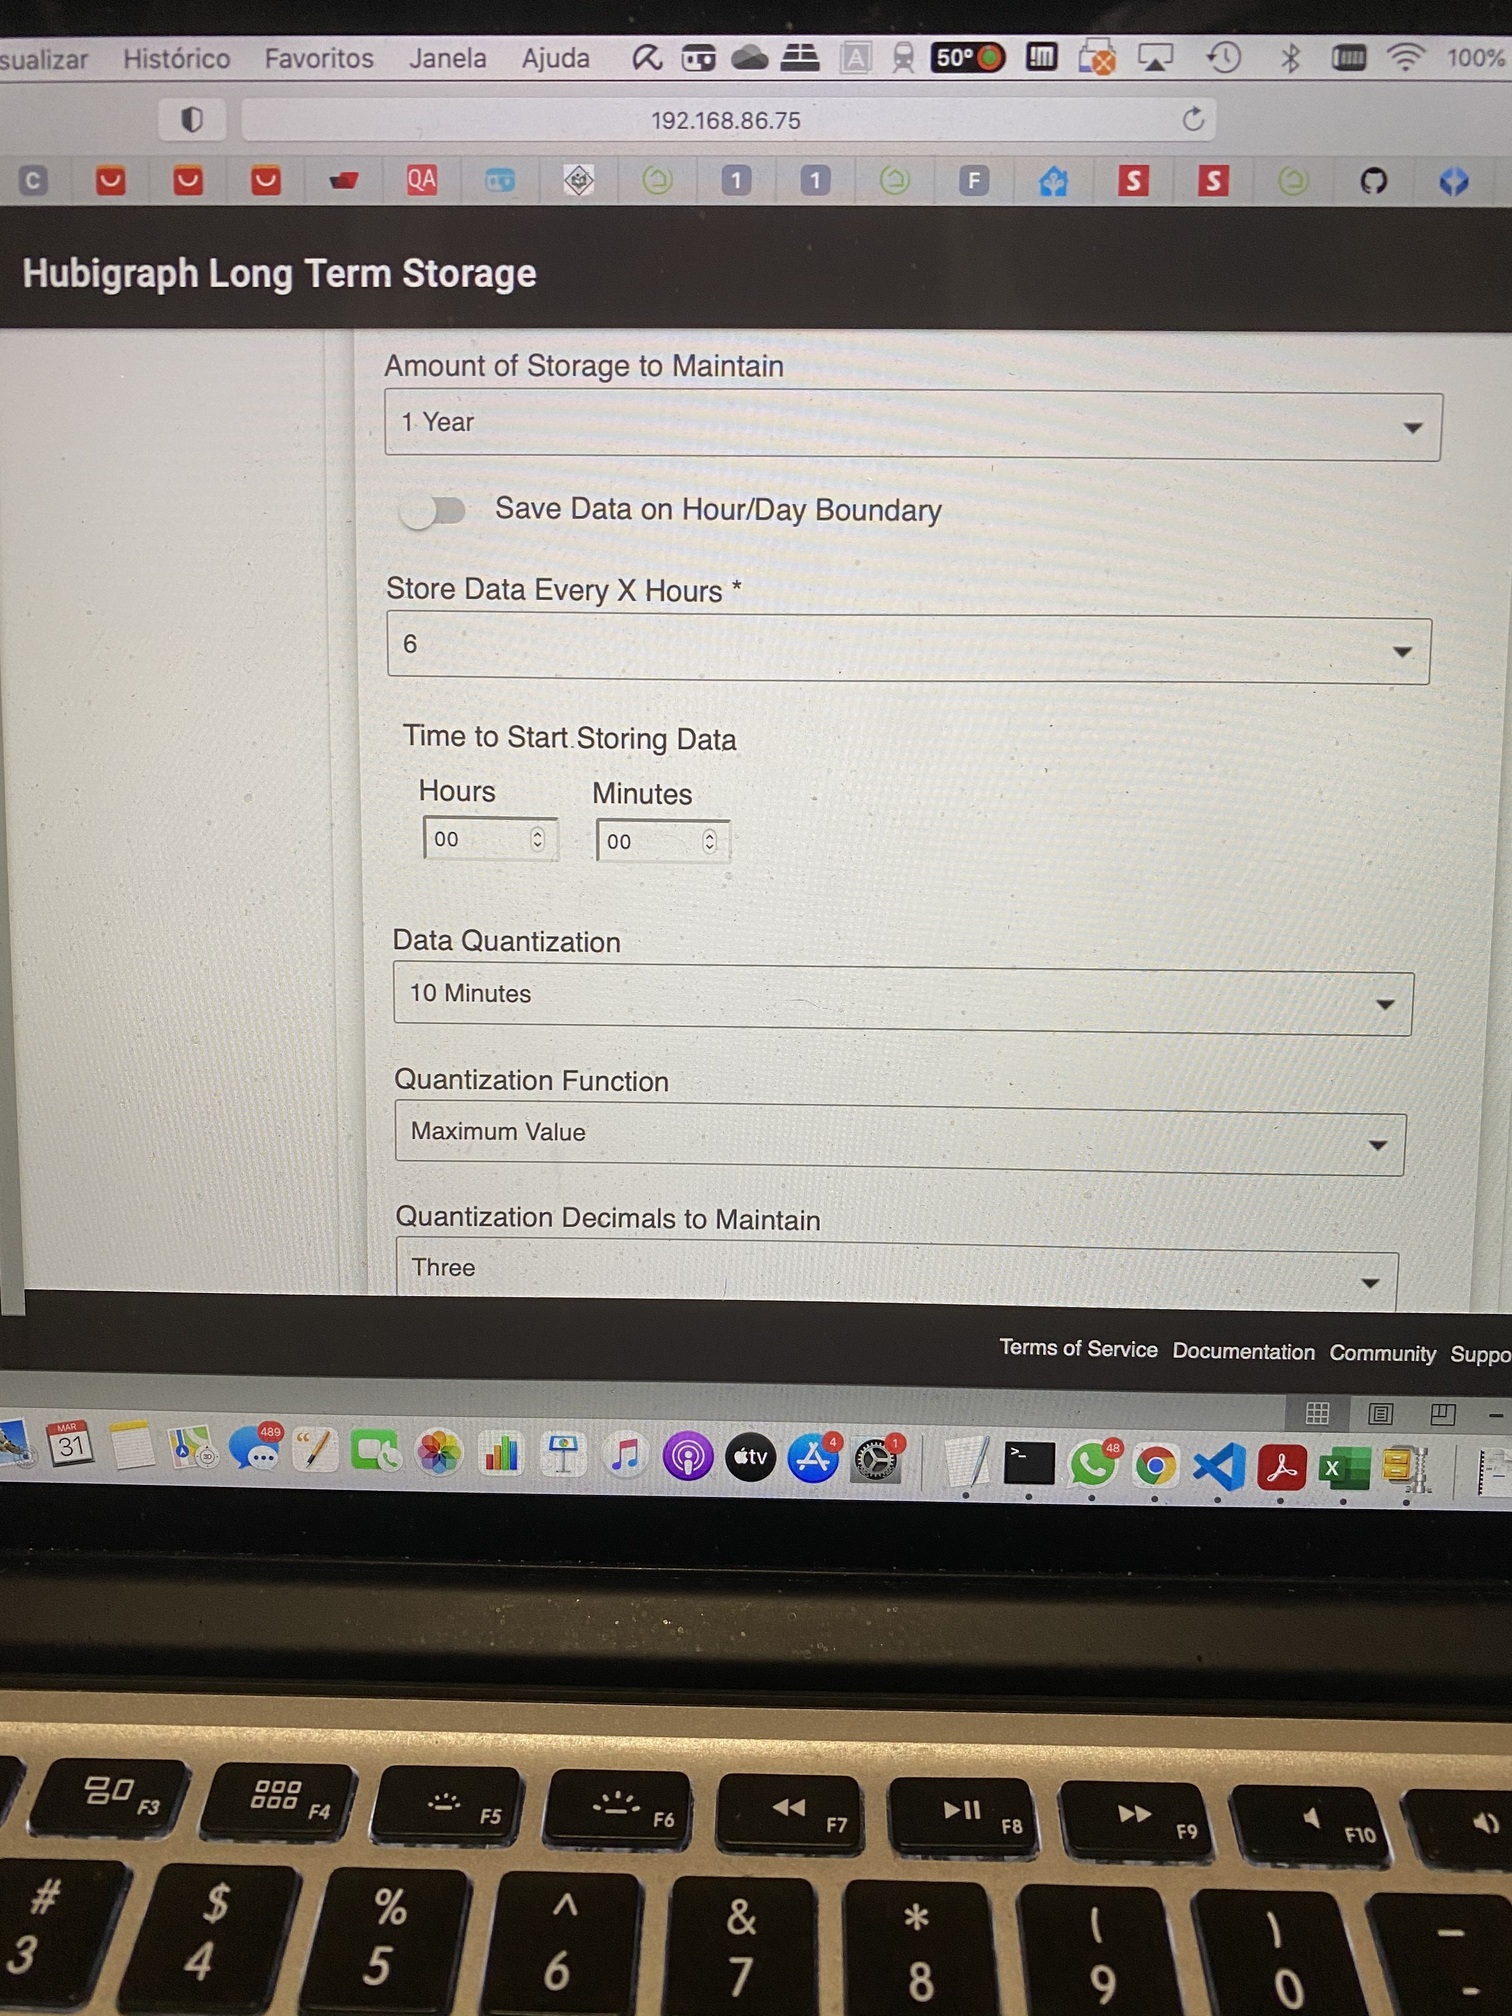
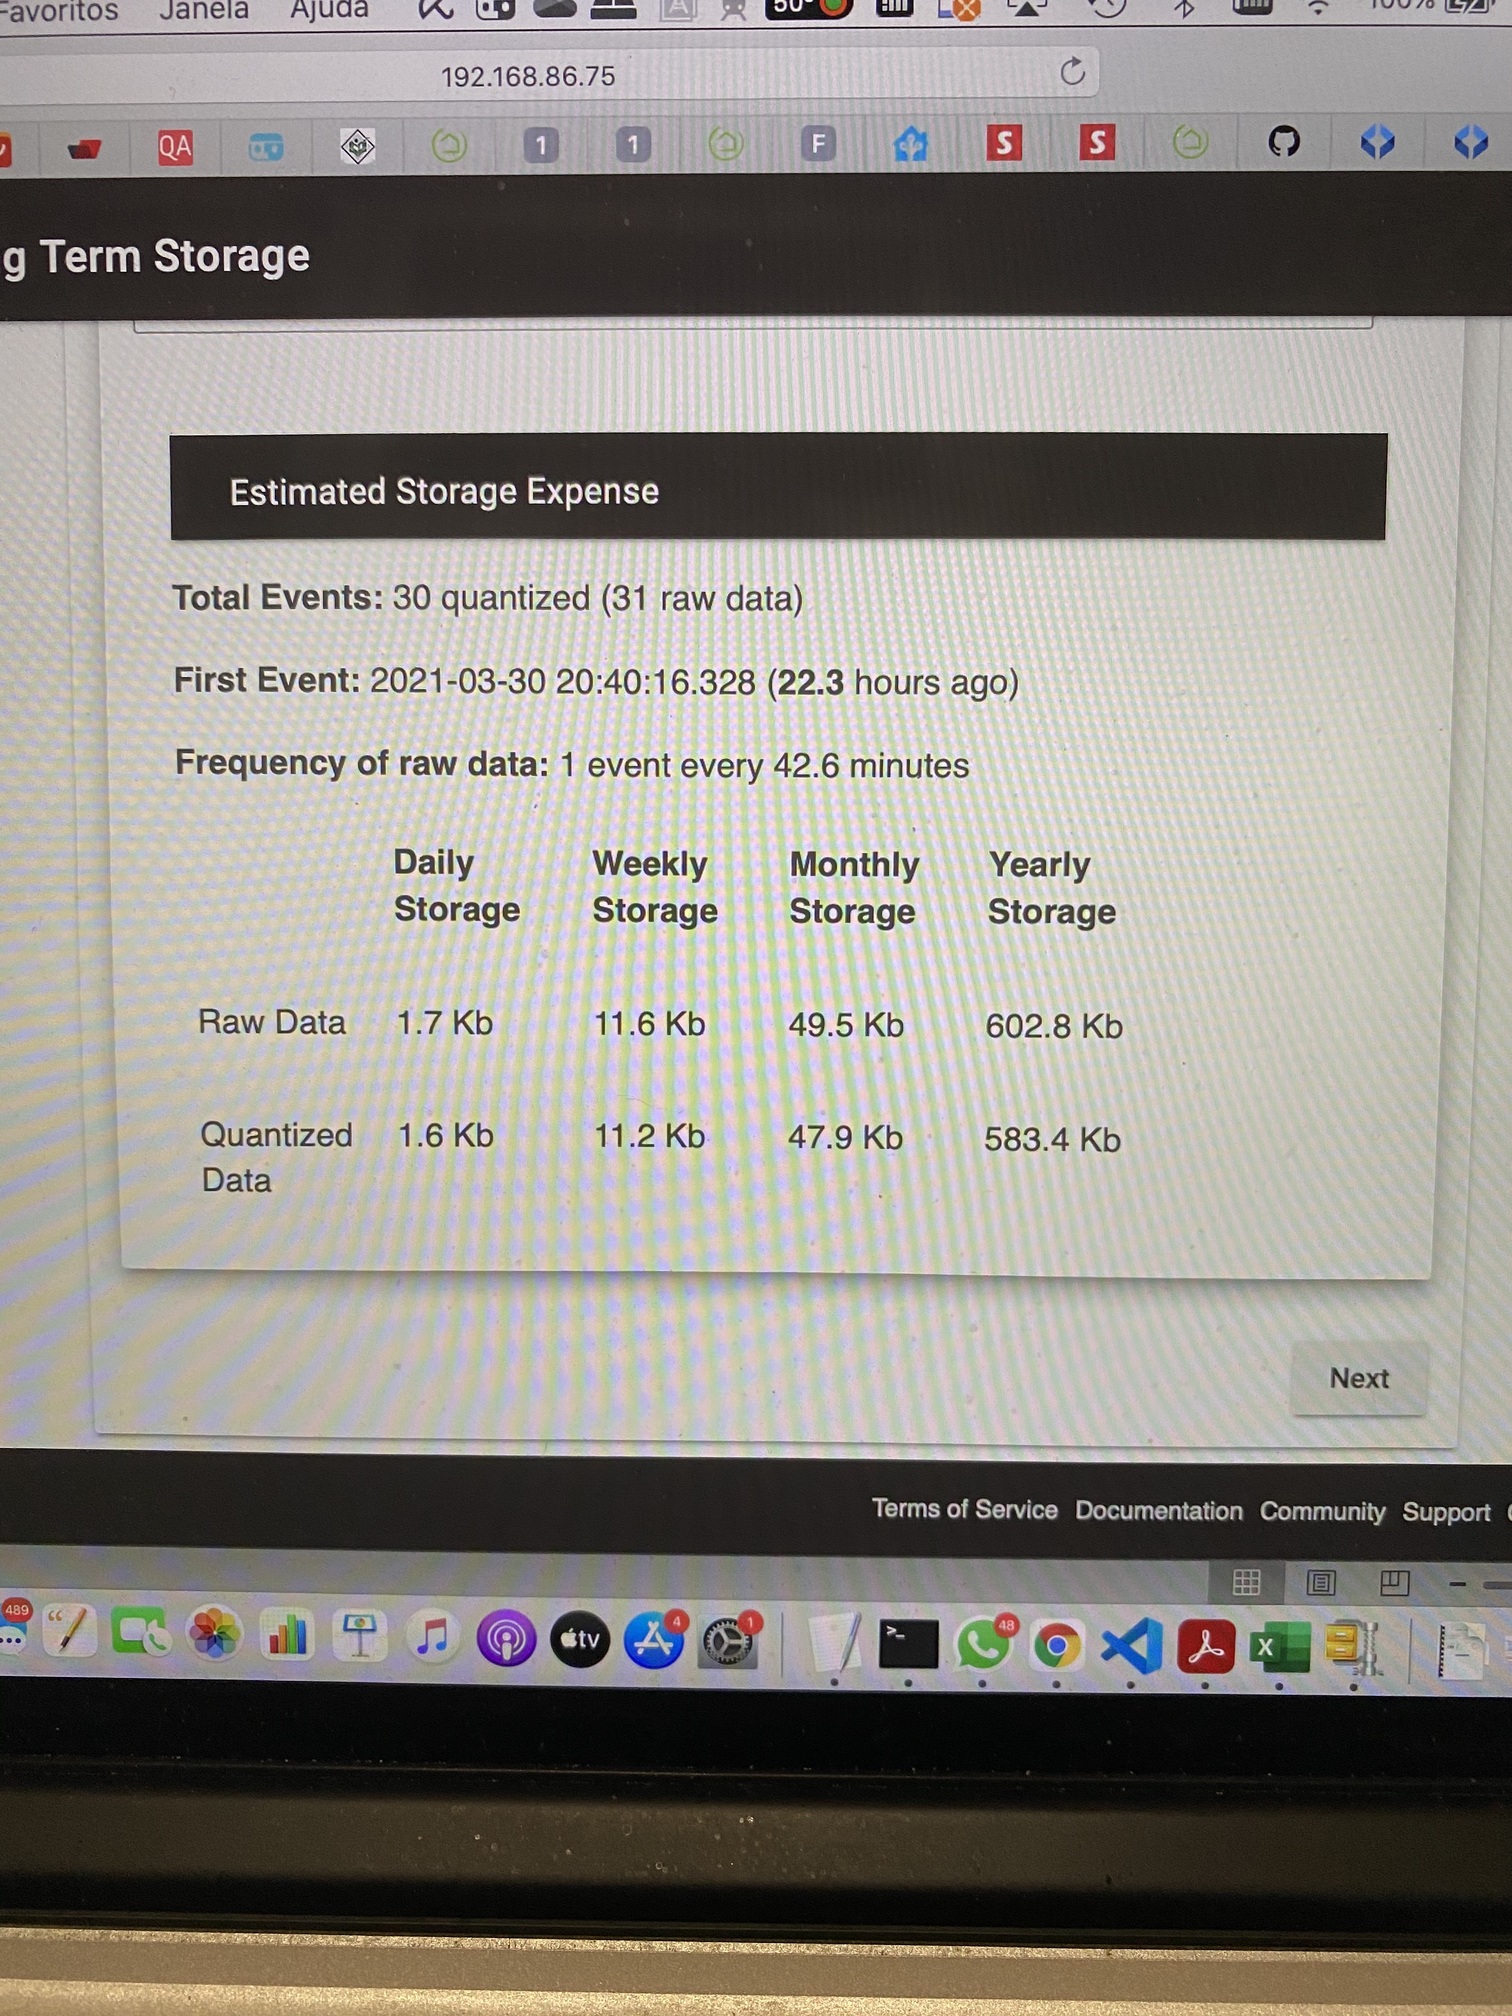
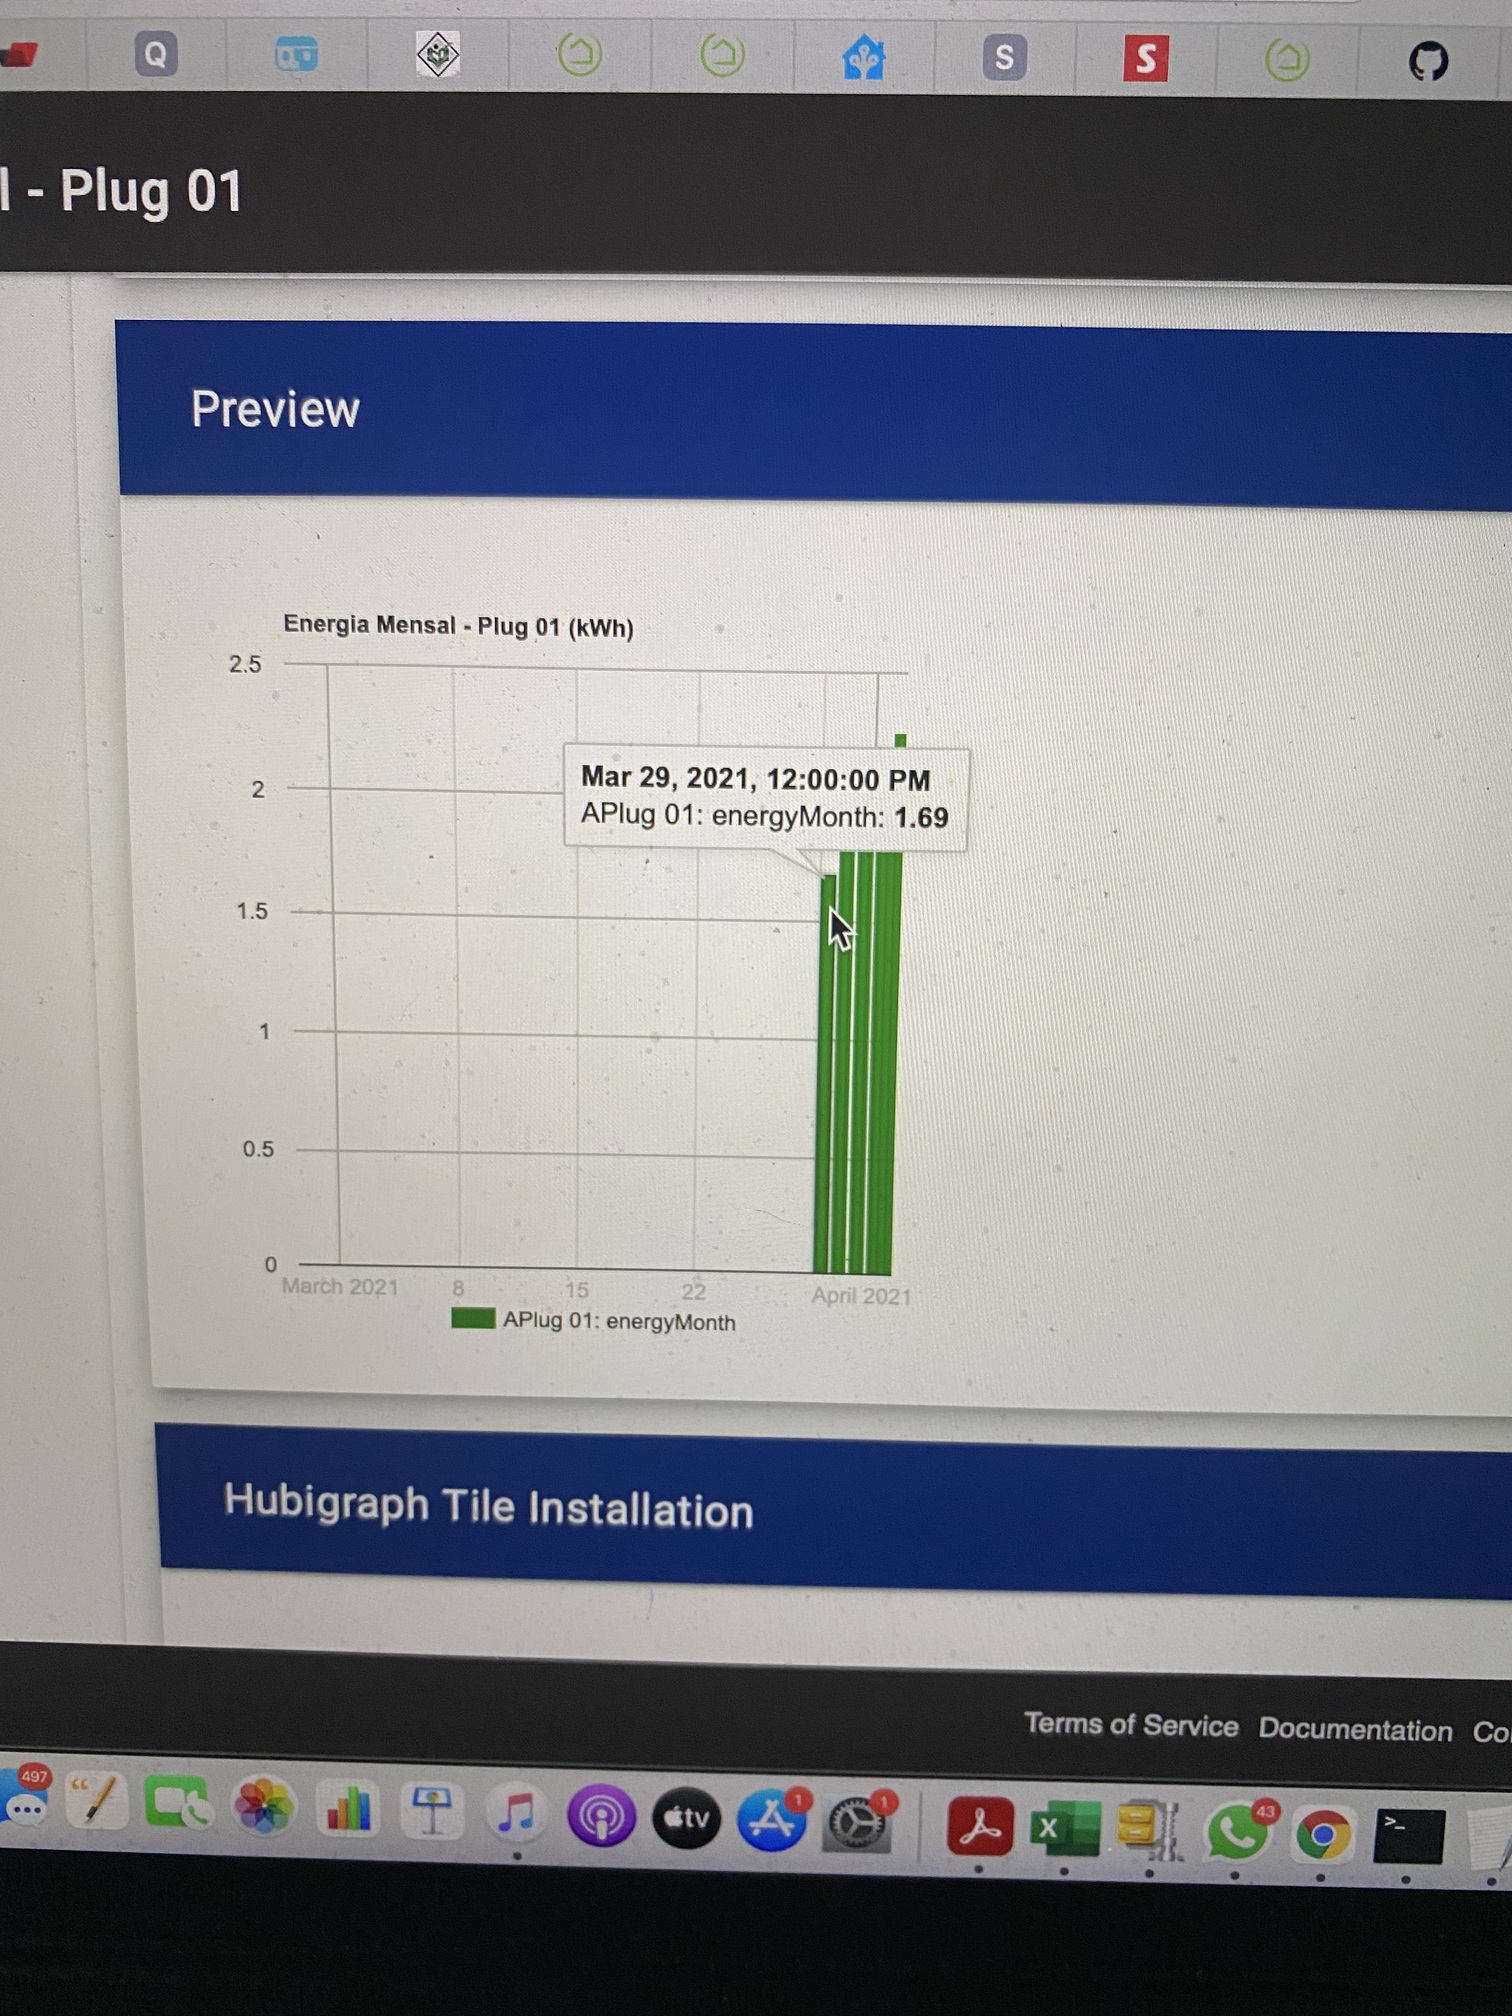
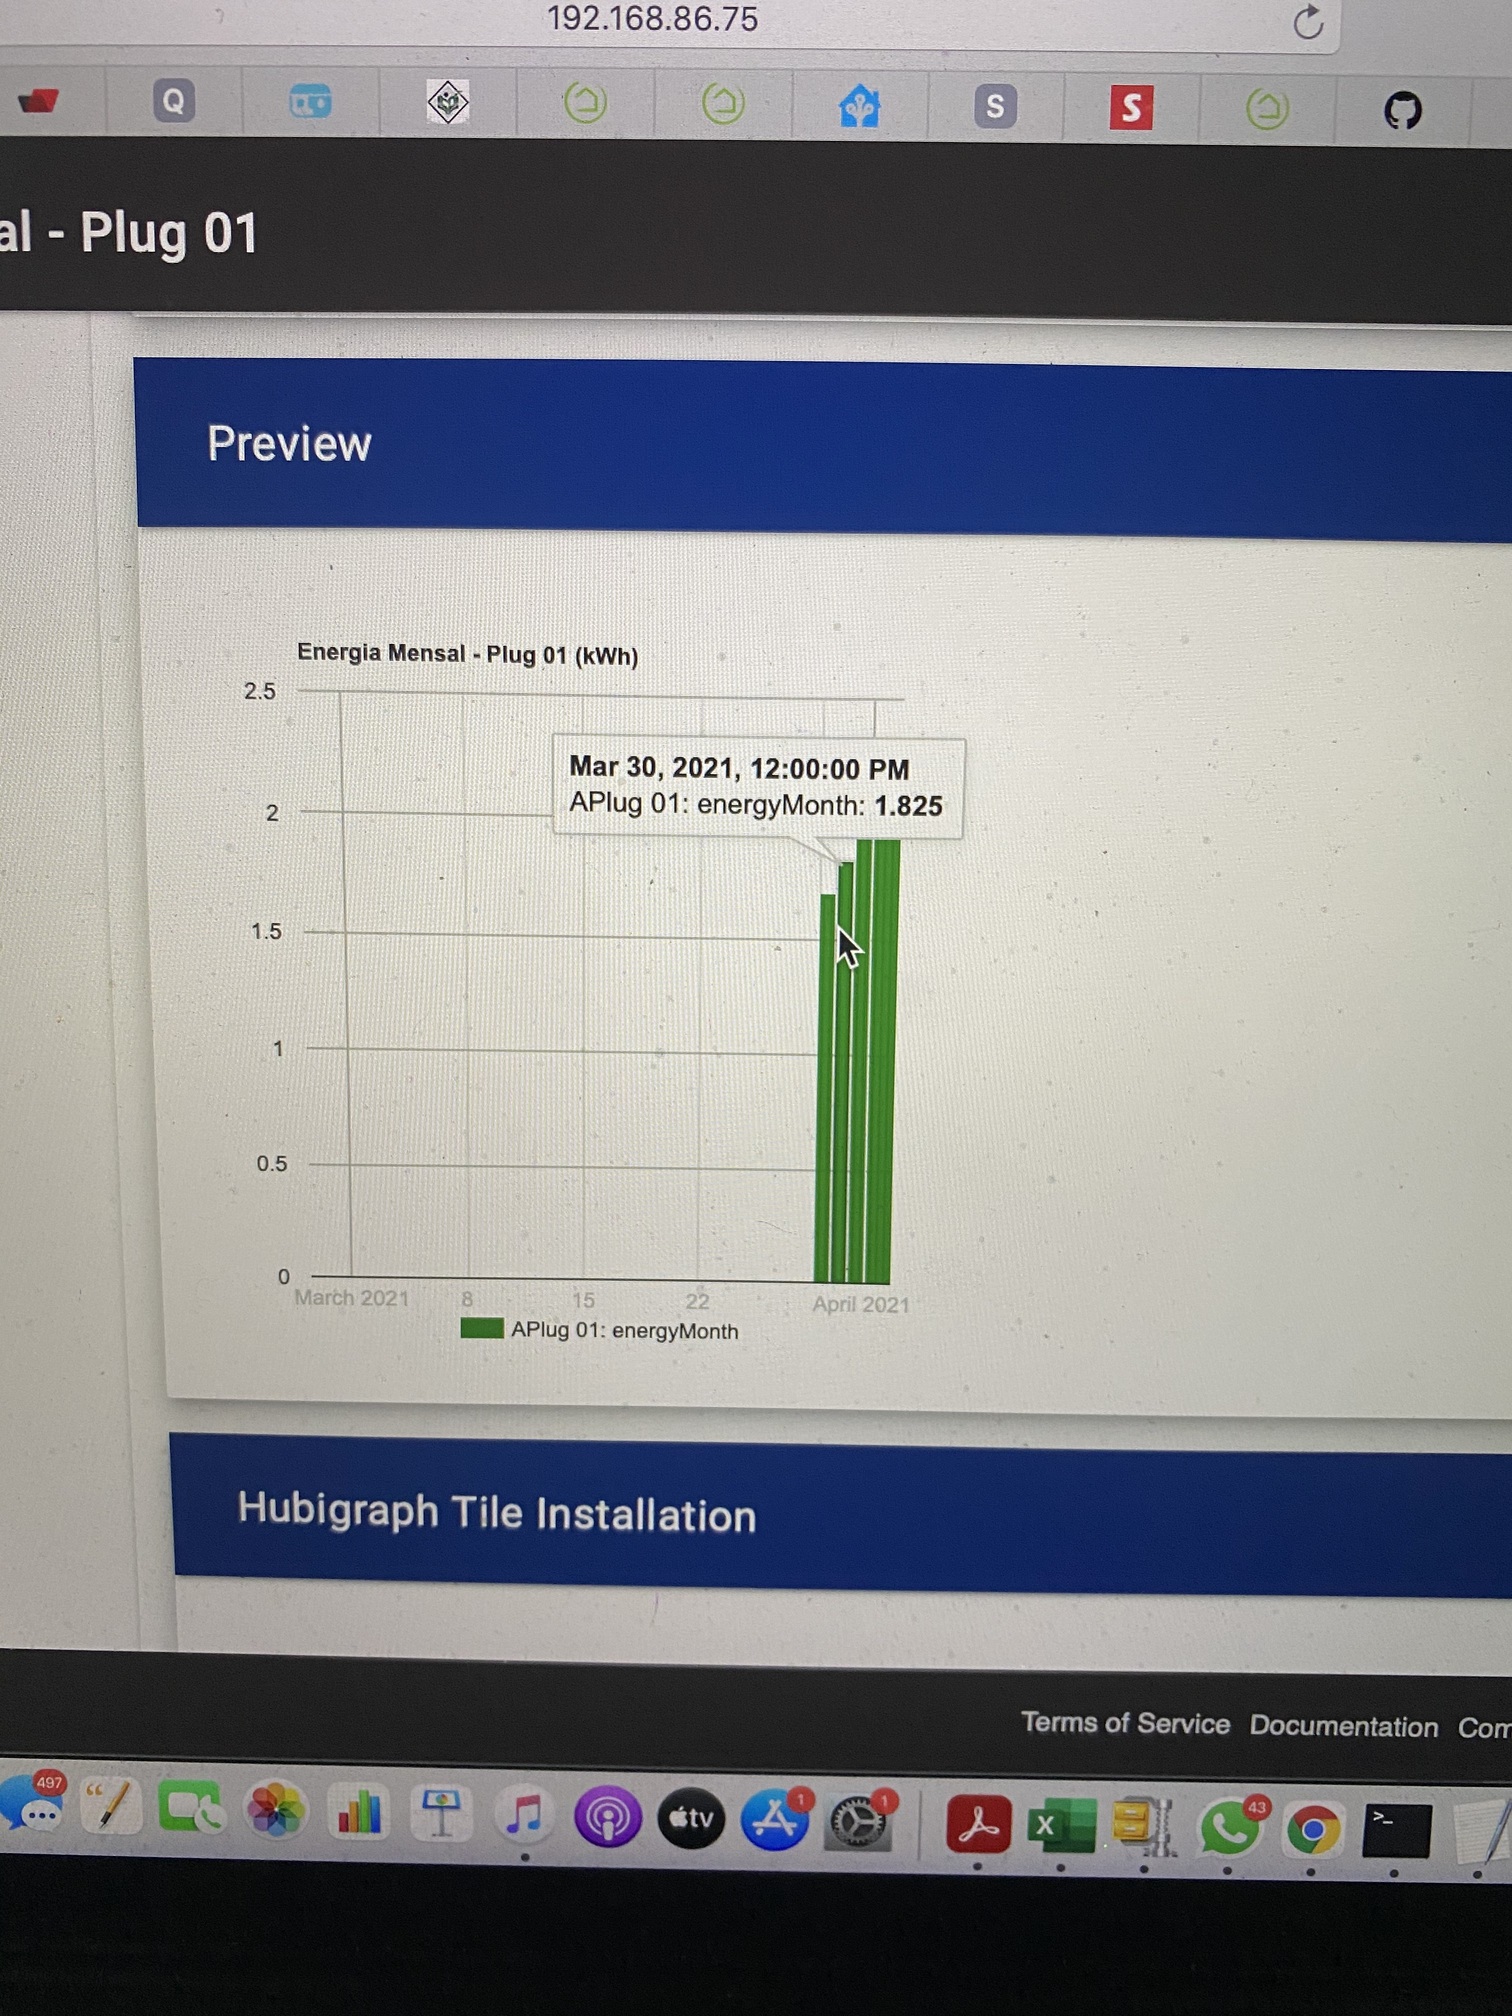
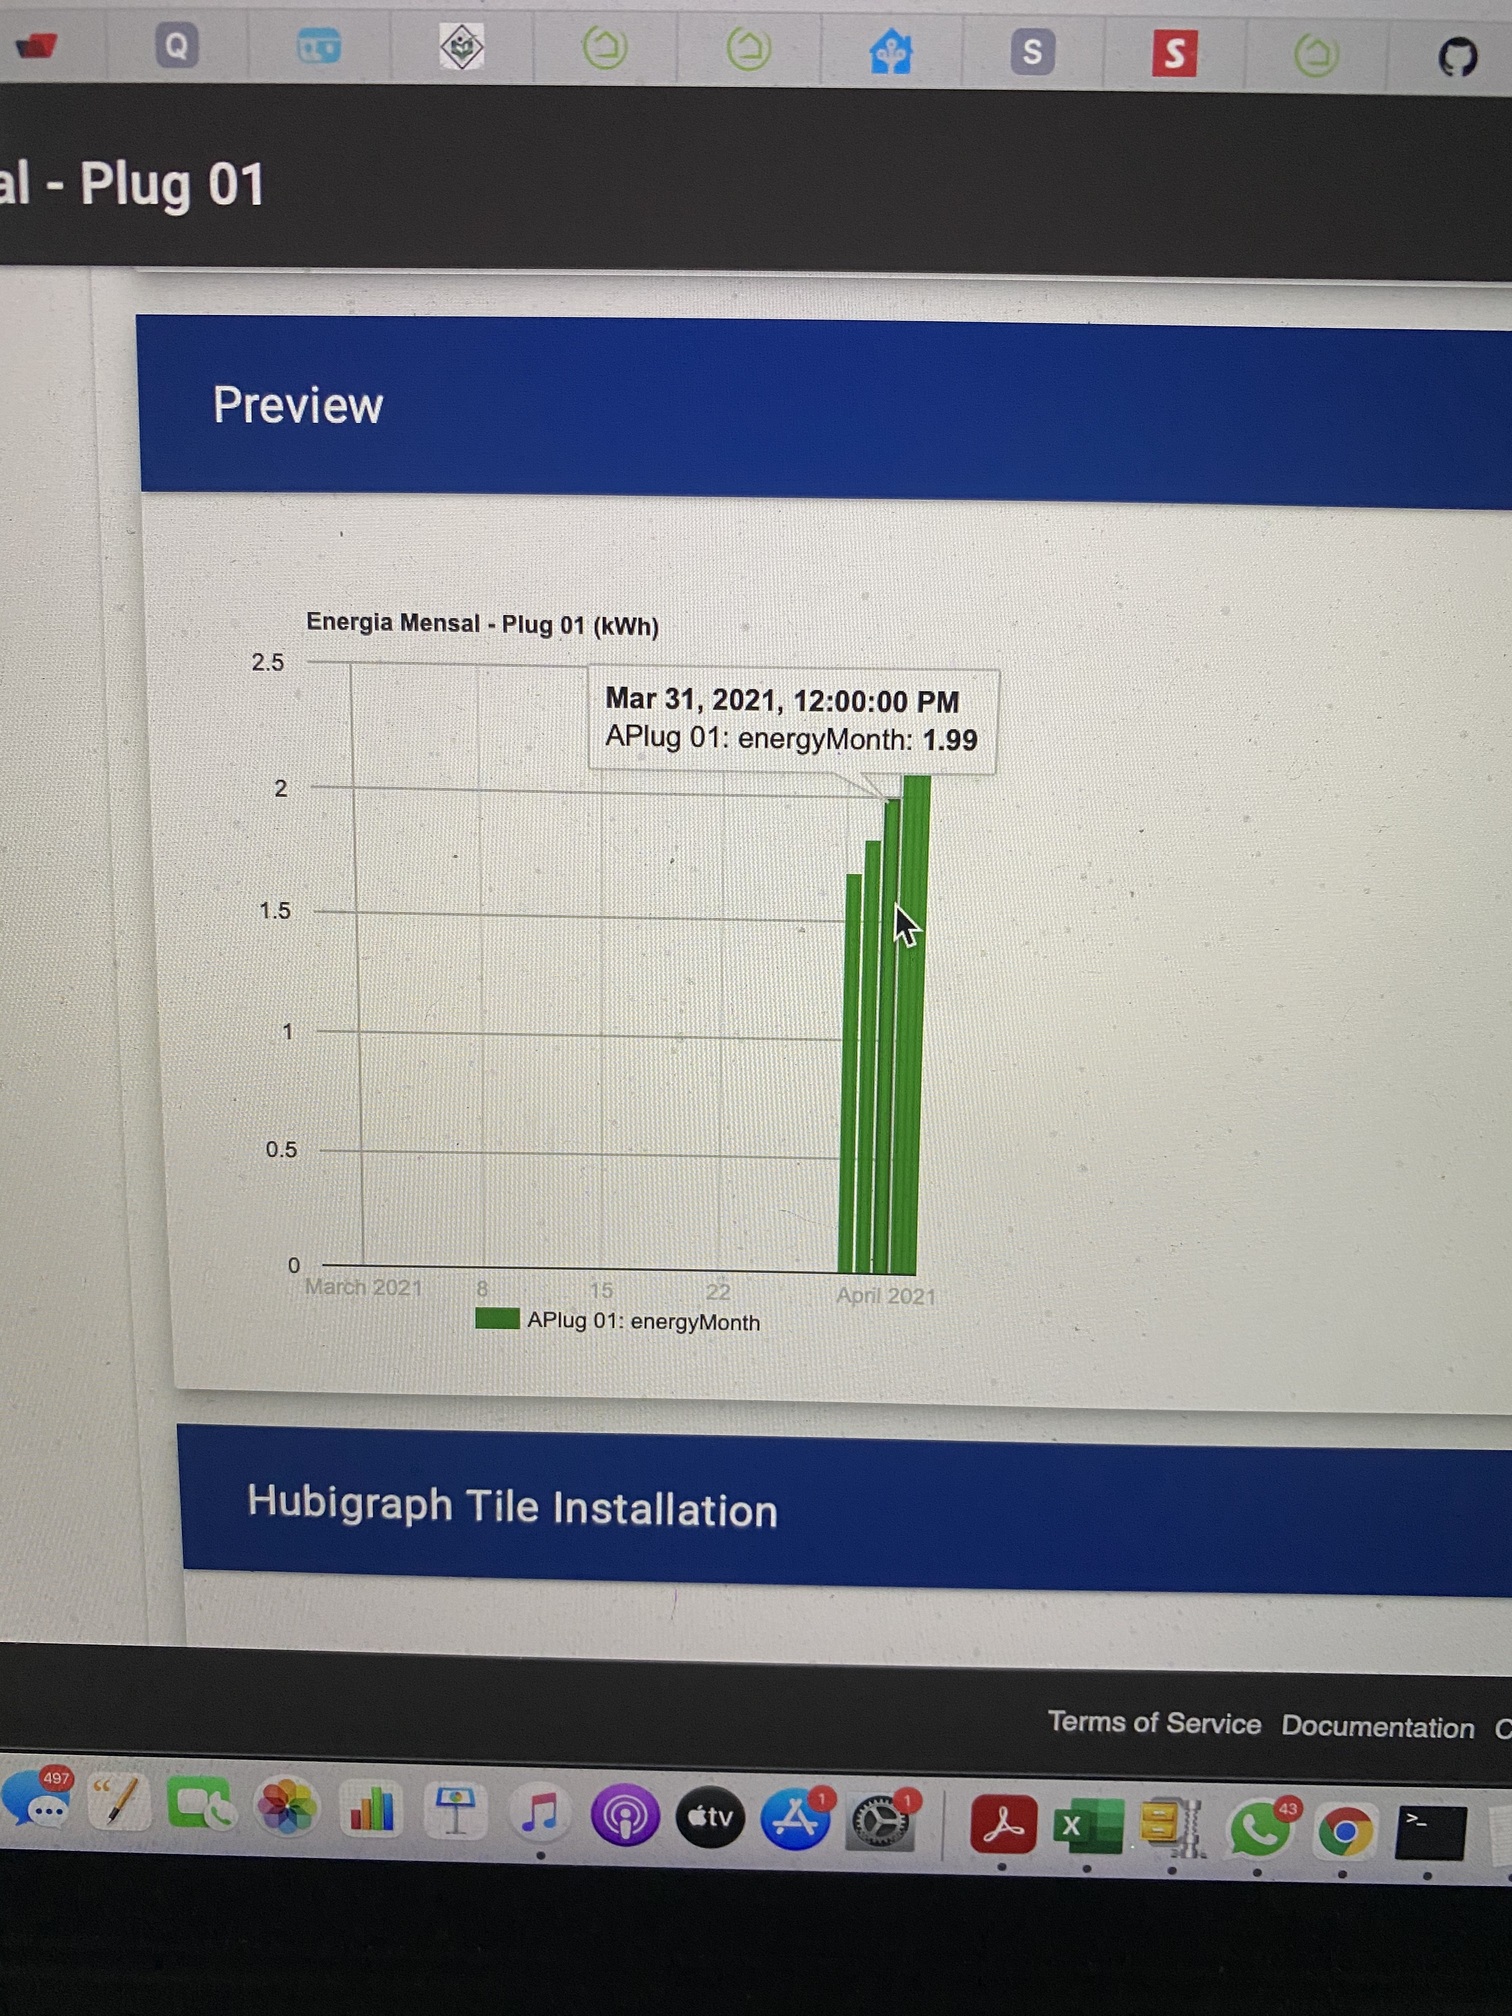
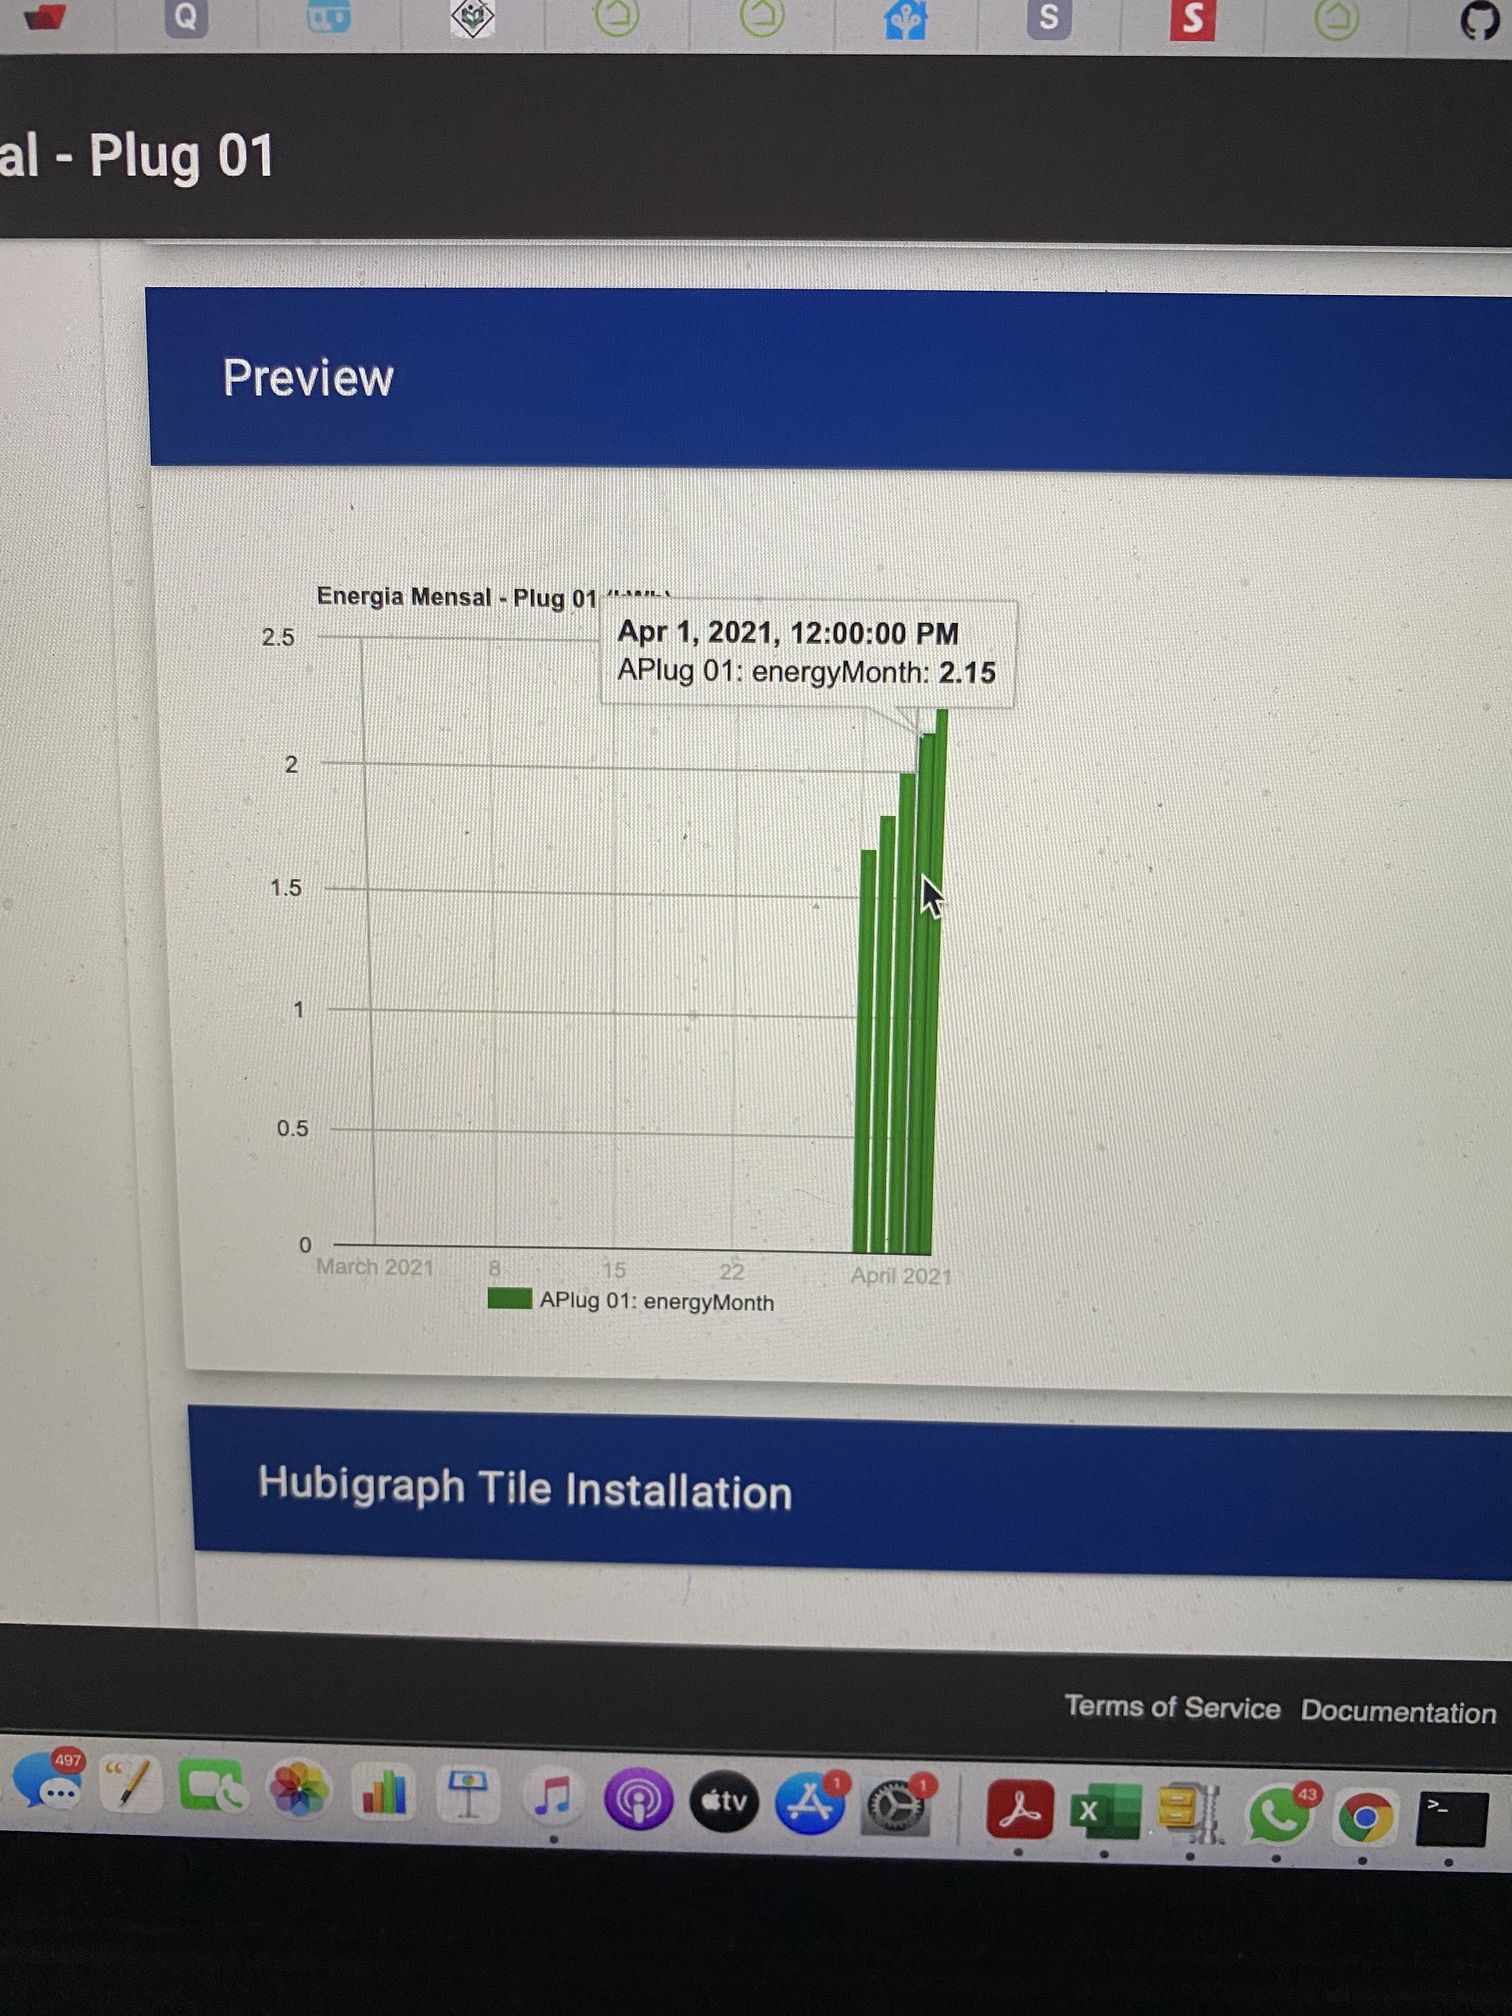
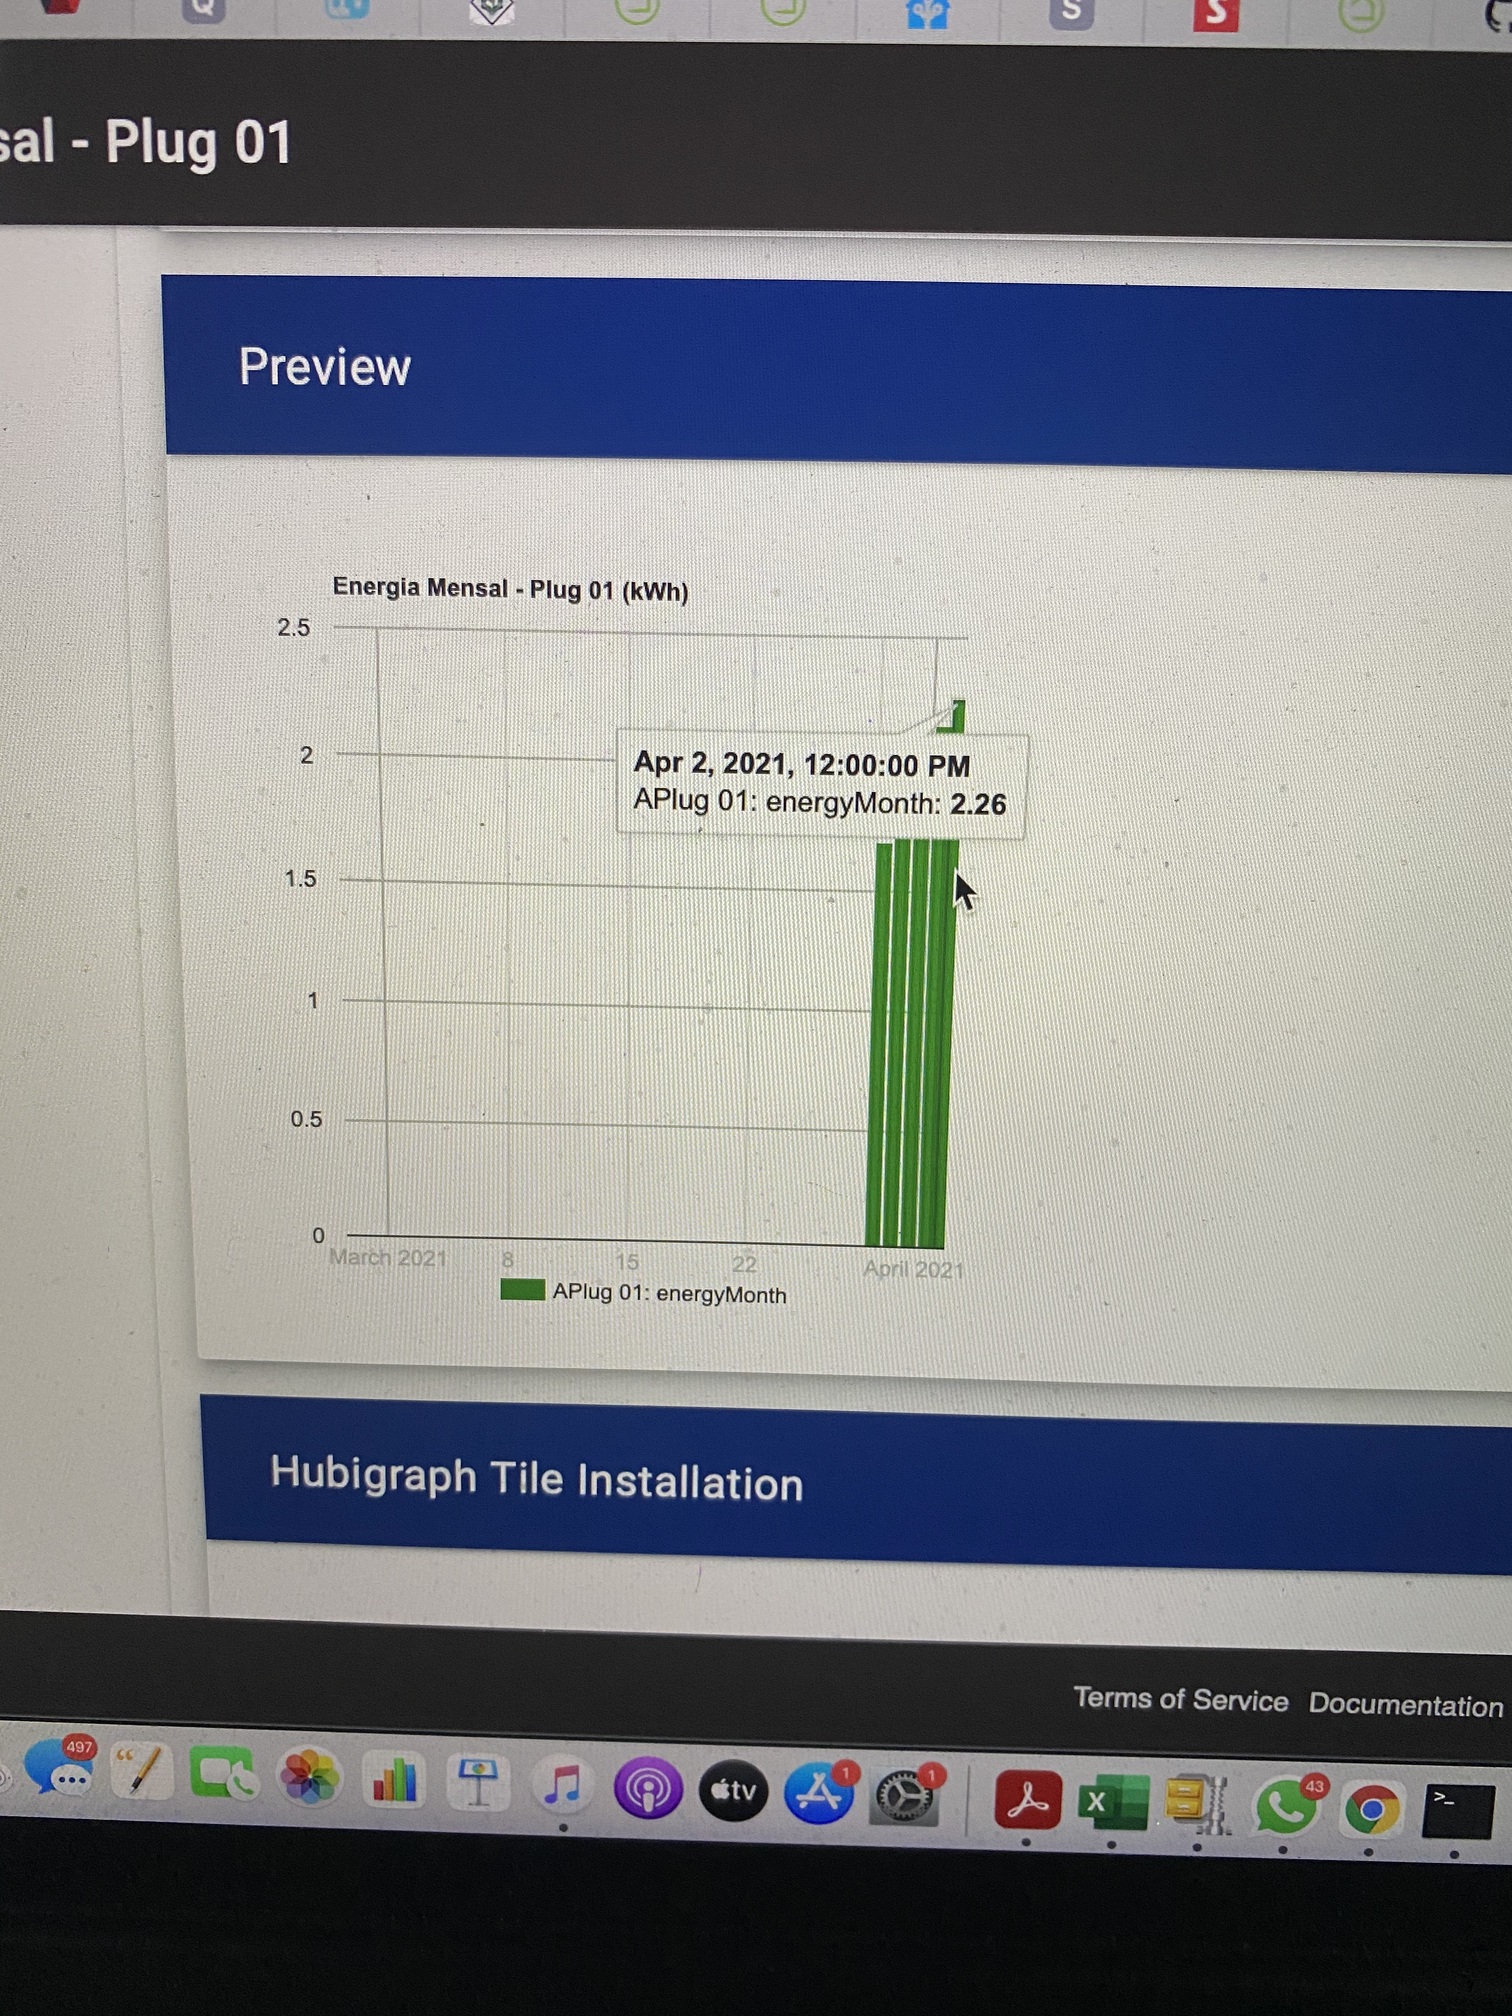
Hi @thomas.c.howard, I'm trying to make an energy consumption monthly graph with data from a plug. I have the below data being generated, some of them are calculated in the driver.
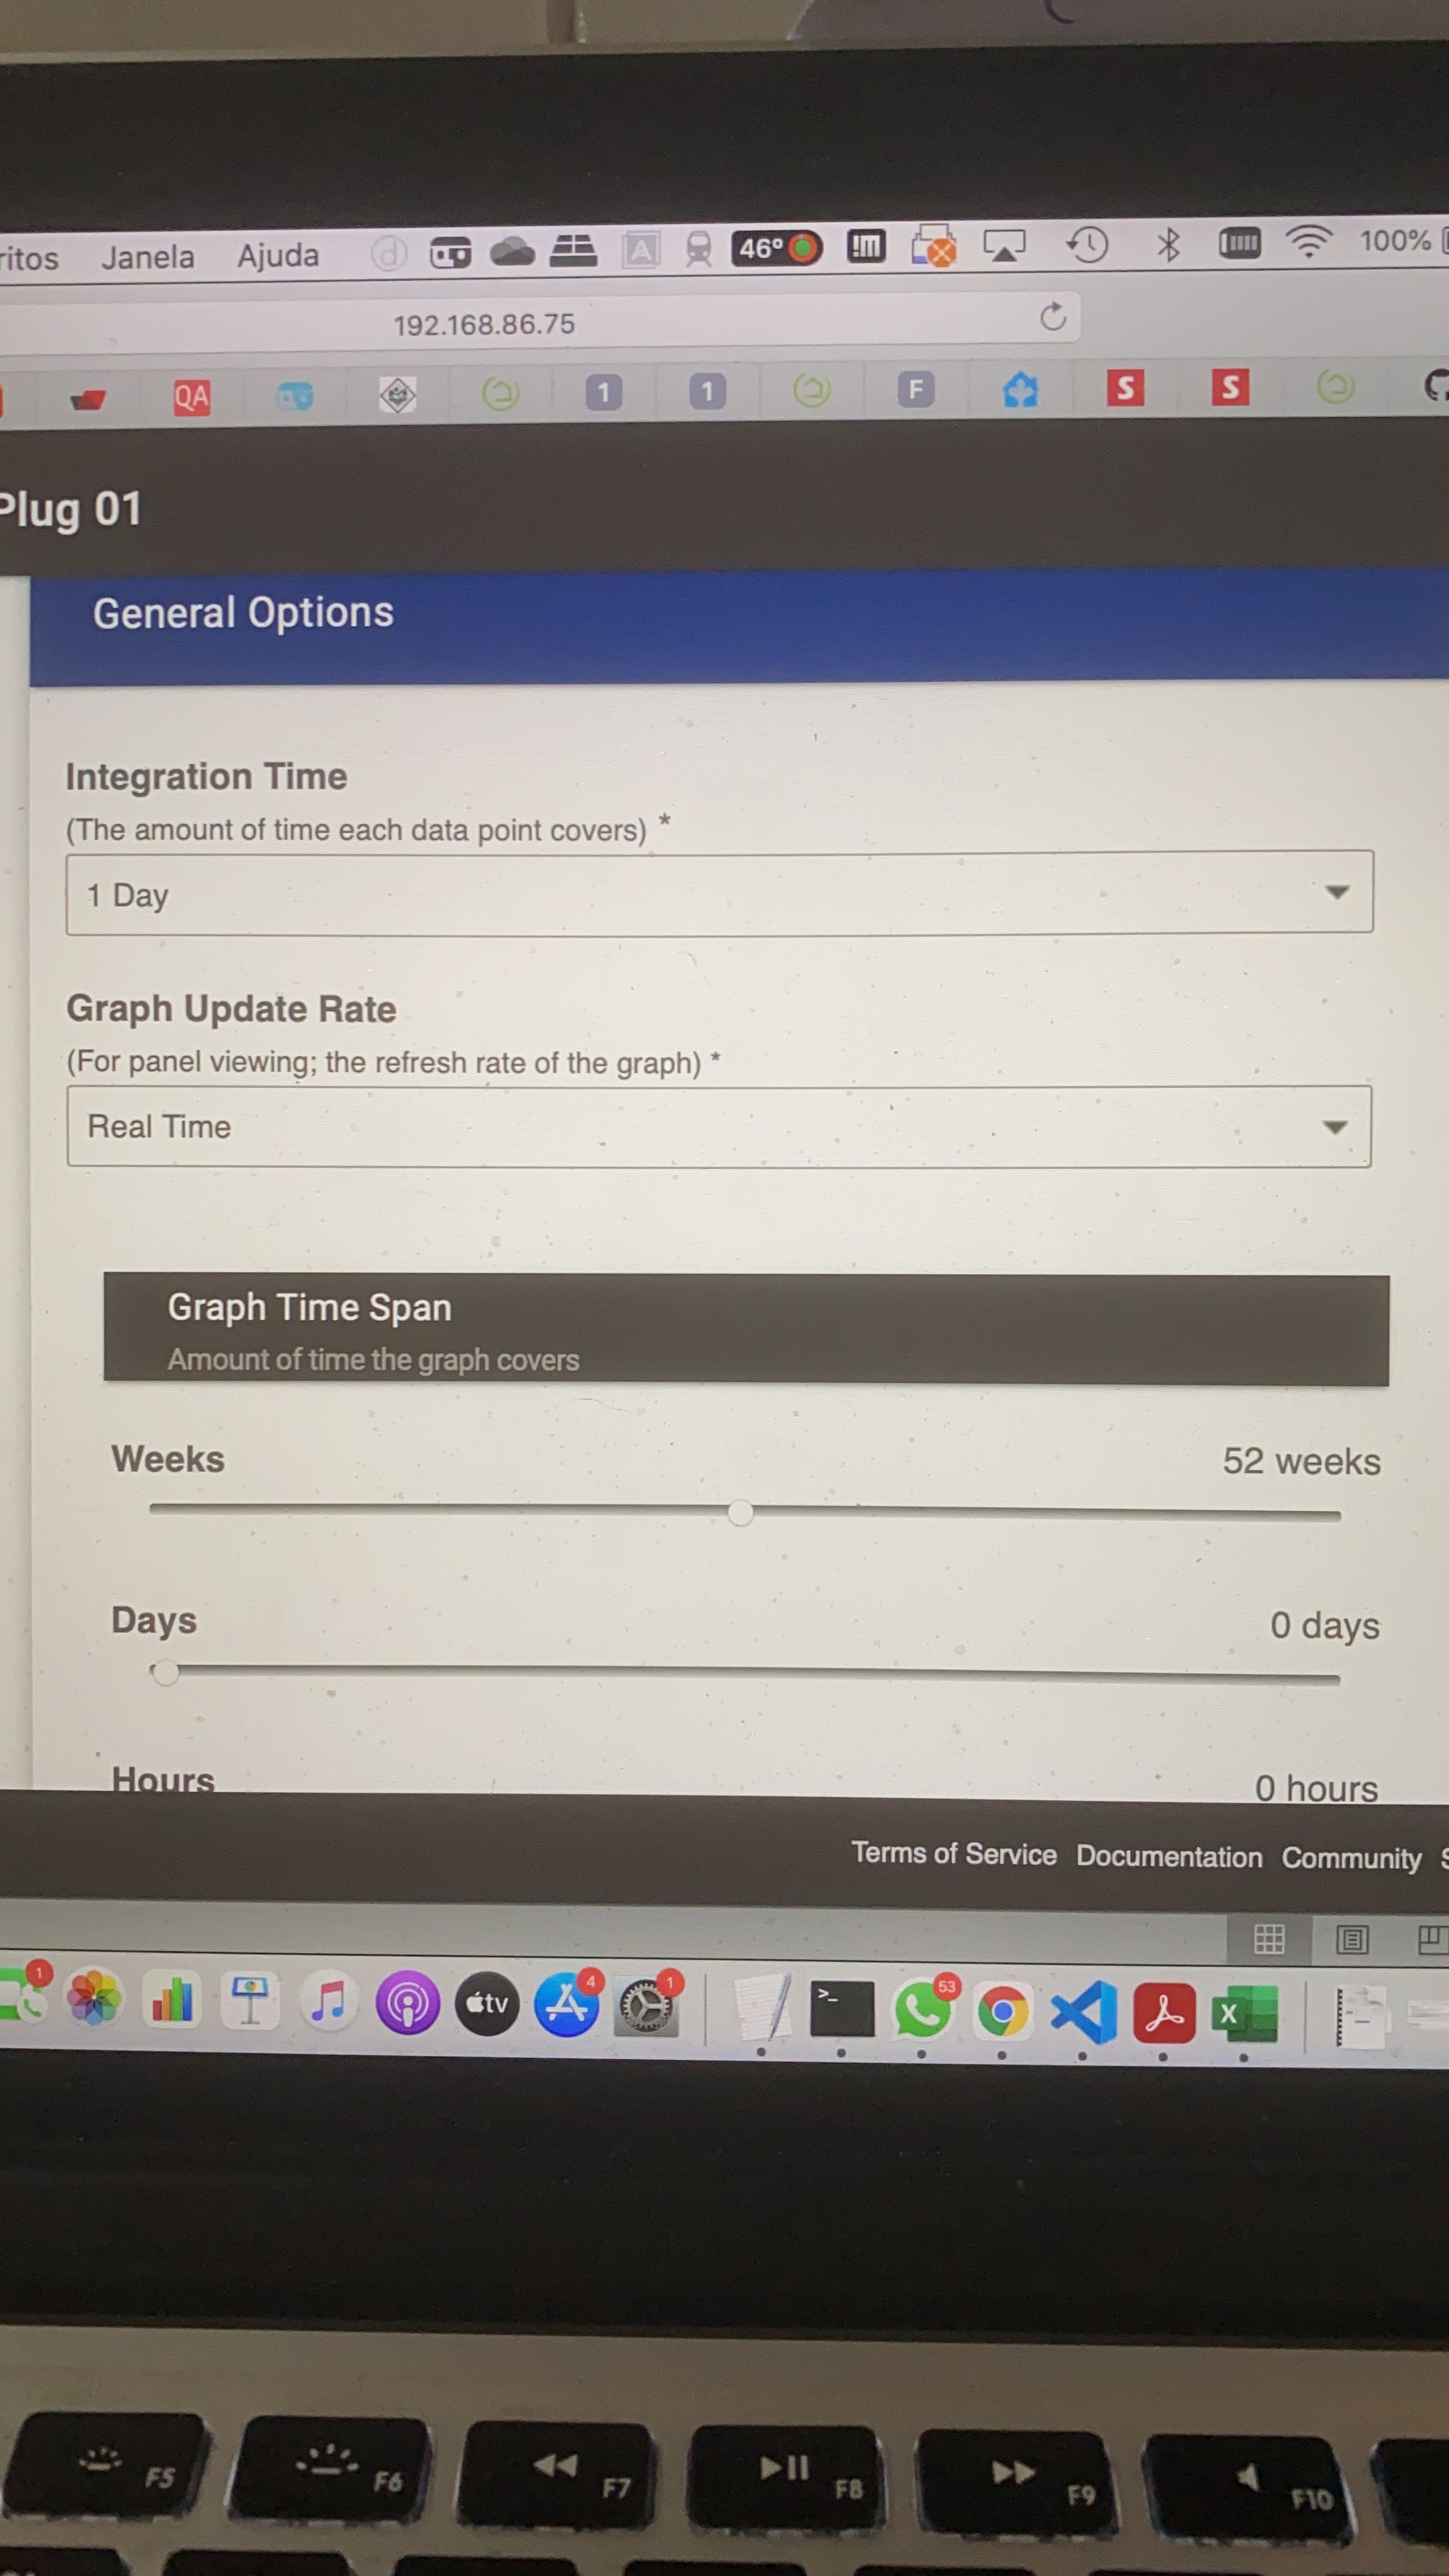
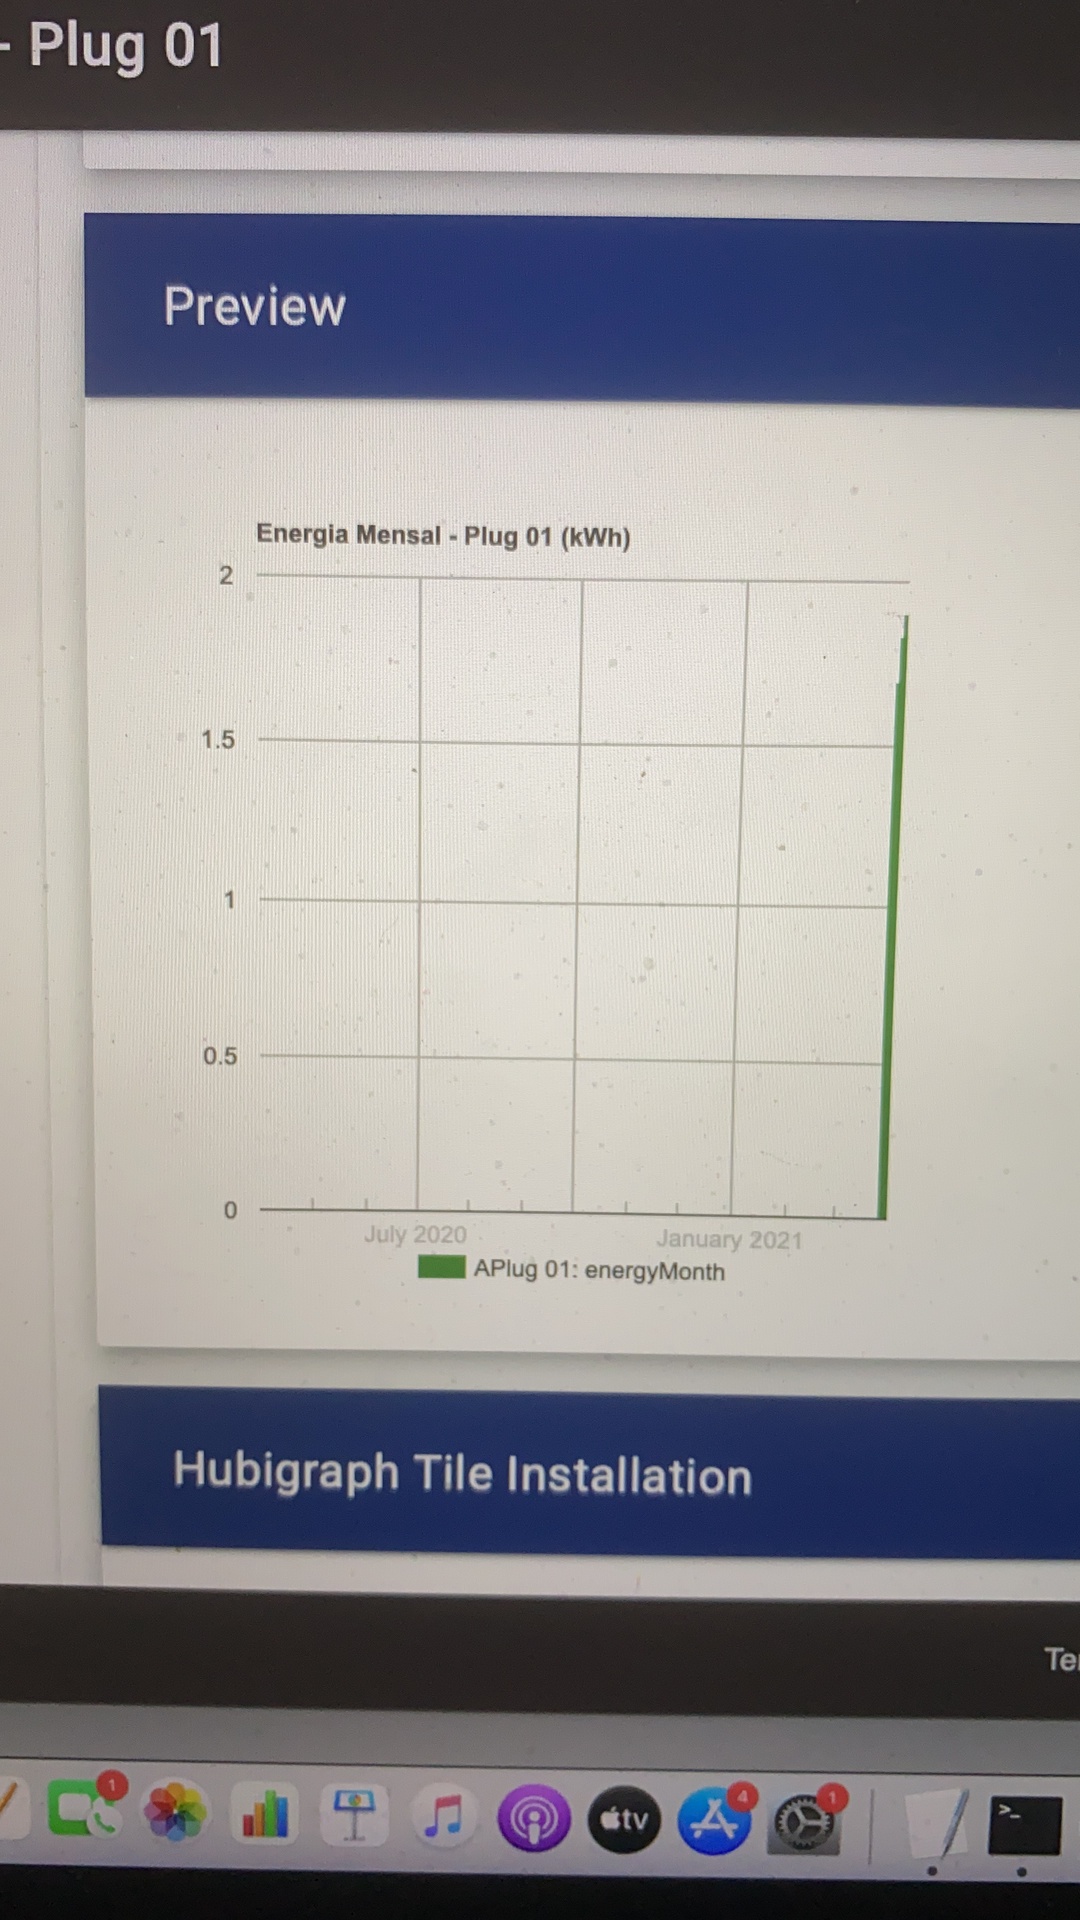
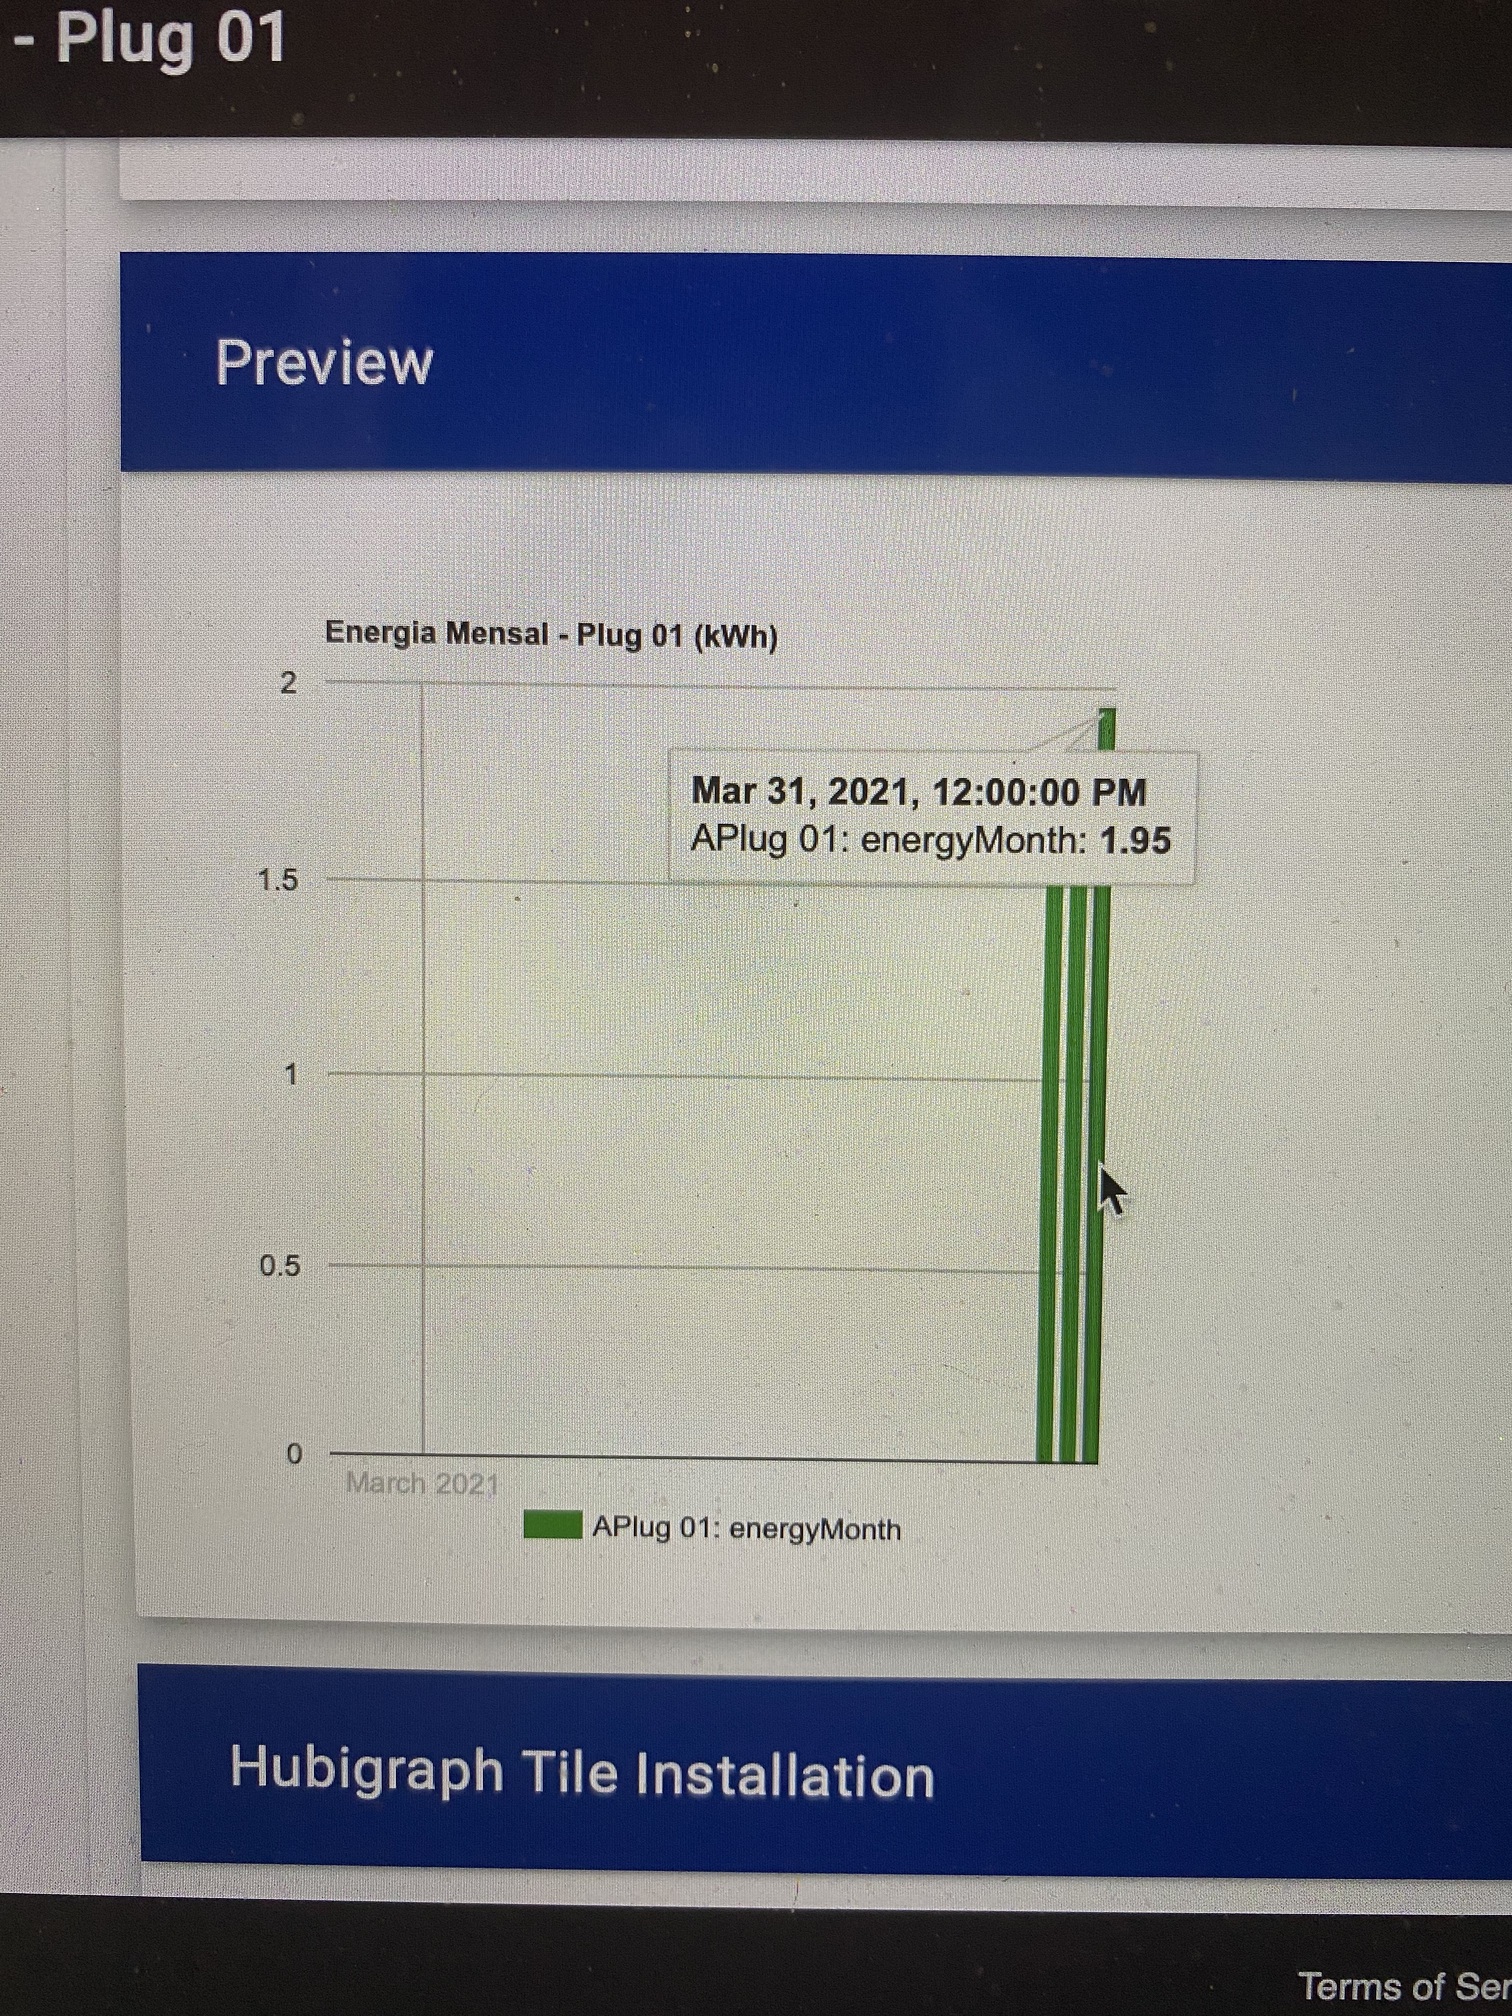
As you can see it's showing like a diary graph. I want each data point to cover 1 month (max value) and the graphic will show 1 year (12 points). I think the problem is with the "Integration Time" in "General Options", there isn't an option for 1 month.
Thanks Howard, yes that was set to 30. I've never modified the State History events and must admit I'm not quite familiar with that parameter. I'll bump that up. Am I to assume that specifies how many events are logged in the history over some period of time? That sort of makes sense because what I see on the zooz switch is that every power up generates 3 events, so even with an event, say, once an hour it would exceed 30 fairly easily.
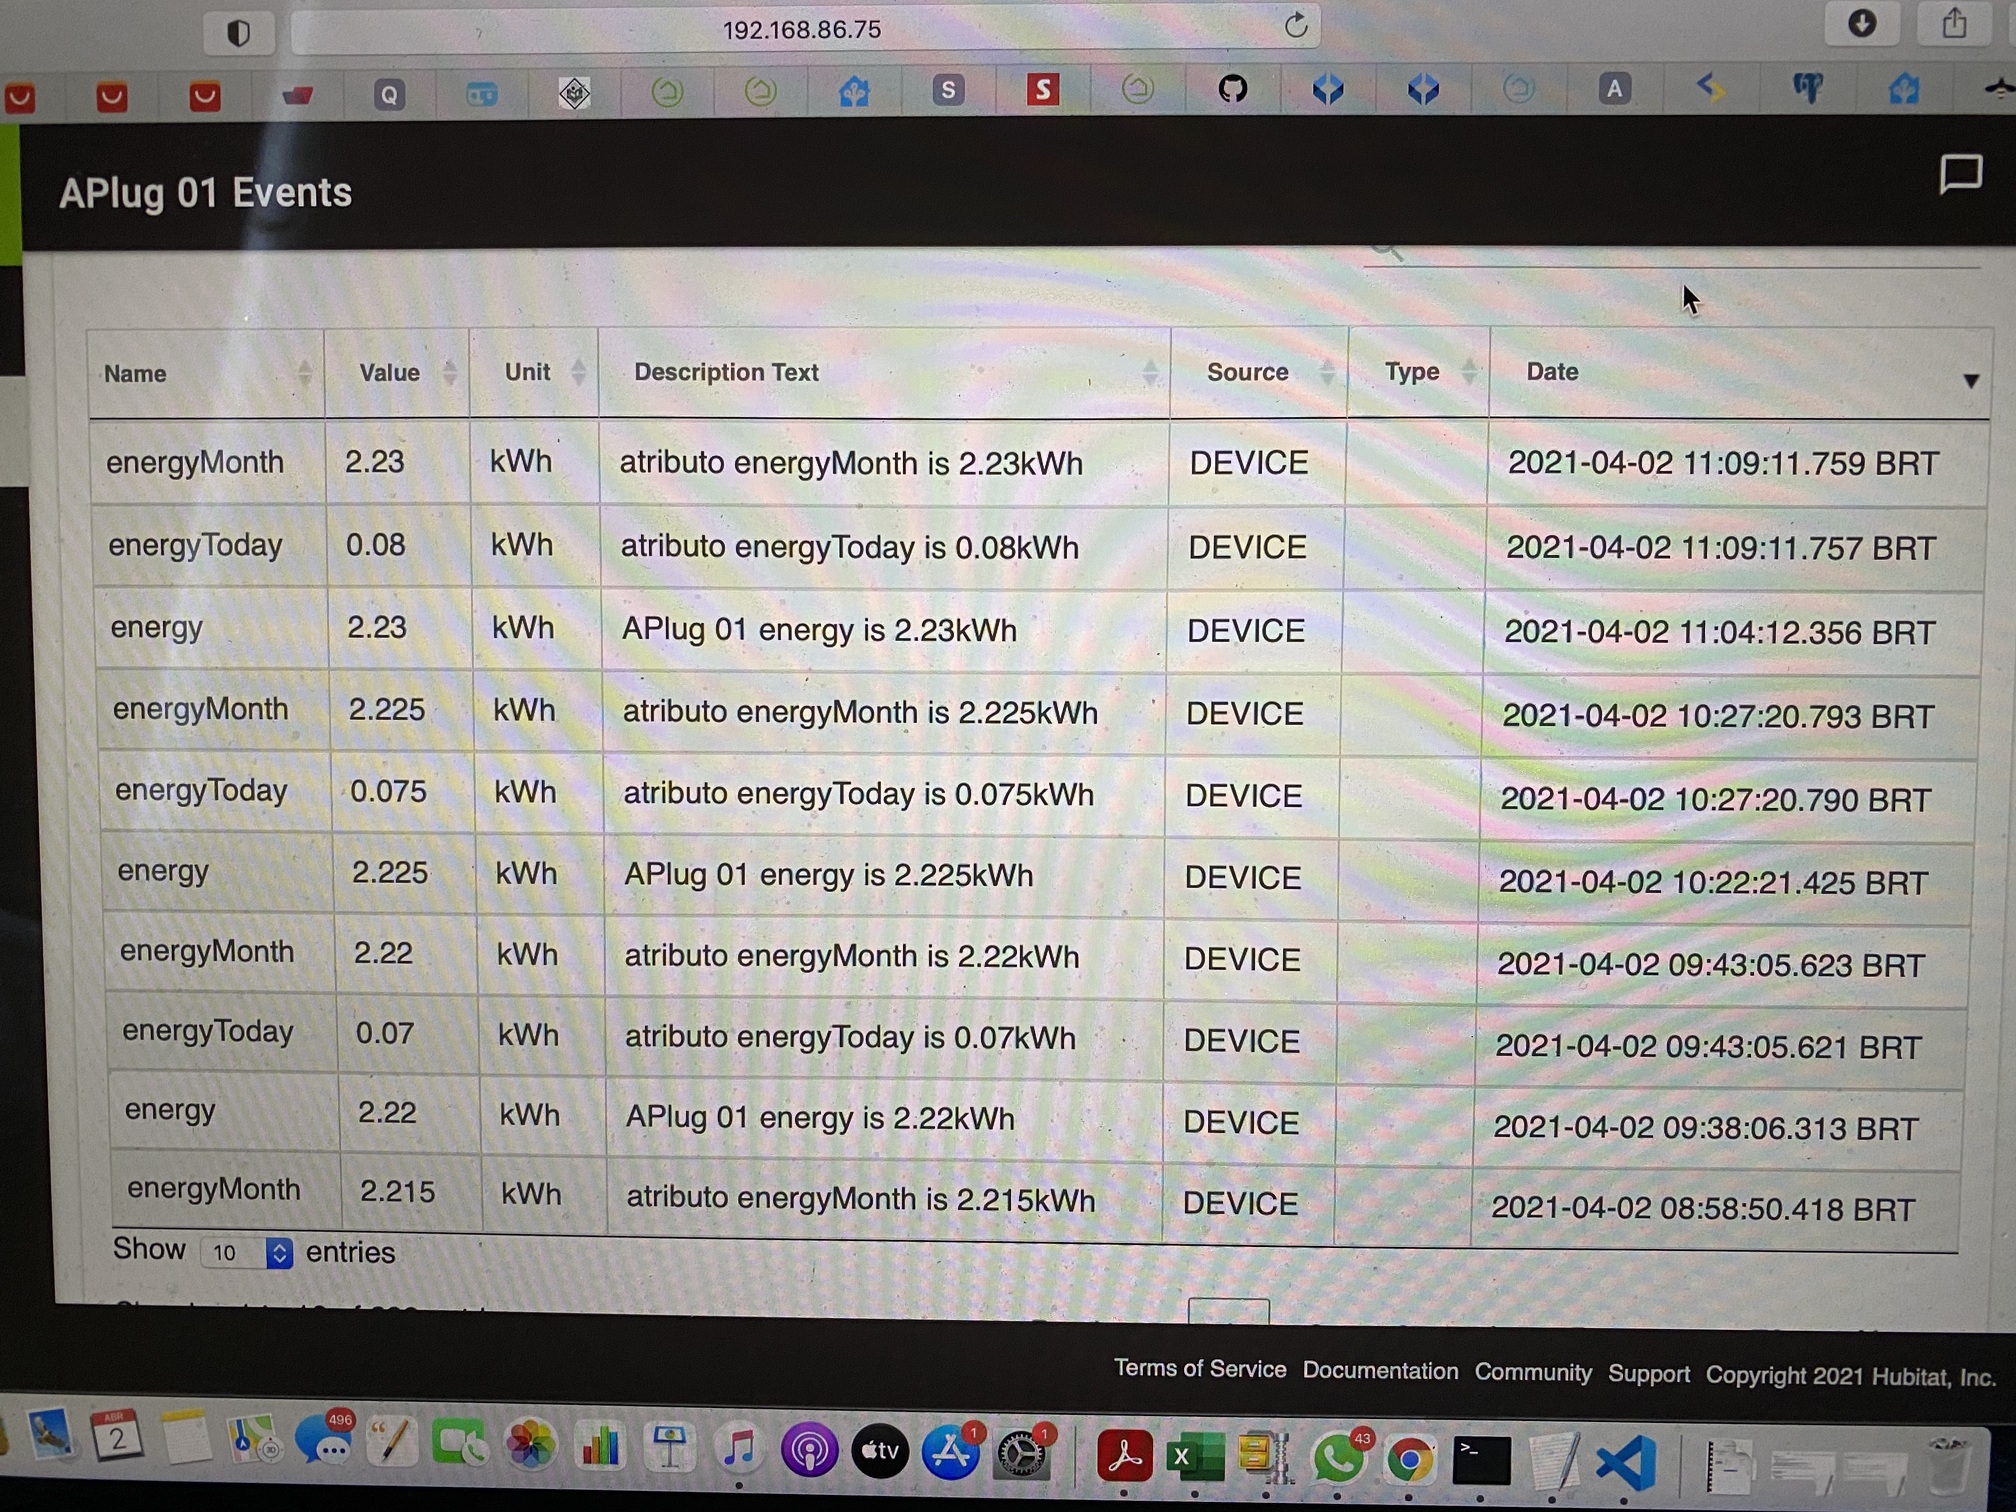
There are 5 columns, 3 from march (29, 30 and 31) and 2 from april (01 and 02). The desired situation is only 2 columns, 1 from march (energyMonth = 1.99 - max value) and 1 from april (energyMonth = 2.26 - max value).
I think I FINALLY understand this issue (@terminal3 has brought it up before). I need to add an option to graph data points on day/week/month boundaries. I.e. if integrating data for one day, start integration @ midnight until the next midnight. Right now the graph integrates data based on the time the graph was generated. With LTS implemented (and in beta) this change makes more sense.
I am finishing up a wife-project (getting her KIA EV into Hubitat). Once I take care of that, I will take a look.
I took a look at the issues. It looks like it is time; I will be rewriting HubiGraphs over the next few weeks. The "small" issues are just getting to be too much to maintain... This is everyone's opportunity to give feedback of what you'd like to see. Right now, here is my todo list:
Ok, I completed my migration from my C5 to my C7 using the new Protect Service migration capability. All worked well. However, one side effect was, of course, any apps which reference the IP address require changes since the new hub has a different address. I have figured out how to change all of those apps except for Hubigraphs. Do I really have to rebuild all my graphs or is there some way to change the referenced IP address?