Just got the error again, maybe it takes a bit to become available?
Try one more time...
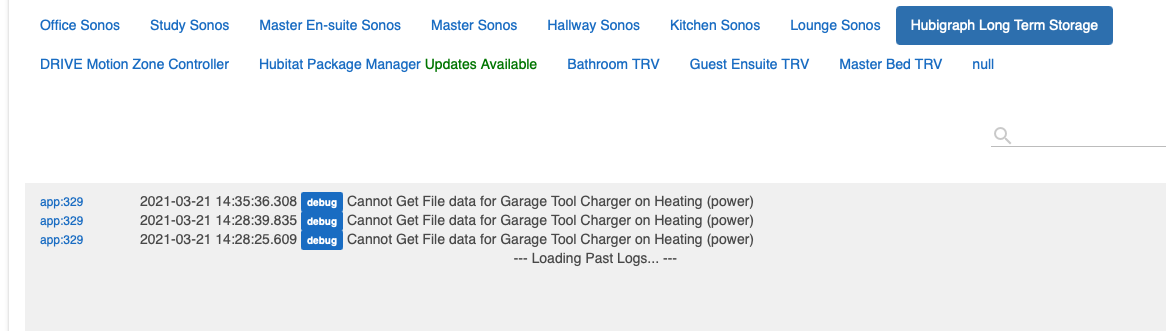
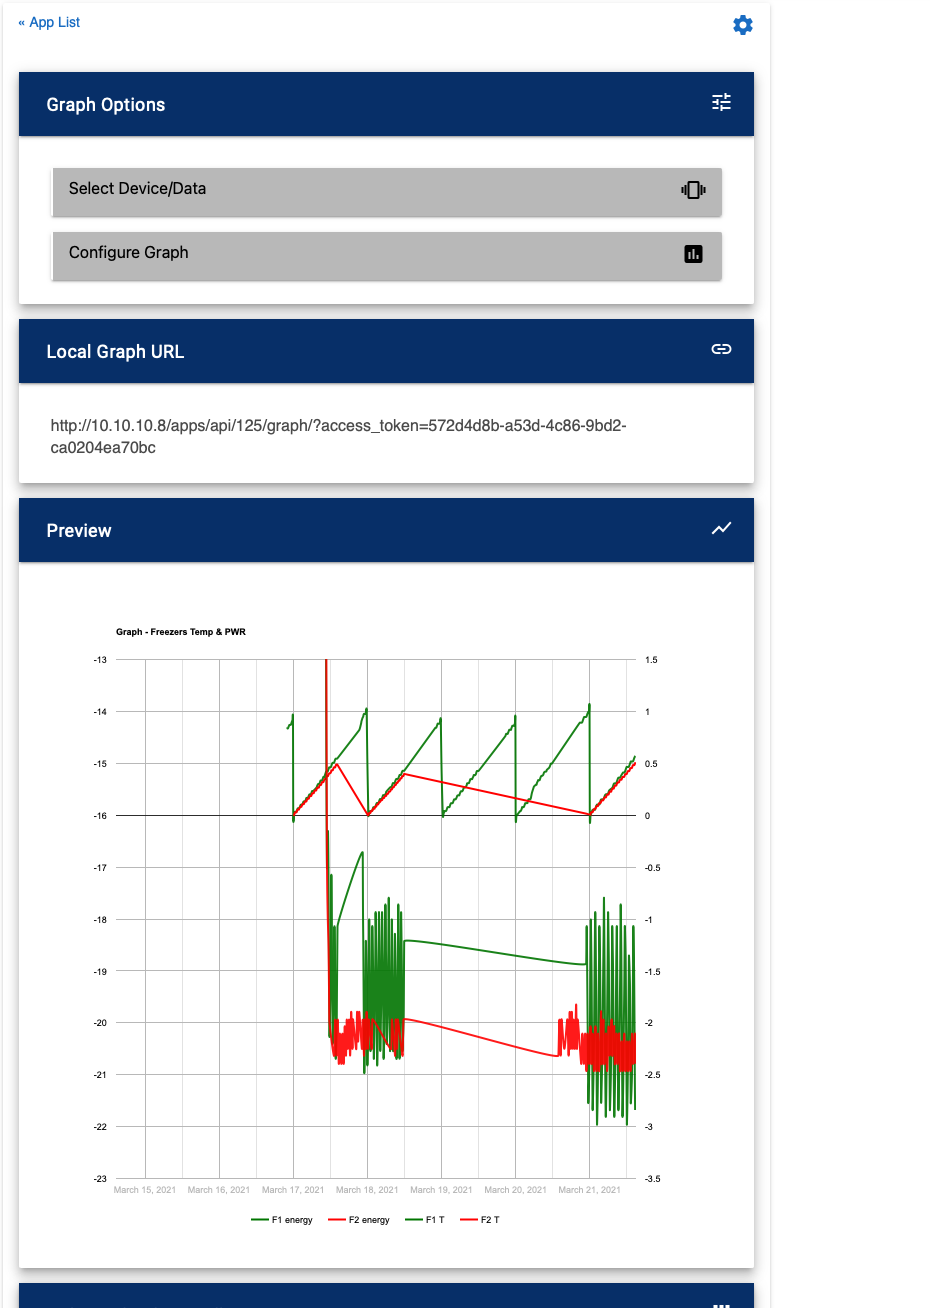
Installed, now let me see if the graph is working. 
1 Like
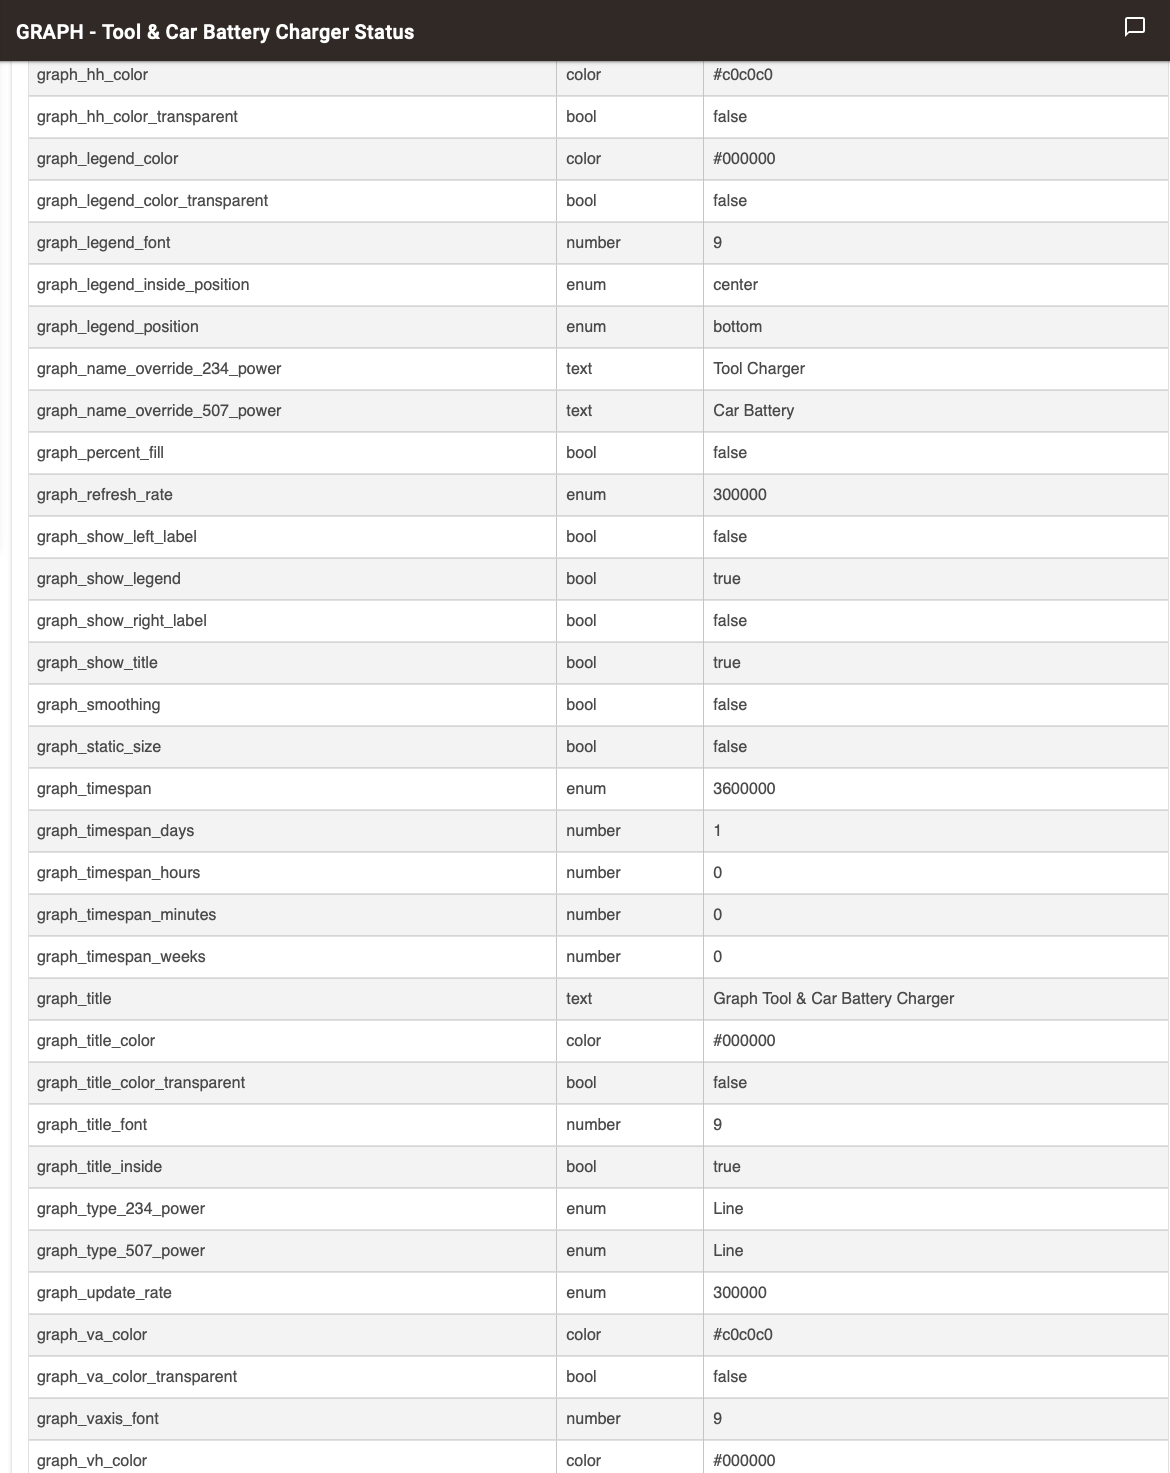
Graph_timespan is still an enum. No change to graph. I opened the config page and changed the number of days to 8 weeks and saved and then went back and changed to 4 weeks and 4 days with no change.
Going to have to rebuild completely?
I had hoped not, but it looks like, yes. Sometimes I find the implementation of the update functions to be...squirrelly... I'm sorry....
3 Likes
Ok I have now gotten it to show 32 days of data, but I had to set it to show 33 days. For some reason the last data point will not show in the graph.
The data from this morning at 12:05 am is not in the graph, although the data is in the LTS file.
Or is there an app I can just copy for reference?
Once version 2.2.6 is released, I will update the code (I already have it working) to enable "daily" and "hourly" rounding of the data. This will eliminate the issue. As a note: this "feature" is what broke the code earlier.
1 Like
Updated to latest version using HPM.
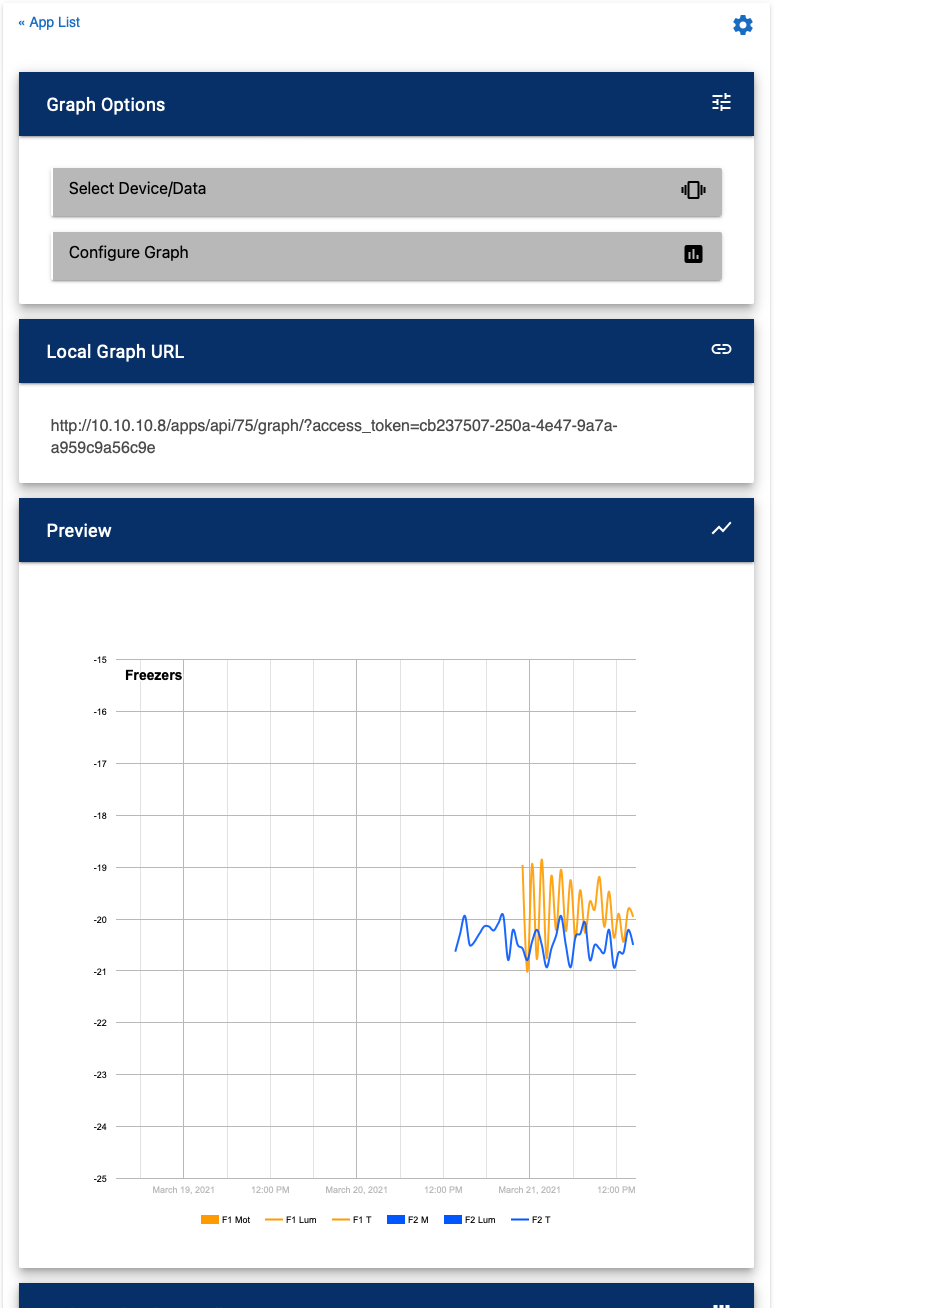
A 5 week graph using LTS

A 1 day graph with LTS disabled
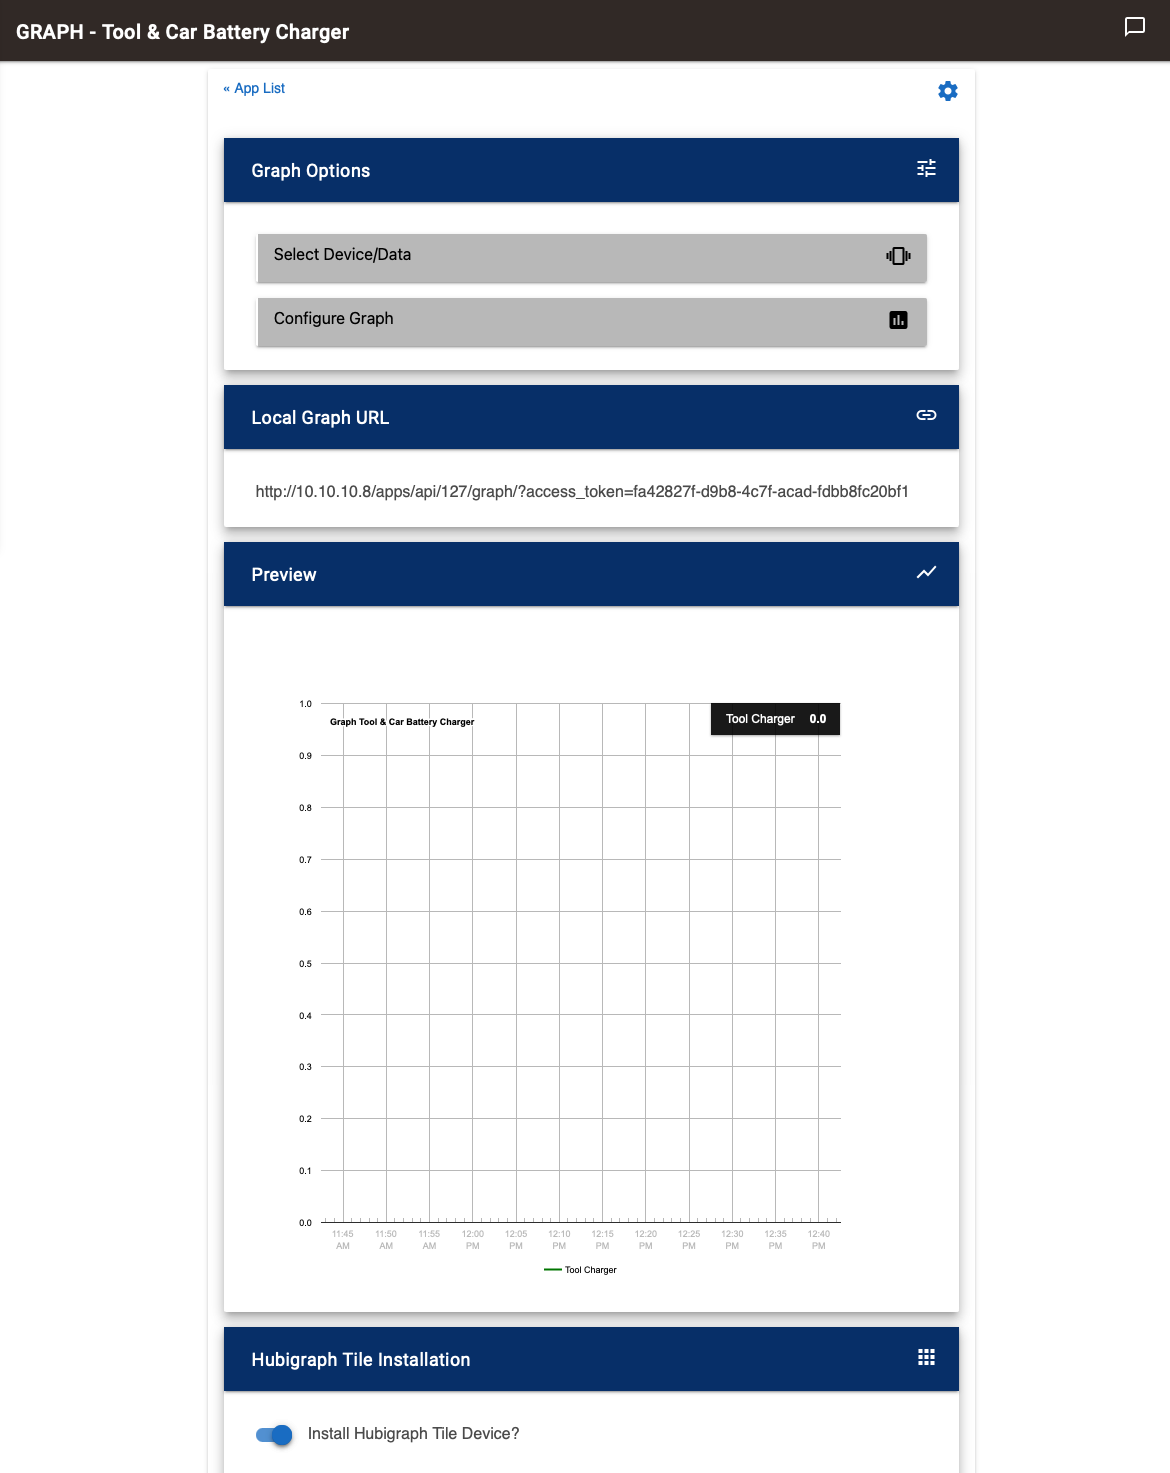
Logs for LTS
app:3292021-03-21 12:41:42.252 debugCannot Get File data for Garage Tool Charger on Heating (power)
app:3292021-03-21 12:40:48.729 debugCannot Get File data for Garage Tool Charger on Heating (power)
app:3292021-03-21 12:40:02.037 debugCannot Get File data for Garage Tool Charger on Heating (power)
app:3292021-03-21 12:38:14.467 debugCannot Get File data for Garage Tool Charger on Heating (power)
app:3292021-03-21 12:38:02.456 debugCannot Get File data for Garage Tool Charger on Heating (power)
app:3292021-03-21 12:37:40.475 debugCannot Get File data for Garage Tool Charger on Heating (power)
--- Loading Past Logs... ---
Yep, same issue as @terminal3. Please delete this graph; update (HubiGraph) and then rebuild it. There is an issue with previously defined settings that hold on to thier type….
1 Like
OK
Deleted Graph.
Running x.86
Recreated Graph
Issue of it not creating duration correctly resolved.
LTS still broke
Still getting
I'll try removing the device from LTS and re-adding it
Long Term Storage Graph

Long Term Storage not enabled graph
Both were for 6 day graphs - I'll delete and re-create
This is one day graph
Looks like ALL the graphs require re-creating ugggg
Need to find out why the data gaps as well
Getting this error when trying to update.
Without reading the rest of this thread is it a known issue?
Is there something I need to do?
Thanks.
EDIT: I get this when trying an update or a repair in HPM.

Ok; I know the gaps; Sorry about the recreation....
The gaps are probably being created by 1. Not storing data frequently enough or 2. Not having enough "max State" under the device.
Due to Hubitat's (relatively recent) changes, "max state" has changed from 2000 events to 30. LTS tries to balance this by writing data to storage on a schedule. The "gap" you see is simply the last LTS save and the latest data pulled from the database. Make sense?
As an example: I have a weather station that sends data every 5 minutes. That is 12 updates an hour or 288 updates a day. My "max state" for the device is 100. Therefore I update LTS 3X a day, starting at 12:05 am. You want to be careful NOT to update LTS too frequently (as threading is not available) and it can hold things up for a few seconds on the hub.
Also, I added a more descriptive debug for LTS complaining about the file not existing.
@bobbles, Sorry, had a mixup in the checkin. Please run a repair. Summary: I use beta firmware and the devs at Hubitat whitelisted some functions that I inadvertently took advantage of. The good news is once the 2.2.26 becomes available, you will be able to quantize LTS by day boundaries....
No problem. Thanks for all your efforts.
1 Like
I'm trying to do some house keeping and seen these files in file manager, I do use long term storage option, but are these all need or from legacy versions (I have deleted some which had weather tile in them)

Hi all
Is there a way I can make a graph that would show if power was above 200 watts and for how long I try to track a pump to see when it runs and for how long
Time Line (not Time Graph). It will let you set thresholds on numeric values

