@terminal3, thanks for the data. I’ll keep looking. Was this a “new” graph or an “updated” one?
Do you think there is a way we can import Amazon Alexa's Energy Dashboard? I want to graph that usage. I like how we can manually add an energy estimator for light bulbs. I haven't found a way to add a manual estimated watt for a light in hubitat.
Thanks
@thomas.c.howard, It was updated but I think I removed and rebuilt this one. It was probably right after the initial release with LTS.
Why won't a New Tim Graph create a graph longer than 1 hour
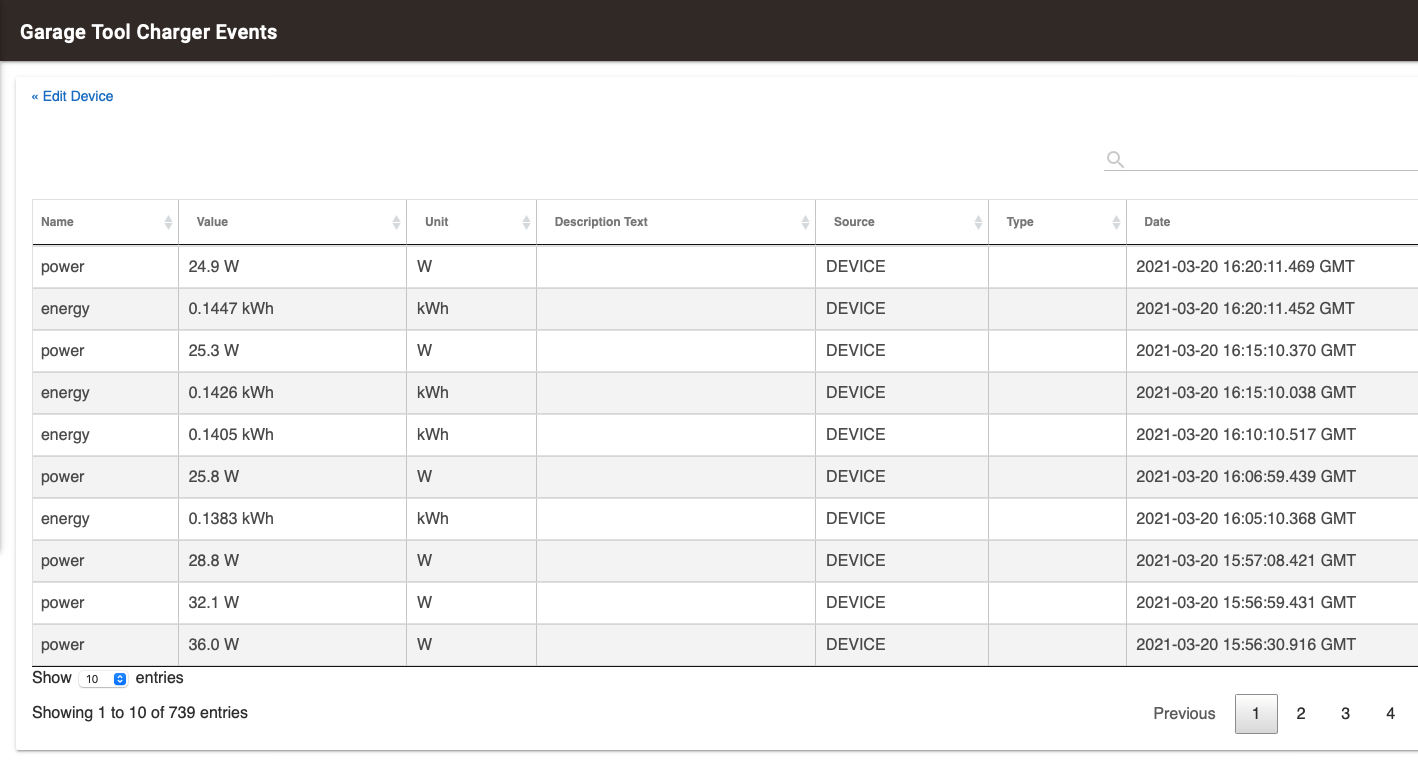
Long Term Storage is enabled for the device and has been for a few days.
I am capturing this error in the Hubigraph LTS
app:3292021-03-20 16:23:23.179 debugfalse true
app:3292021-03-20 16:23:09.555 debugfalse true
app:3292021-03-20 16:19:26.297 debugCannot Get File data for Garage Tool Charger on Heating (power)
app:3292021-03-20 16:18:54.194 debugCannot Get File data for Garage Tool Charger on Heating (power)
app:3292021-03-20 16:18:32.234 debugCannot Get File data for Garage Tool Charger on Heating (power)
Even with LTS not enabled in the Graph options and with 700+ events stored locally it will only show the last 60 mins of events.
Configured for 1 day of graphing

Result sin a 1 hour graph - it makes no difference what duration I set for the graph it always just does 60 minutes.
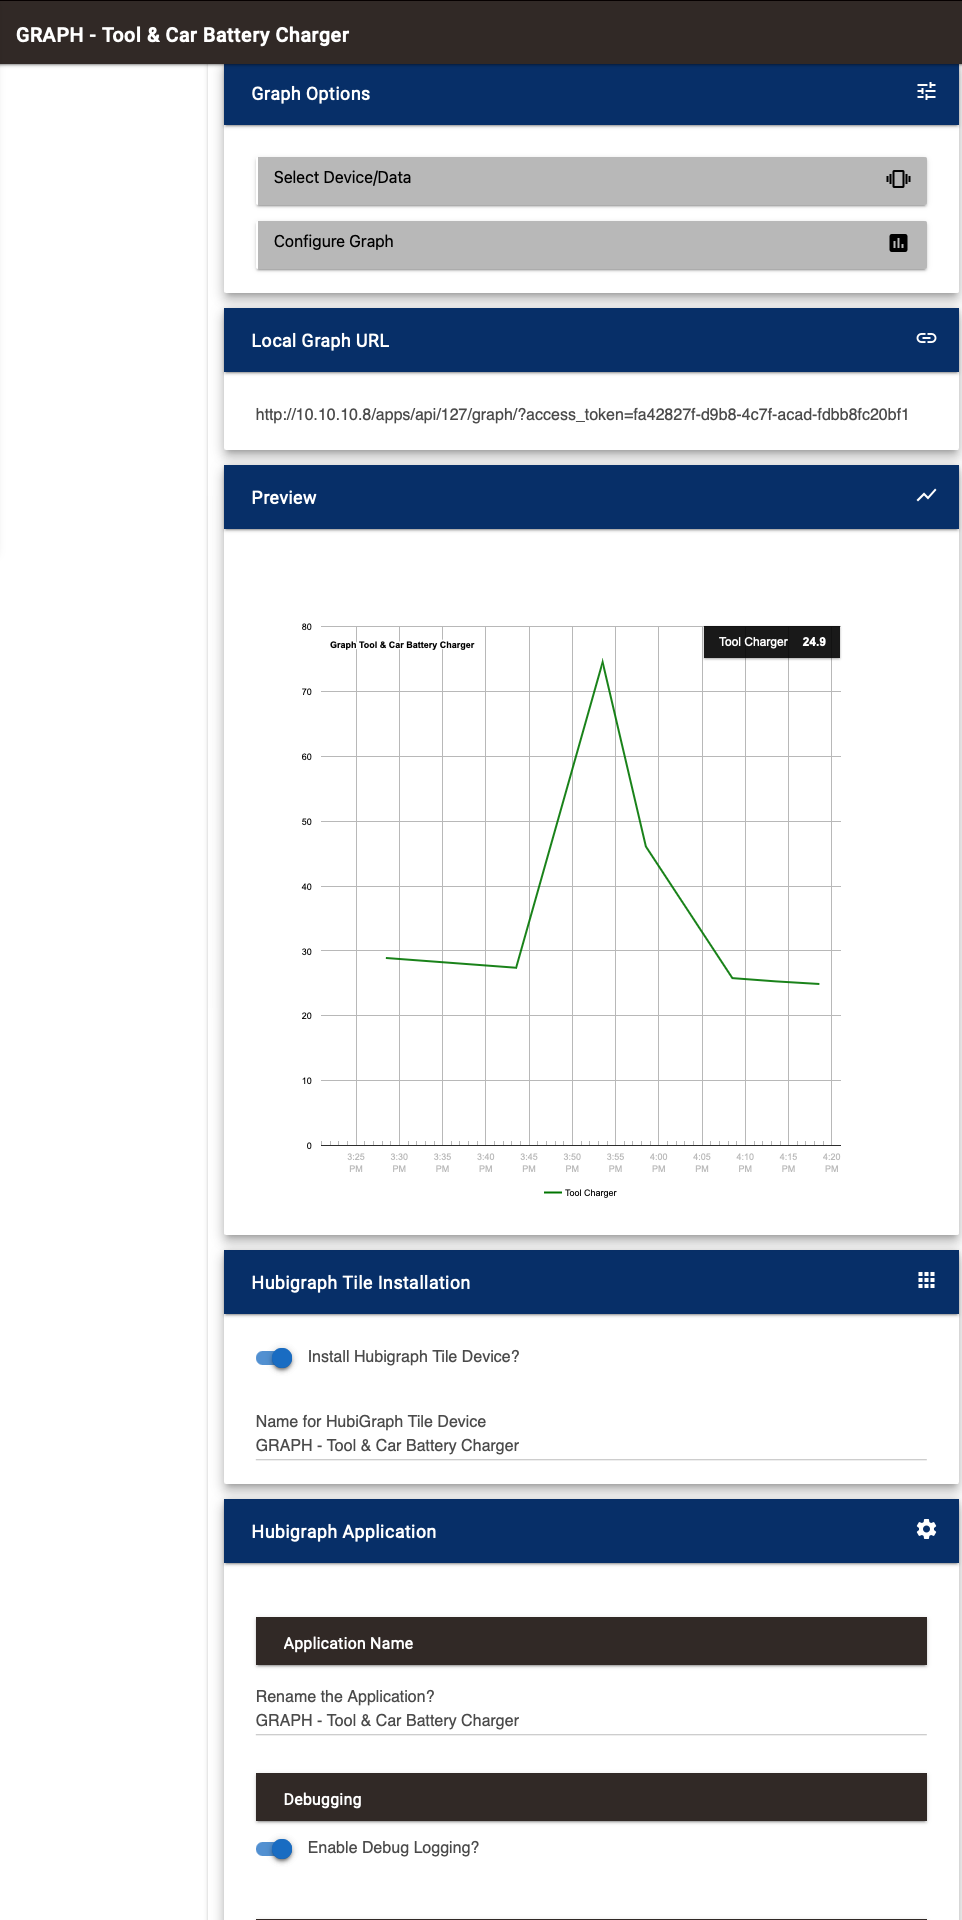
Any ideas?
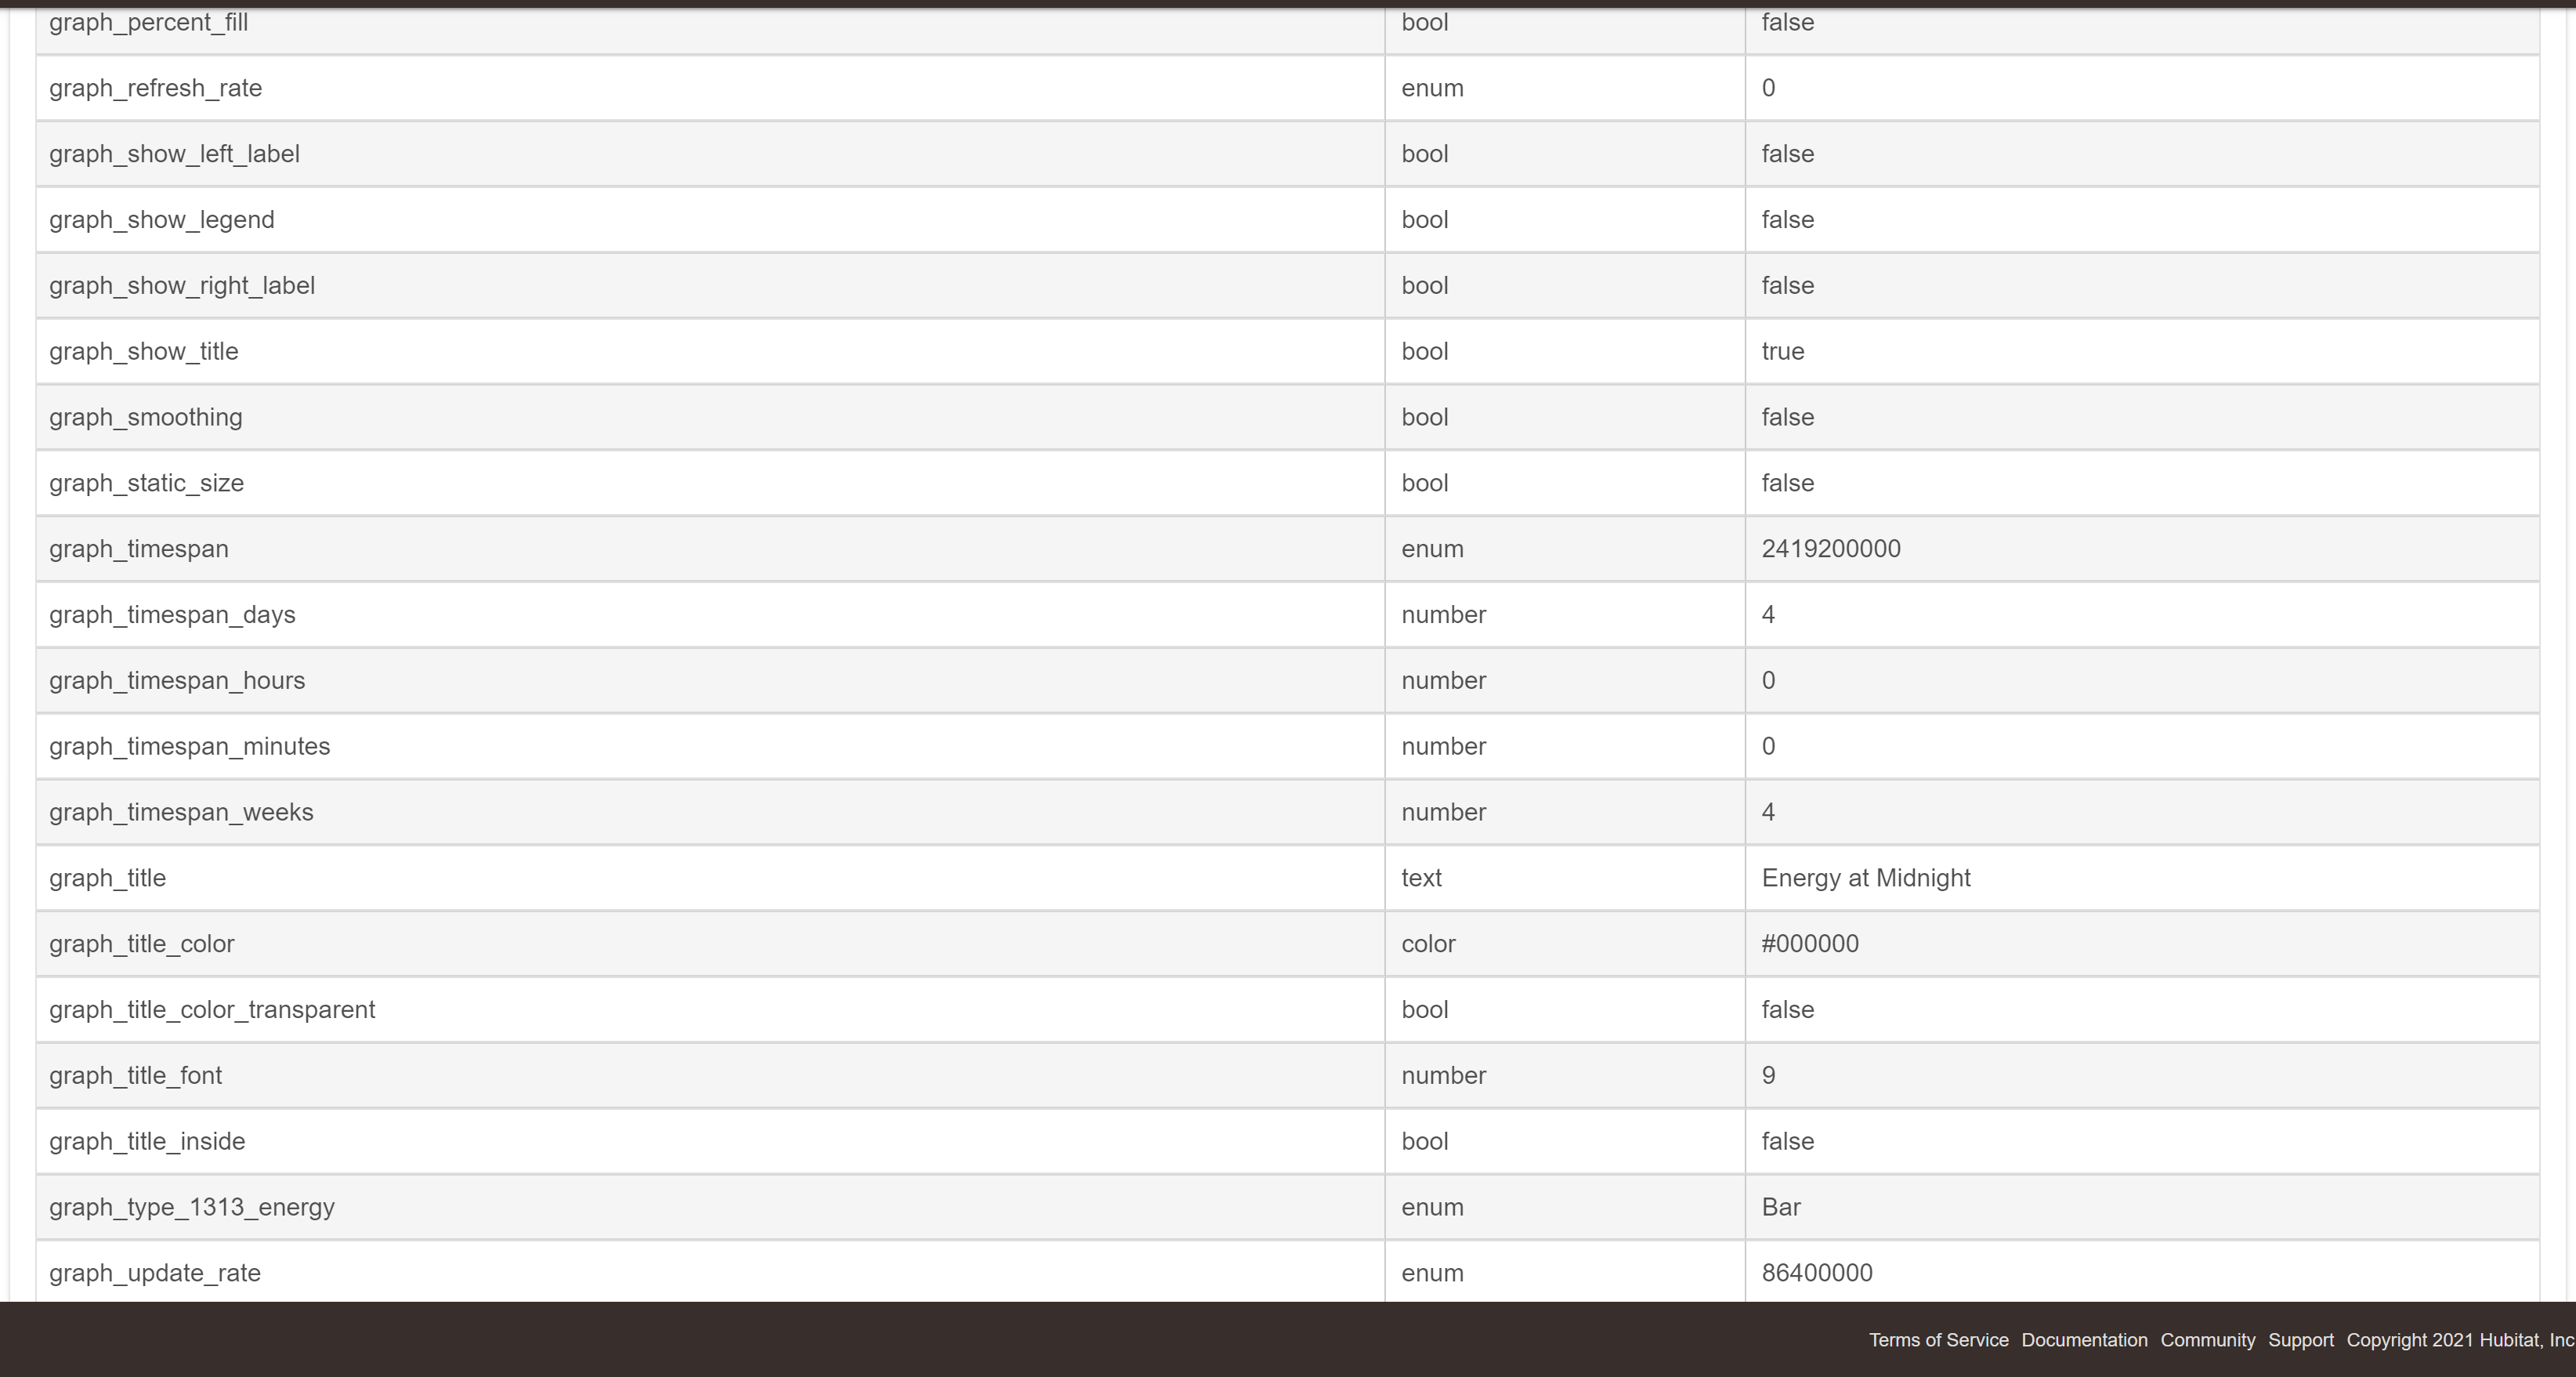
@terminal3, @habitat, could you send a screenshot of the settings page (by clicking the widget icon in the upper left hand corner). I am particularly interested in seeing the graph_timespan variables...
Are you sure you set the graph to use lts. Its an option in the graph in the data element
Yes
This is easy enough to do; I think however, it would be better to approach this from an external App perspective. One that allows the uses to "listen" to individual bulbs/devices and total up to the usage based on user input. It could then record power usage on the 5/10/20/30/60 minute timeframe.
From there, building the graph is trivial.
@thomas.c.howard, is this what you need?
@terminal3; I think I have it (@habitat too). Please get the latest release.
I looks like this graph was built before I added the slider implementation. The graph_timespan was an enum. Now it is a number. I have put in a change so if you visit the options it should update the type... Also notice the graph_timespan in the image is the number of milliseconds in 4 weeks, NOT 4 weeks + 4 days.
1 Like
I don't really know how to create an external app. Can you give me any pointers? Thanks for the help.
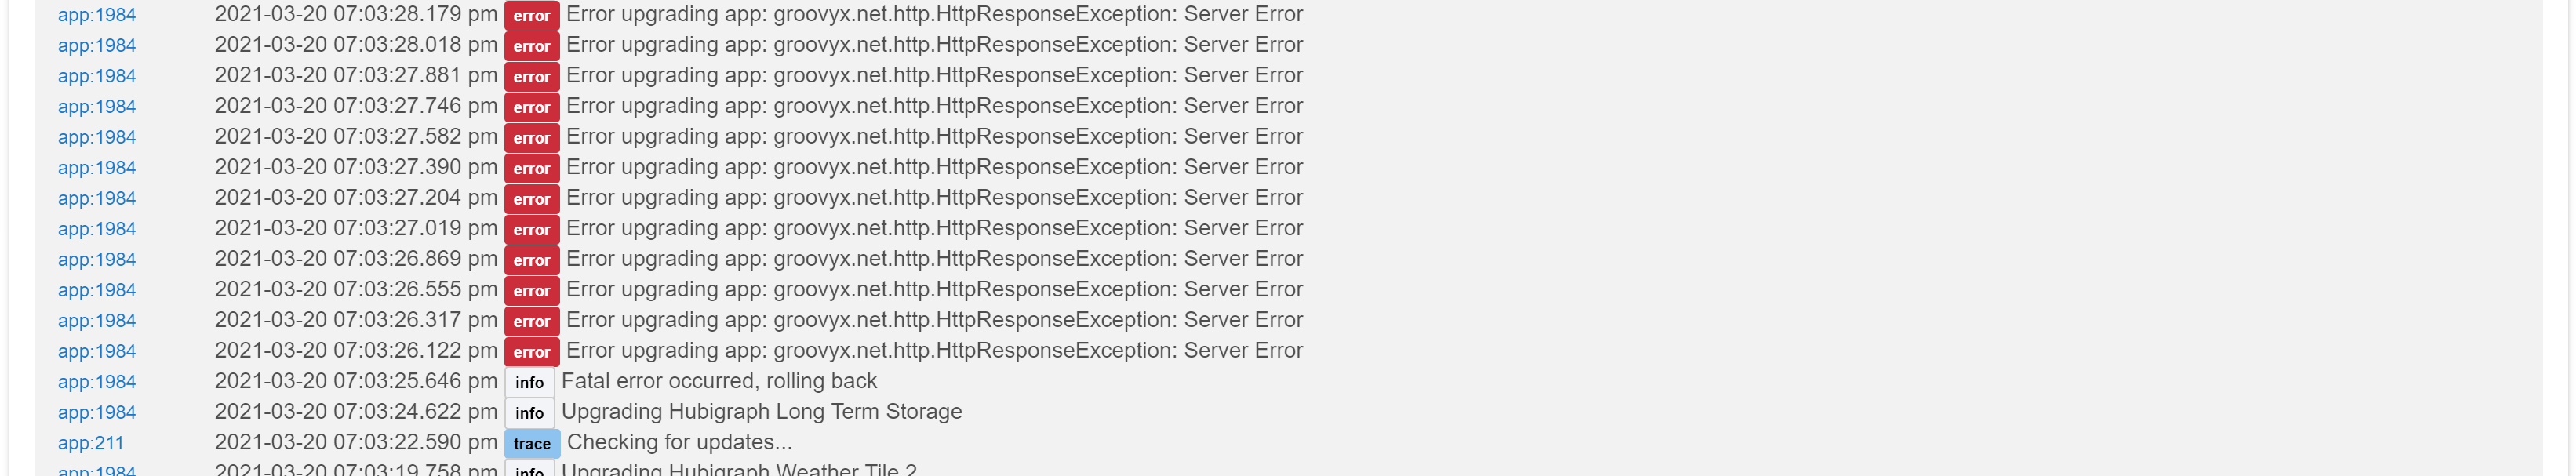
@thomas.c.howard Got this error in HPM when I installed, tried twice with same results.
An error occurred while installing the package: Failed to upgrade app https://raw.githubusercontent.com/tchoward/Hubitat/master/hubigraph_long_term_storage.groovy.
Got this in the logs.
Also grab Hubitat/hubigraphs.groovy at master · tchoward/Hubitat · GitHub
And Hubitat/hubigraph_time_graph.groovy at master · tchoward/Hubitat · GitHub
Those were the three files that changed
Went to github and grabbed the source and tried to install under another name just to see if it would save and I got this error.
Expression [MethodCallExpression] is not allowed: org.apache.commons.lang3.time.DateUtils.truncate(date, java.util.Calendar.HOUR) at line number 282
@thomas.c.howard See above Long term storage will not save it says there is an error.
Looking at it now; I got it to install fine on my master (not dev) hub.... Literally took the code, pasted it under new app and it work fine... What is going on !???
ALL -> Please see @terminal3's comments above. Is anyone else seeing this issue?
FYI I juts tried installing on my other C5 and I got the same error.
Just uploaded a fix; I am running beta software. It has a whitelisted function that I took advantage of.
2 Likes
If it does not say "For terminal3" as the first comment, it is the wrong one

