I agree and Thanks! to @thomas.c.howard for constant improvements. I don't mind at all testing the "beta" and providing feedback to help. Keep up the good work ![]()
3 Likes
My daily usage energy graph still will not display more than 28 days of data and the last data point is not shown in the graph. It is in the LTS file but will not show unless I change the time as I mentioned in my earlier post.
Just updated to the latest version.
1 Like
@terminal3, I think I understand the issue. I need to figure out how to best deal with it. Here is the issue: If the user says they want to see back 30 days, Hubigraphs uses "current time" to compute each day. So the span of a day is NOT midnight to midnight (it is whenever you build the graph). I think I need to add an option to break up the time span by hour, days, months, etc. Thoughts?
This might not explain everything, but it might explain part of the issue. I will work on this tommorow.
1 Like
Do you think there is a way we can import Amazon Alexa's Energy Dashboard? I want to graph that usage. I like how we can manually add an energy estimator for light bulbs. I haven't found a way to add a manual estimated watt for a light in hubitat.
Thanks
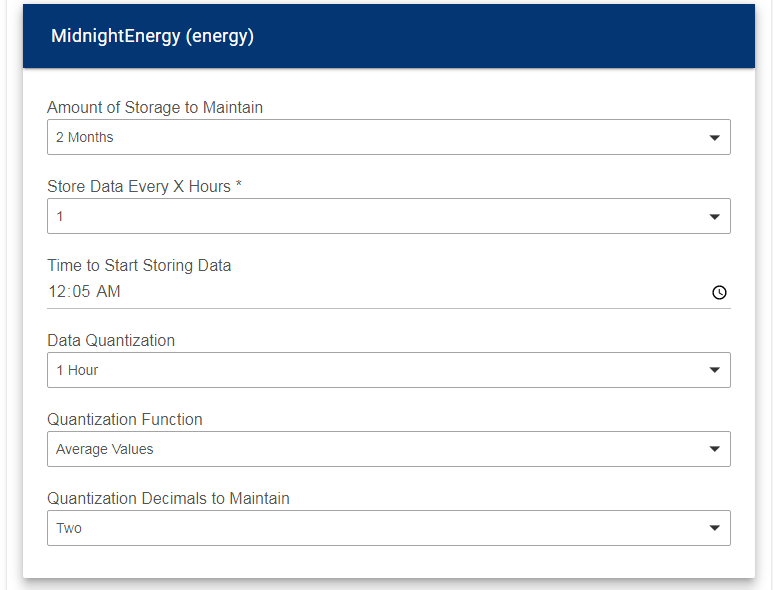
Since that is the way it works, can we get the default start time changed from 12PM to 12AM? That way we don't have to manually change the start time on every data point we add every time (assuming most people saving long term data want to be collecting it 24 hours a day). Dropping the first 12 hours of every day by default seems very uncommon....unless I'm misunderstanding this. ![]()
1 Like
Yes; I can do that
2 Likes
I guess I don’t understand. If it were short one day I guess that makes sense but it’s short 4 days.
Also the data that is in the LTS file with the different time stamp due to time change shows up in graph a day later. If I change the time stamp the data then shows up immediately. So it seems to me it’s not a matter of when it writes to the file as the data is in the file, just not displayed.
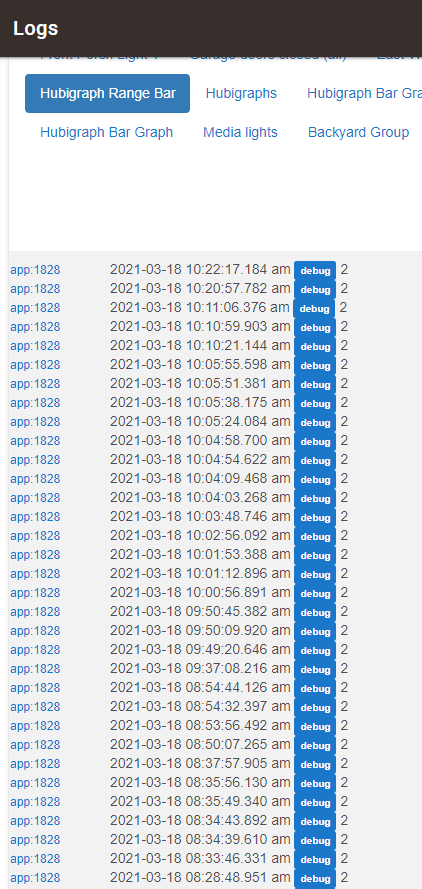
Just checking to see if you have any more insight into this. I've tried it on both the latest Chrome and the latest Brave browsers and getting similar results. Also I've upgraded to the latest HubiGraphs w/ no change.
I looked into this briefly; which OS? The browser implementation does not seem to support dialogs…
Win 10
@terminal3, I have run multiple tests. I hope this doesn’t come off wrong, but: Are you sure you have the LTS set to more than 4 weeks?
1 Like
It's very possible I am doing something wrong. I have been really busy this week, so I have limited time to play with this. Hopefully this weekend I can post screen shots of all the settings and you can see what I am missing.
1 Like
Been Playing with Range Graphs
I configure one element to display, Temperature.
It displays one element on the graph.
Edit the graph - Select Edit Device/data and Hubigraphs adds a second Temperature Element to every entry then the graphs shows every element duplicated.
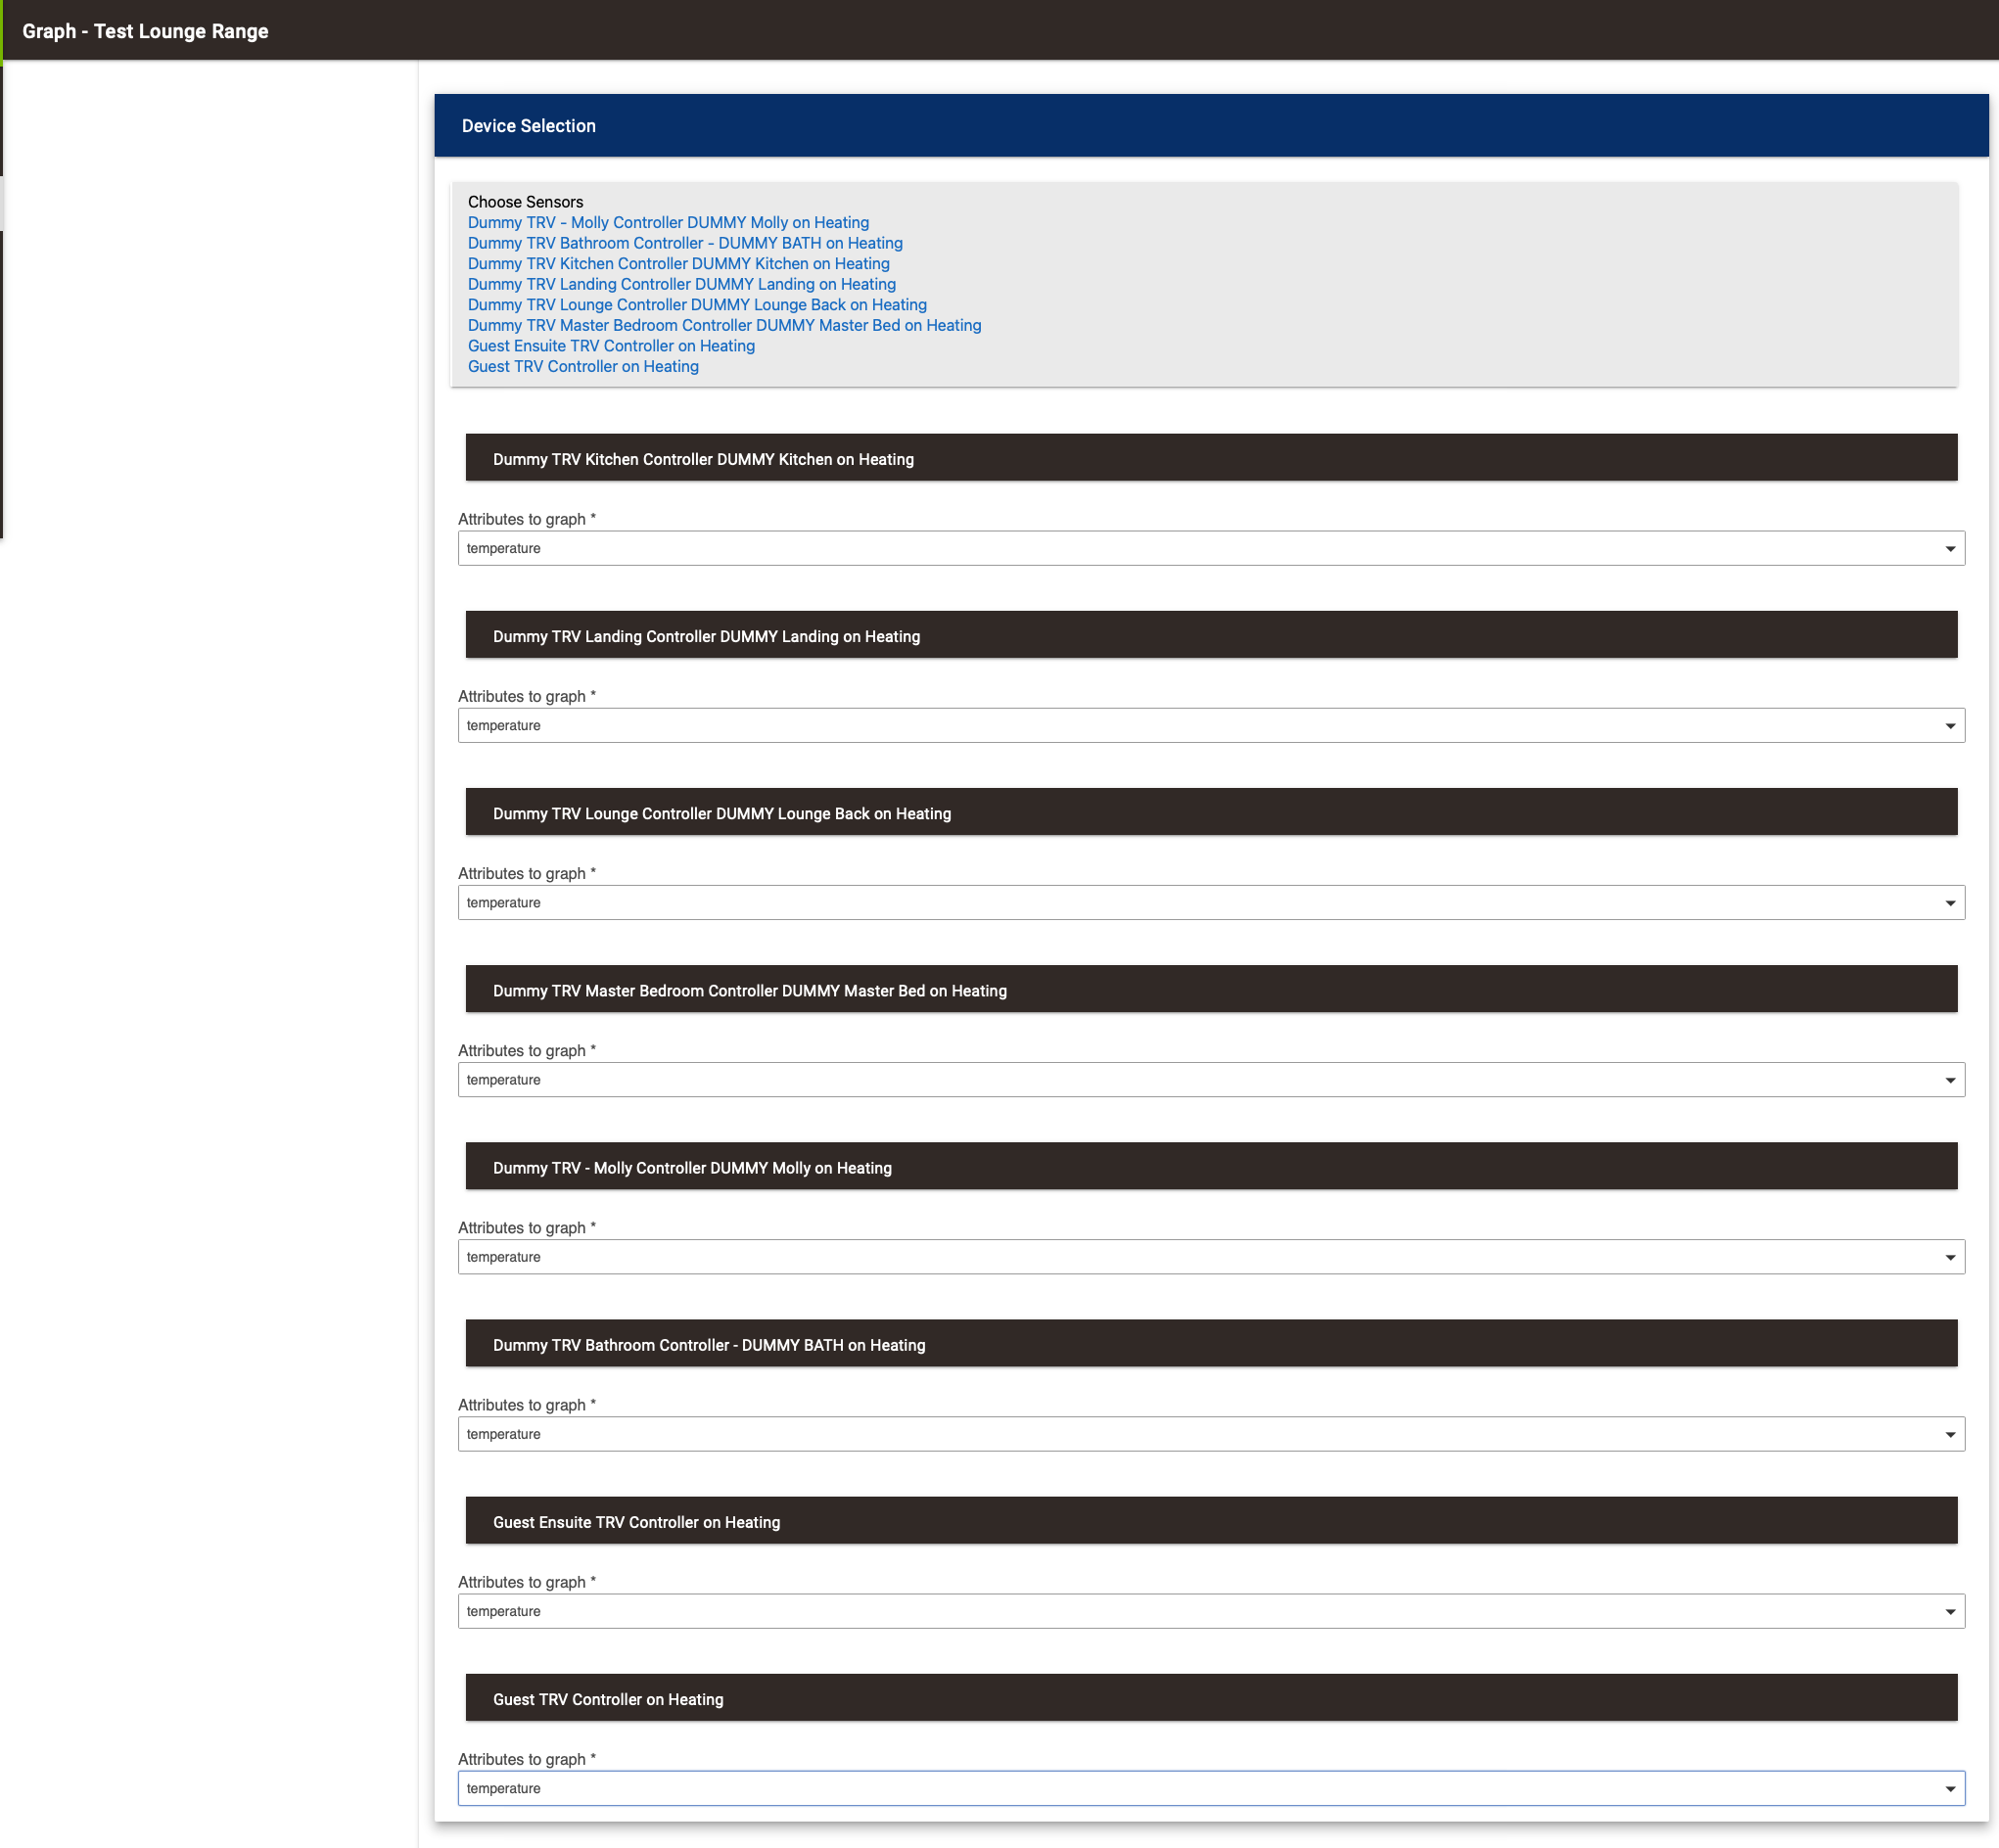
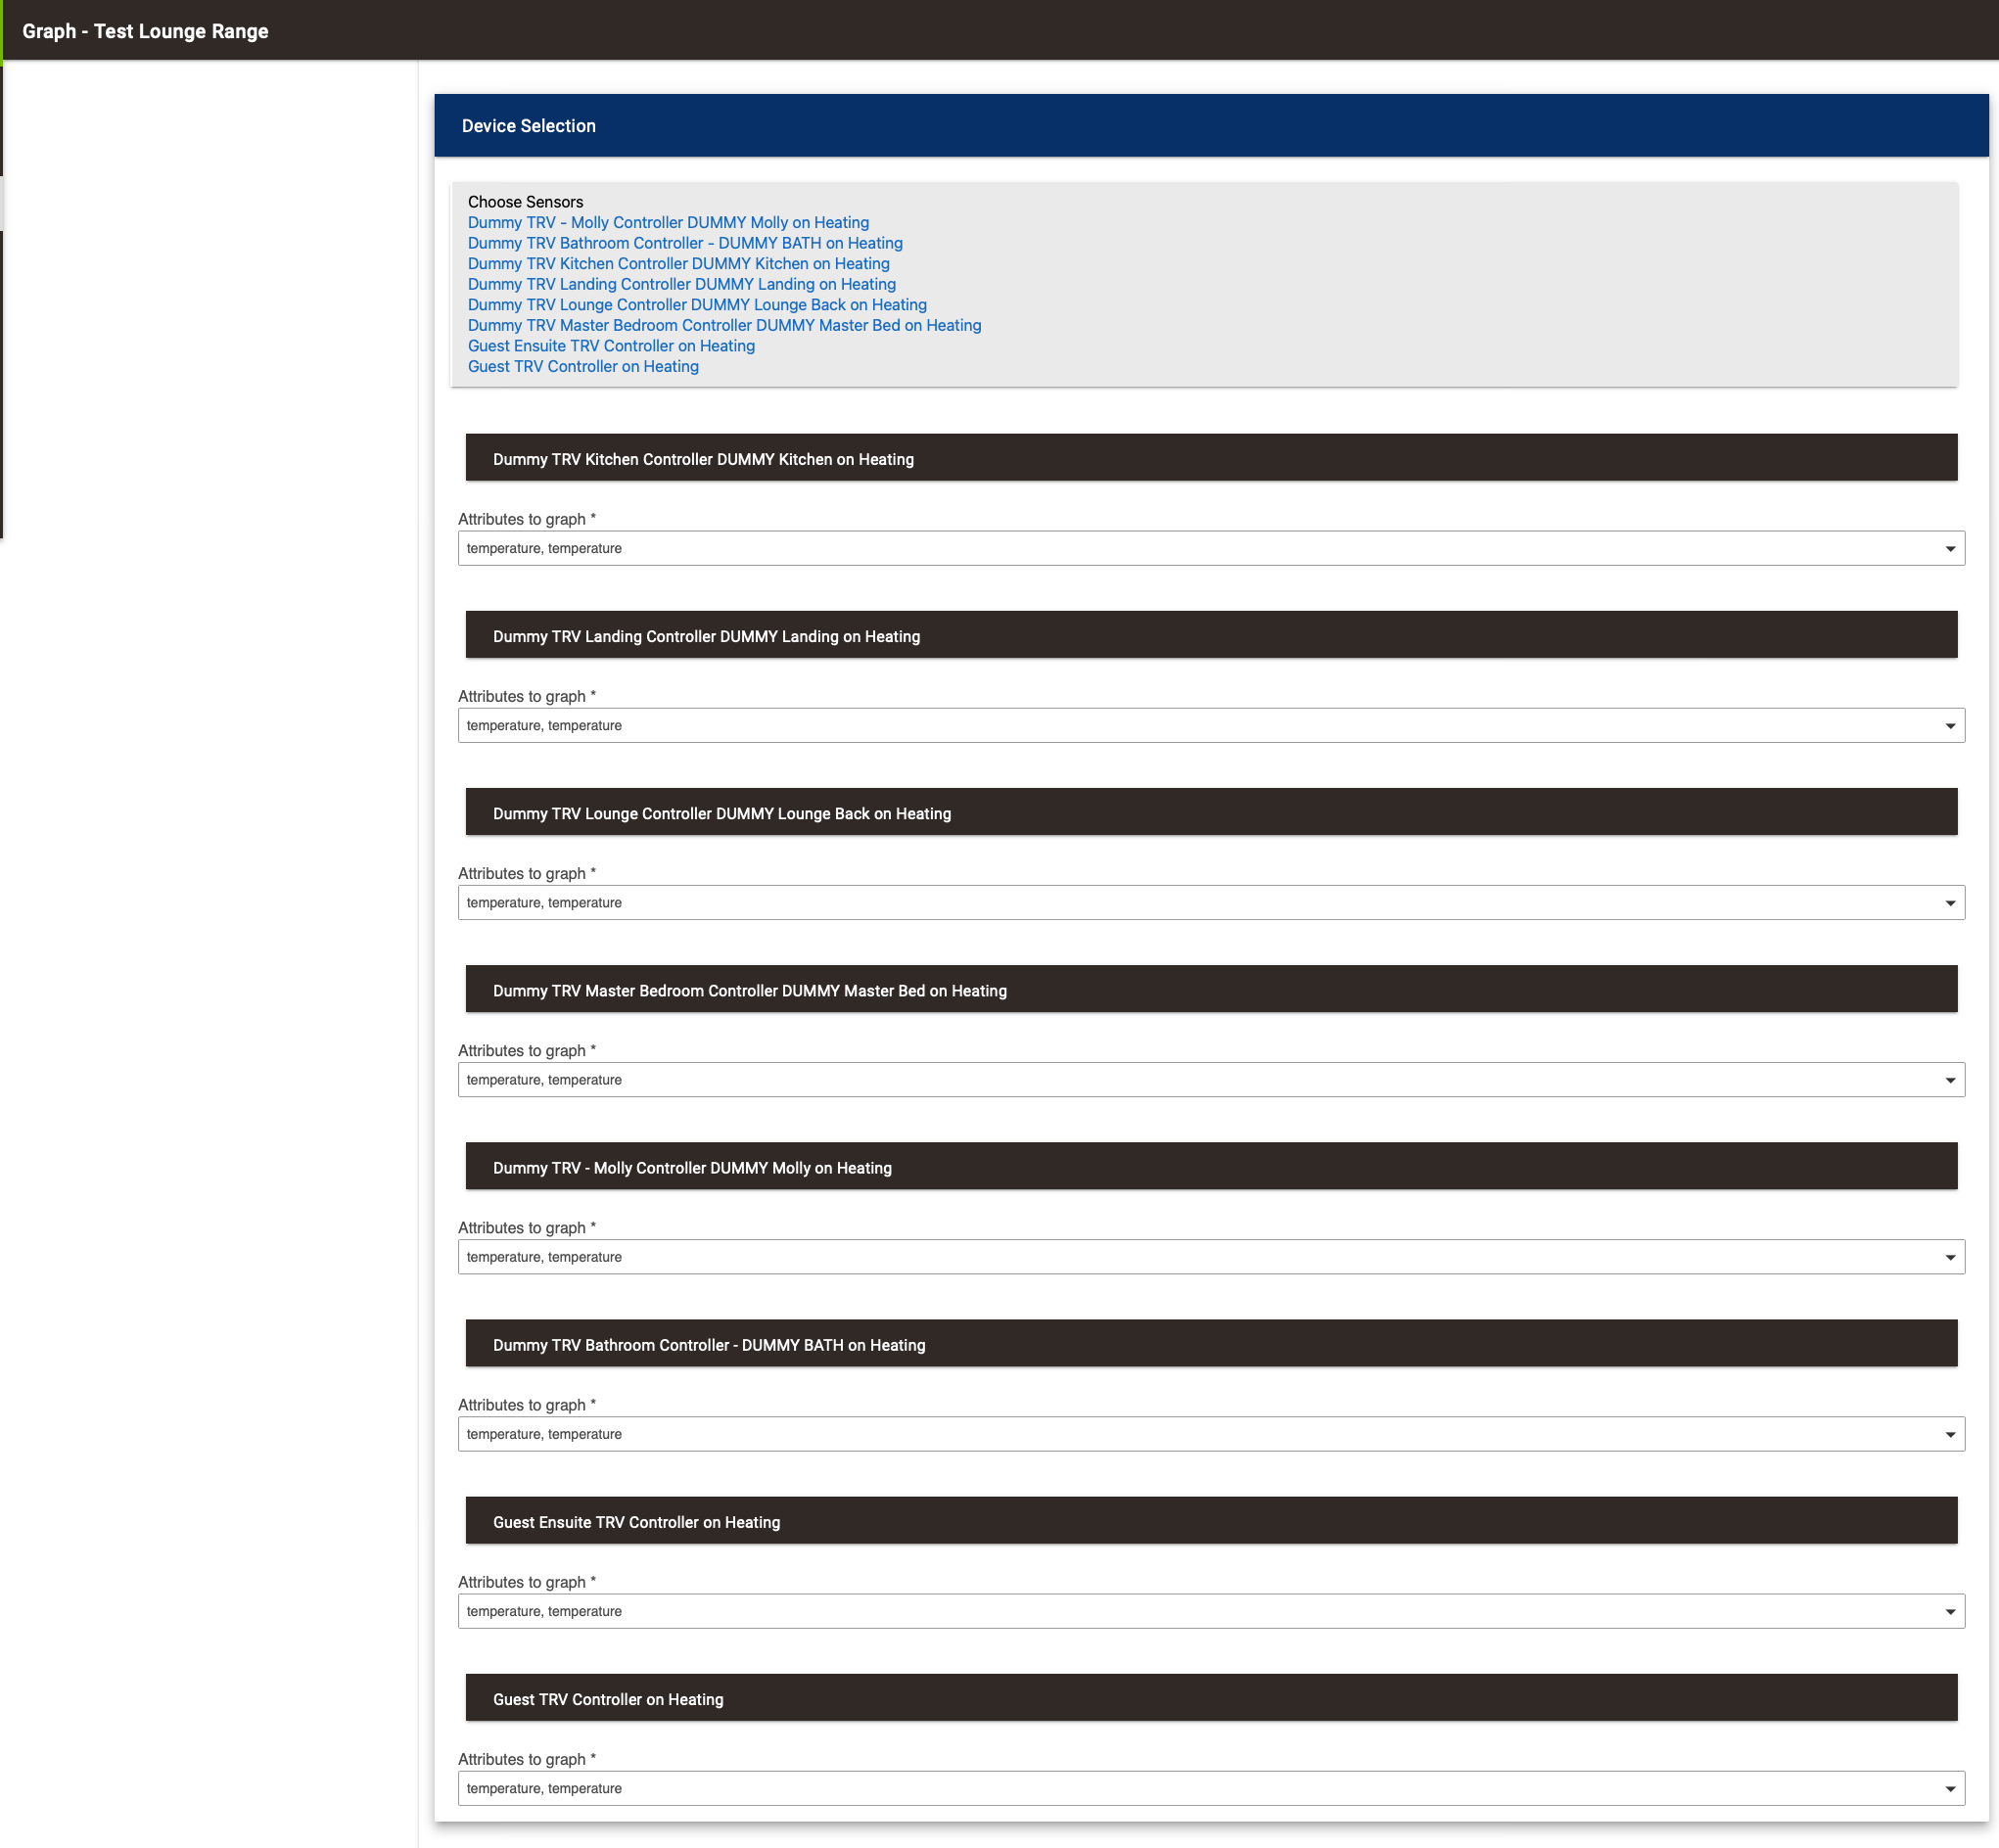
Not a real issue just odd that it keeps adding extra duplicated attributes every time you edit it 
Also worthy of note - but not an issues.
negative numbers, ie -20c are not shown on Range Graph as Show Current Value on Bar
I am getting Error 404 when trying to create Bubble Graphs.
I did a full Repair of Hubigraph using HPM and it reports all is good so not sure of the issue.
Not an issue - just thought I would od some testing while I was doing this.
Bubble Graphs are not yet available
1 Like
I won't use it then
BTW - really enjoying working with these graphs - thank you so much !!!
1 Like
Hi All.
I am having an issue with HubiGraps.
I have a C-7 latest firmware.
It would no update so I have uninstalled it with HPM, Then try to reinstall it with HPM.
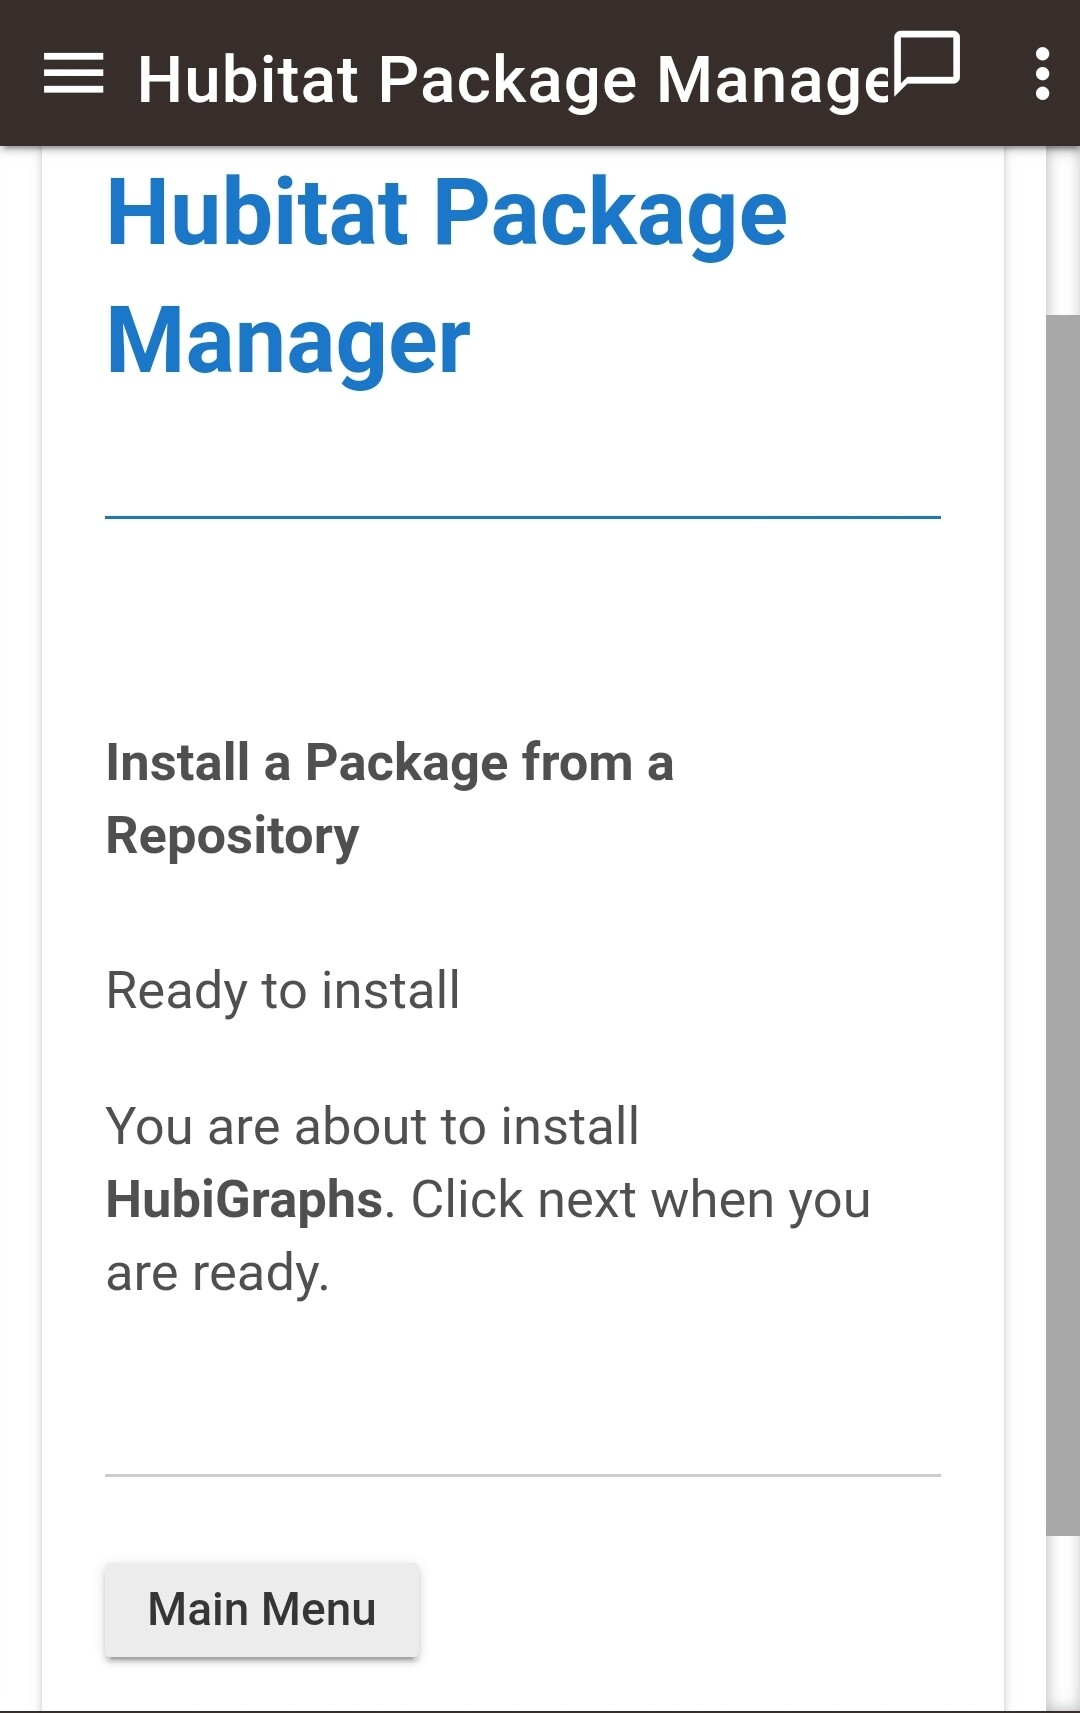
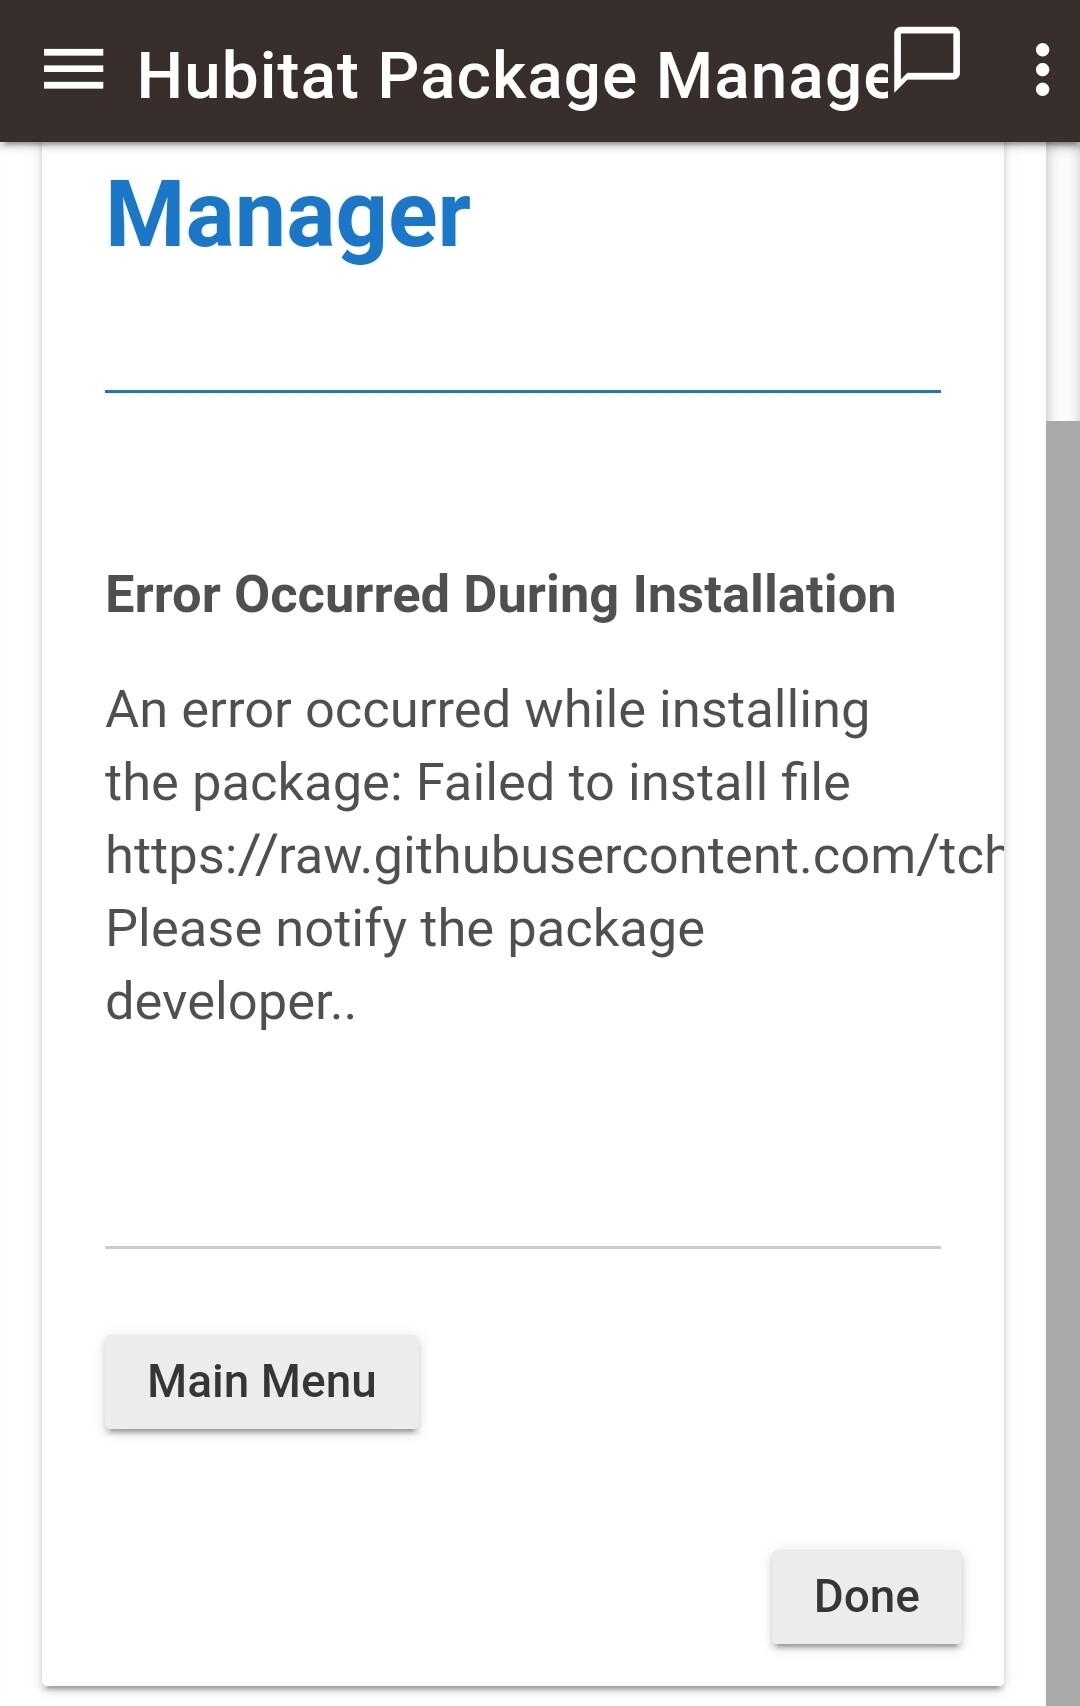
Any help would be much appreciated.
Any other information please ask
@thomas.c.howard, okay here are all the settings for the graph that does not display correctly.
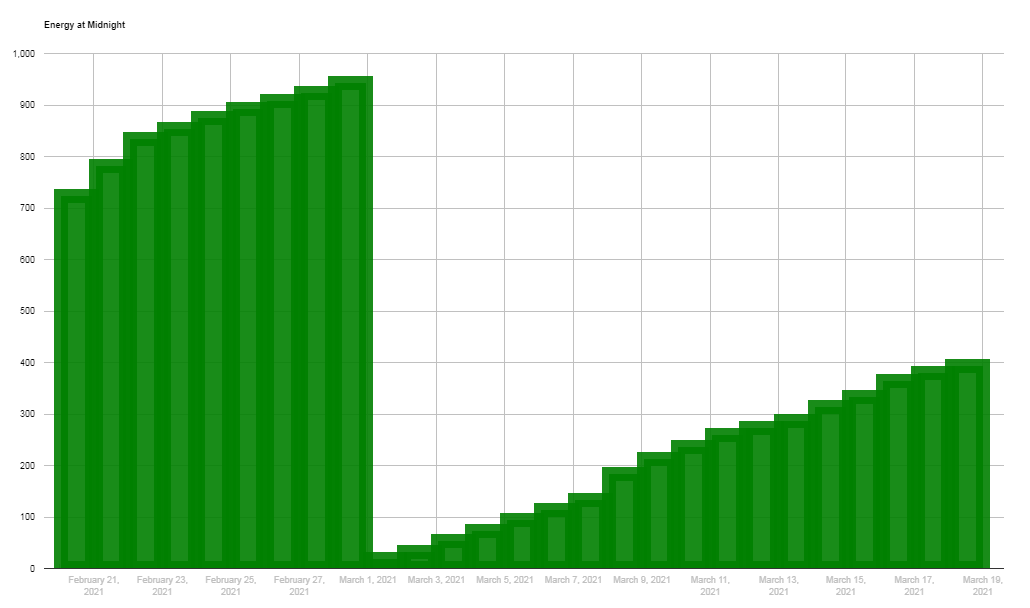
- The graph as it shows in a dashboard. It looks the same in the preview of the app as well. First data point shown is Feb 20, and the last point March 18. Let me know what else you need.
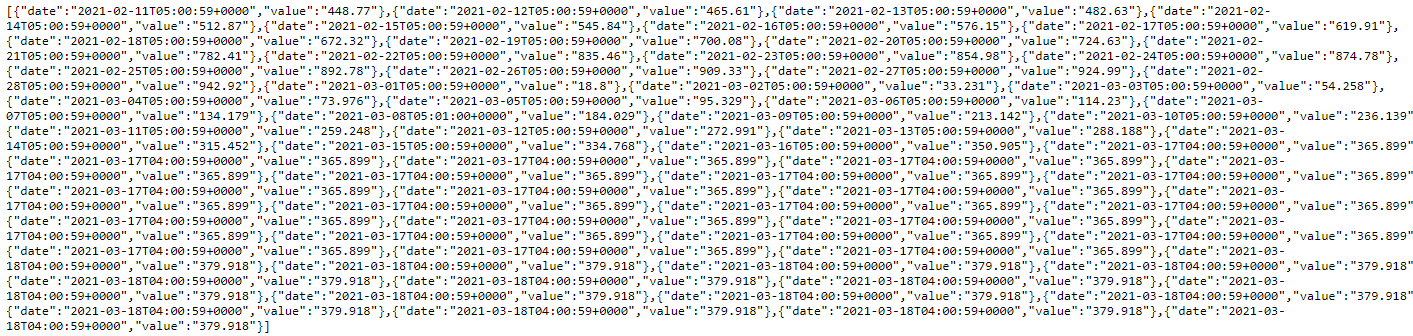
- The data currently in the LTS file. First data point is Feb 11, and the last data point is Mar 18, there are 19 entries of that data point currently in the file.
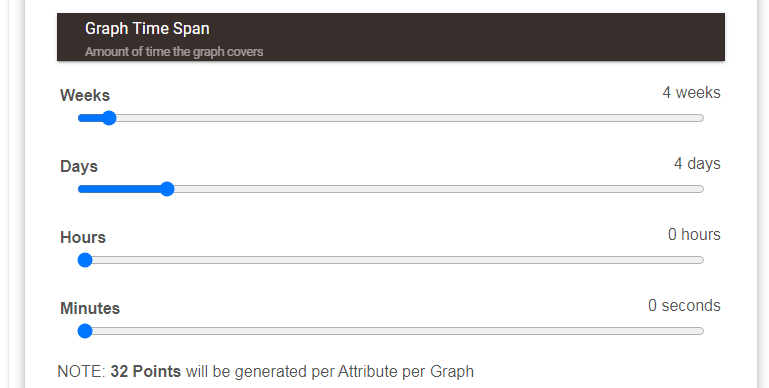
3)Graph Time span setting
-
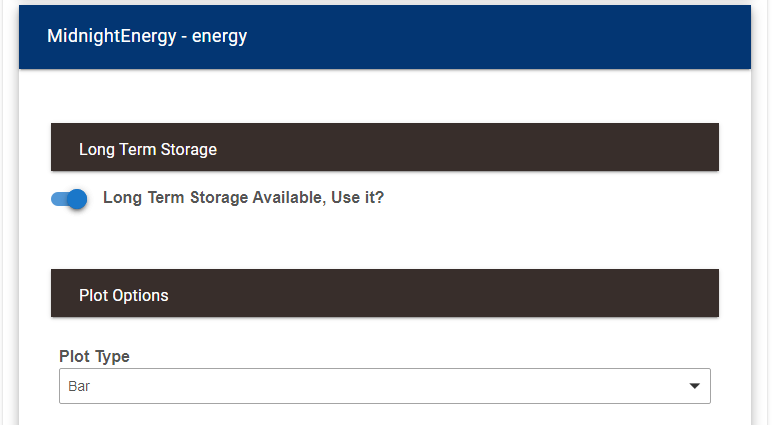
Plot type LTS on
-
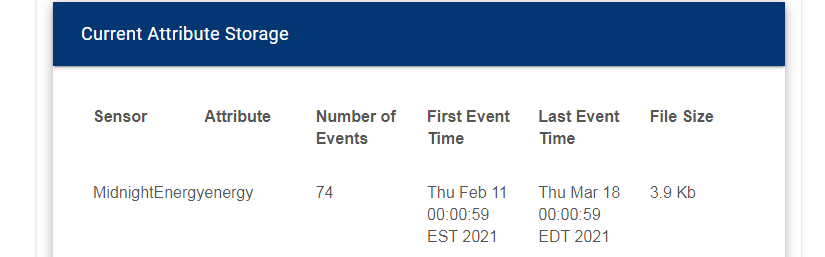
LTS overview
- LTS setup