no i know how to view the source etc is there a button to view the console. i am running chrome
On Chrome you press shift-control-i. It shows the console output which will tell why you are stuck on 4/4 (which mean the hub is done and it is all on the browser)
thanks ..good to know for future.. all working again.. did you change something on your side or was some cloud url not working
sometimes I have seen libraries not loading due to internet or... reasons.... Other than that without seeing the console output there is no way to know.
Yeah, it wasn't set. I thought everything had a default answer.
I got the error again on the hour, but I had not clicked the slider to use LTS. So I just updated the sensor to store every hour and moved the slider over to use LTS so I will see if I get an error in another hour.
ok will get error log if it occurs again.. thanks again.
Hi Thomas,
I have just upgraded to 4.81, my Weather Tile 2 is not showing any data and giving the following message:
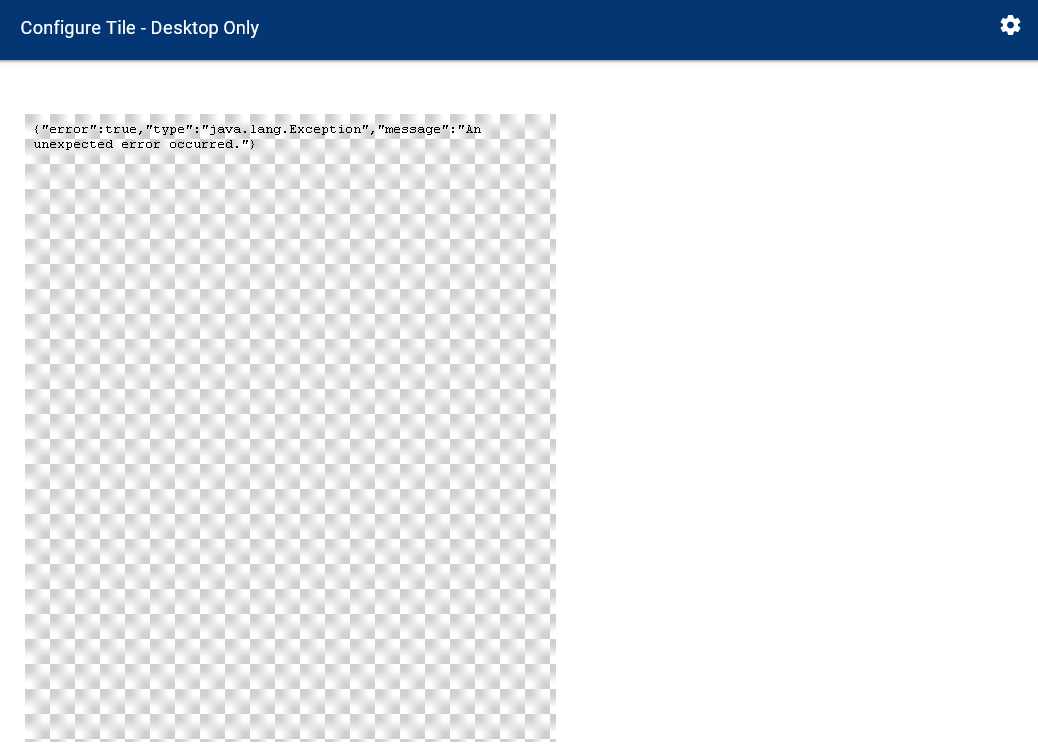
The log is showing:
app:16102021-03-12 07:09:39.996 pm errorjava.lang.IllegalArgumentException: The JSON input text should neither be null nor empty. on line 1522 (getGraph)
All my settings look correct, any ideas?
Oh….crud. I uploaded something I should not have. The new Weather Tile is coming. Let me get a fix in
Don't beat yourself up. You are doing a grand job. Without your great app we wouldn't have great graphs.
1 Like
Fix is in. Just update and it should work. IF it still fails, please re-initialize OpenWeather (go into the configuration and click done). Sorry about the churn. In a few days though, you can do the following:
or

2 Likes
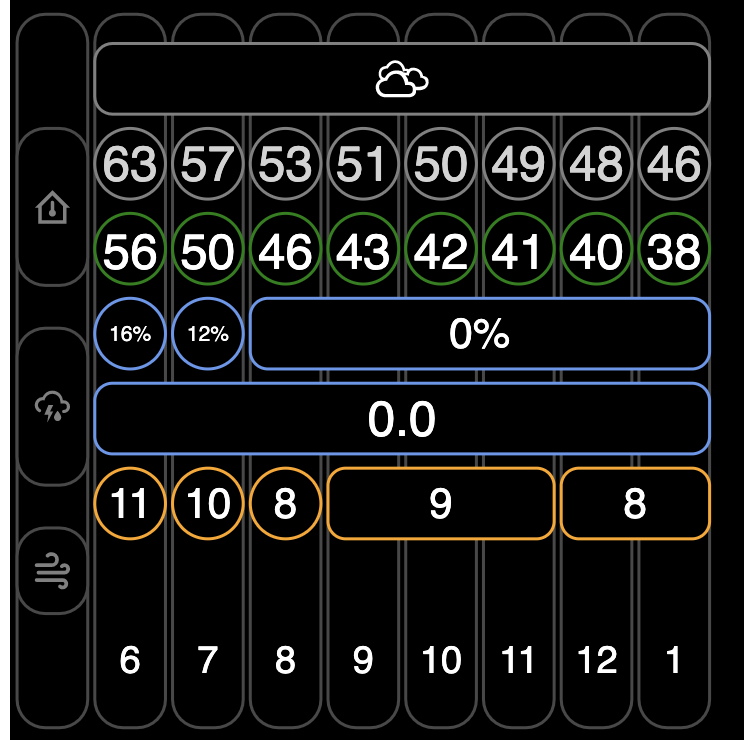
All you need are big letters B I N G O across the top.
Great, that worked. Thanks.
 Fair, but the Hourly forecast tile took weeks of work (off and on). Combining those bingo tiles was… oppressive. Now, anyone can set it up with a simple JSON file. I have one race condition that is driving me crazy to fix and I’ll release it.
Obviously, I was just being lighthearted. This is a truly amazing program. I couldn’t have imagined that this could be done on Hubitat.
1 Like
I don’t understand. Are you looking for current status? A line graph?
Hi,
This is a problem entirely of my own making, but my Hubitat hub has recently changed it's IP address. I now have it on an IP reservation so the problem will not happen again, but one of the issues I've noticed is that HubiGraphs has not updated the graph URLs to the new IP address.
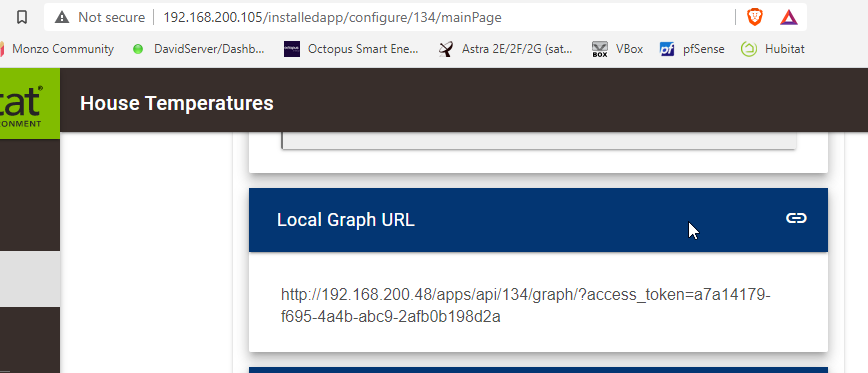
Is there a way to update them so the graphs work again without losing the history / LTS stored data?
Thanks
David
I cannot give a definitive answer but what happens if you disable and re-enable the API at the bottom of that page.
Also you are showing your hub access token in the screenshot above. You might want to blank that out.
Should the “Estimated Storage Expense” information be shown for all selected attributes?
The first two below aren’t showing anything:
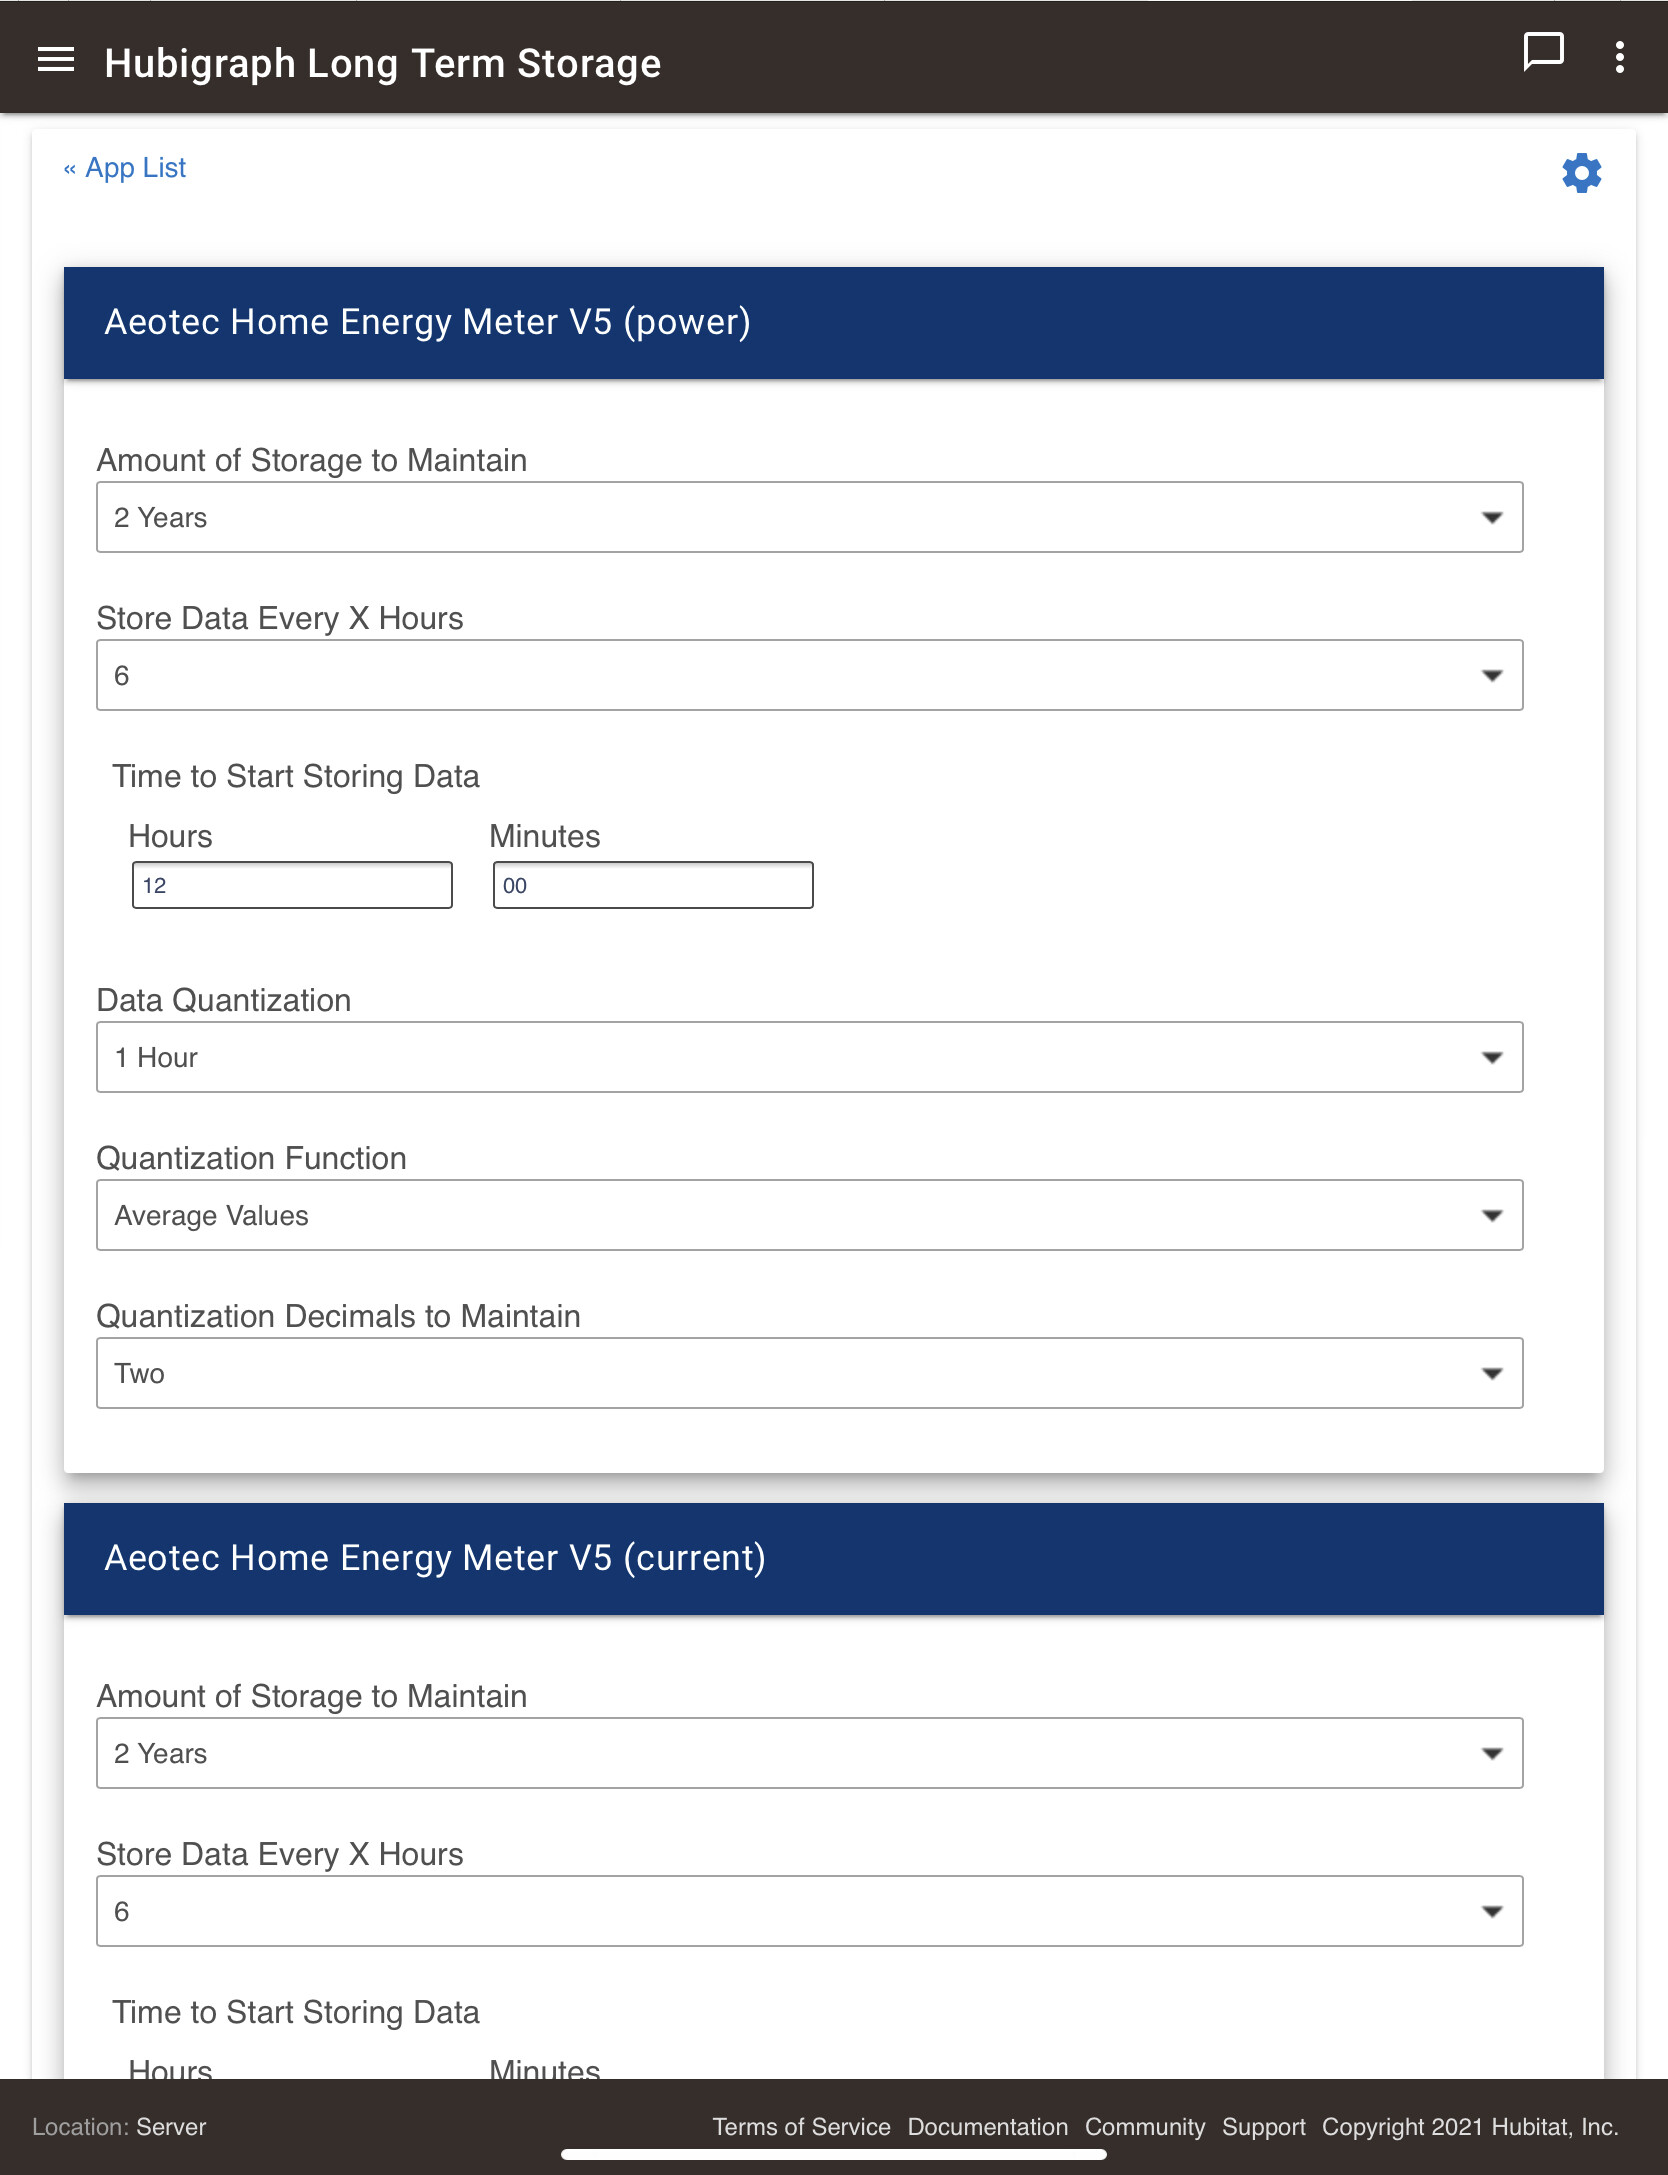
The other two are showing as expected:
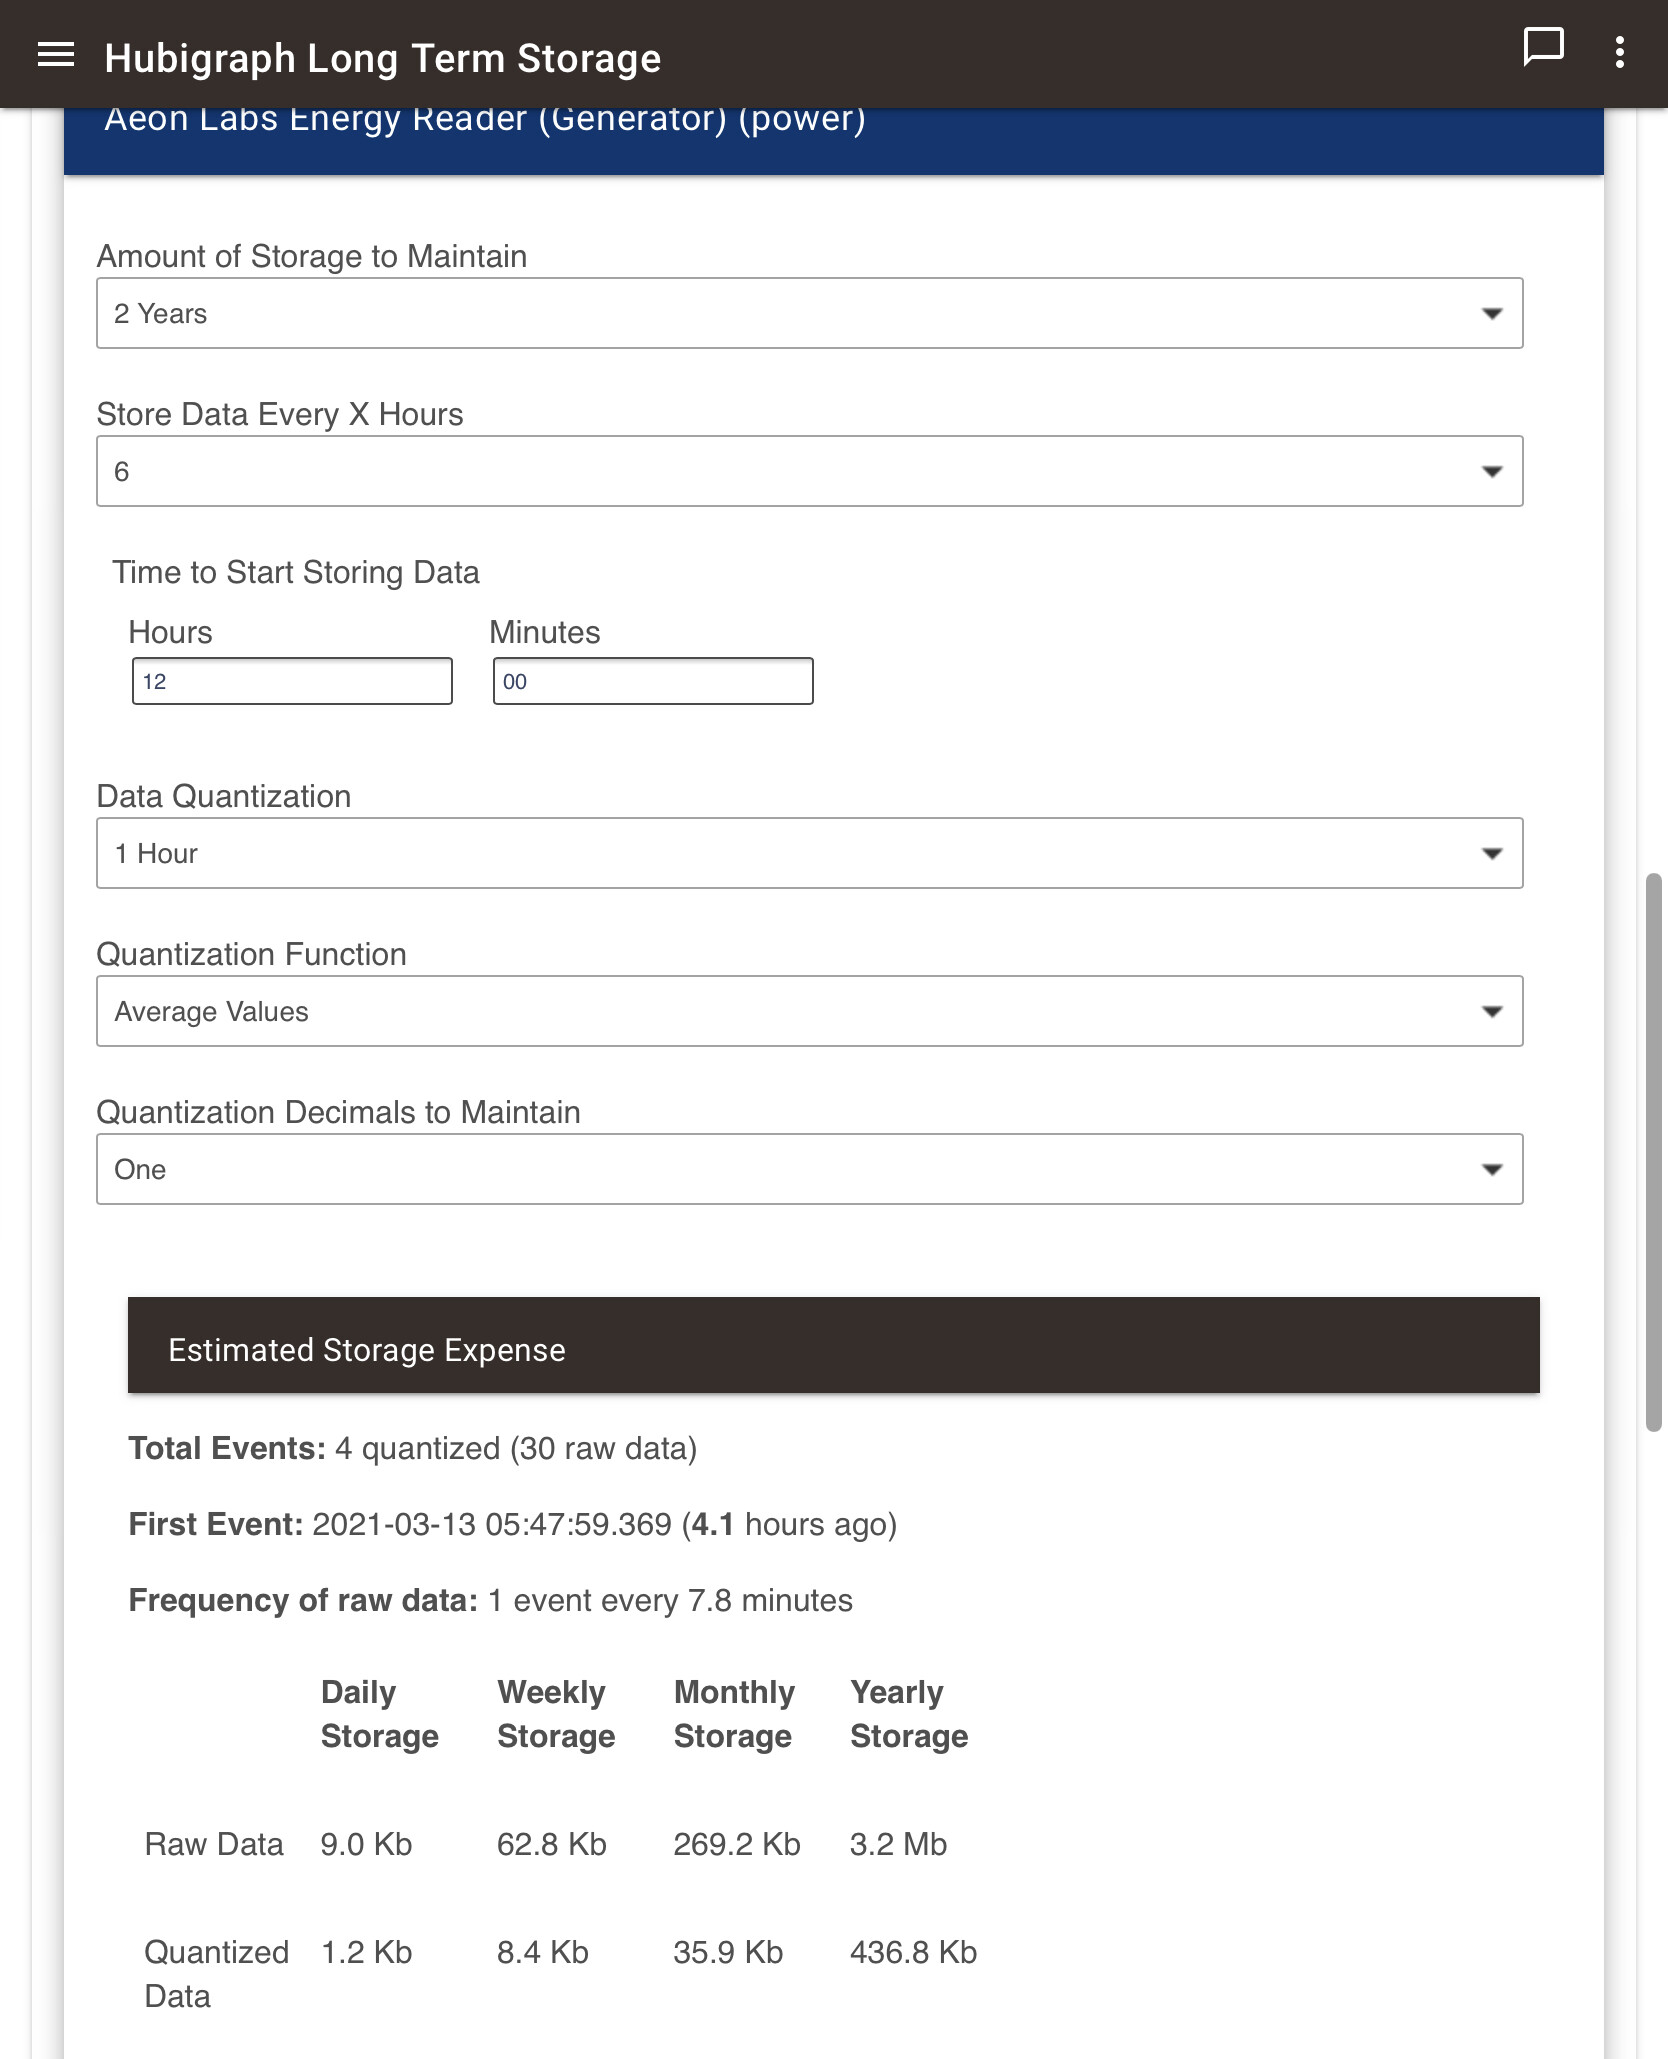
Also, during my initial setup, I added a lot of devices and attributes (I would estimate over 50 attributes?). The app crashed while I was in the middle of configuring their storage. The message recommended to check the logs, but there was nothing related in it. Is there a limit to the number of attributes that can be stored?
@Sebastien; yes, they should all show estimates. Nothing in the logs? Strange. Also, are you sure data exists for those? That is the one identified issue I need to address.
Seriously though, 50 attributes? Don’t know why it crashed, but still…. Also, I am planning to allow multiple LTS instances, so that might help in your case…
1 Like
That must be the issue! There should have been data, but I checked and only found 6 events... I’ll need to figure out what the issue is... I suspect it is disconnected...
Hehe... I was looking to see if I could map the power usage of a bunch of power monitoring plugs, so included daily consumption, power and total... with the intent to adjust later on as necessary.

