Everything looks right; LTS just hasn’t had time to fill in yet. Give it a few days and the graph will fill everything in.
2 Likes
Update on progress: I now haves child app done for HubiGraph Long Term Storage. Features:
- Allows the user to select devices and attributes
- Allows the user to choose update time, frequency of update, and quantization method
- Allows the user to see an estimate of the amount of storage needed. (Remember, file storage is limited to 1 GB).
- Stores the data in file storage (NOT state data).
Once I get Time Graph converted to this new paradigm, I will release it for beta testing.
5 Likes
Set power to left axis and current to the right axis. This will allow both to scale properly
2 Likes
So have been playing with Hubigraph and have several gauges and charts set up and working nicely. Love the App. However I have an issue with the Time Line and Time graph not using same axis scaling. There is an offset between the two time axis. I could not figure out why they were not staying in sync and then I changed my background colour and realized that there is a label at the front of the time line chart. If this was removed then the offset would disappear and they would align. Is there a way to do this?
Thanks
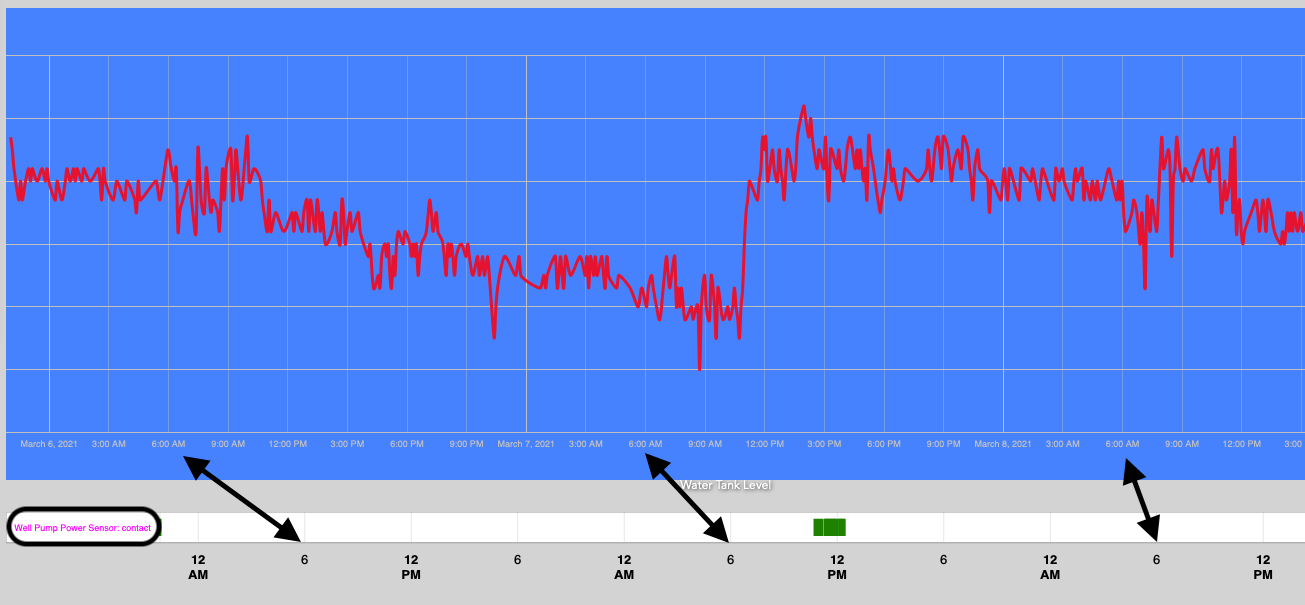
Just for reference the application here is to correlate pump activity (Time Line) with water level . One is a contact closure while the other is an analog level. My first impulse was to put them both on the same graph but I ran into issues with that as they are two different kinds of devices, so I separated them. (Time Graph)
.
If I select Stepped for plot type I don’t appear to have a section for handling missing values. Is this the expected behaviour? Thanks.
Looks like you don’t have enough history (default is 30 values for State).
I can look after I get the new Long Term storage stuff done. I am actually looking at rewriting the Time Line Code….
Not intended; easy fix. I will work it after the next update
1 Like
That’s great, thanks
LONG TERM STORAGE RELEASE
All, I have a BETA uploaded for a new Long Term Storage option. Here are some points to remember:
- Currently it is only supported by Time Graphs
- After enough people report success I plan to rewrite and add it to Time Lines
- I have tried to minimize impact but it may make you lose all your current LTS data
- If this build breaks your graphs and you have to rebuild, I am sorry.
- Using the new LTS paradigm allows you save the data to local storage in human readable format
- It is SLOW(er than I would like). Due to the need to use httpPost and httpGet to store/recall the files, it can take 3-4 seconds per device/attribute to recall data. Sorry, until we have an actual file save/recall groovy api, you are stuck.
- I have not yet built all the tools I want (file cleanup, etc). You are free to ask for more features, but no guarantee.
- It is beta software. I have run it for a week to get rid of as many bugs as I can, but...
- Right now it only supports Quantization of NUMERIC data. Stay tuned.
- It is beta software, if you do not understand that term, walk away
- DONT CRAZY. The Hubitat Developers have graciously made 1 GB of local file storage available. The data is stored in text format. I have spent alot of time to make sure the user understands if they save a years worth of data at full-rate you can really eat up data. Also, I have tested downloading files up to 1 MB. I have no idea what bigger files will do.
Okay, with all that in mind.
INSTRUCTIONS
- Under the Hubitat main App, there is a new selection: Setup Long Term Storage
- Put in your hub login information
- Select your devices
- Select the attributes you want to save
- You will see a screen like this for each sensor/attribute

- Choose the amount of storage to maintain
- Store data every X hours: Lets you choose how often to "store" data.
- Time to start: This resets every day
- Data Quantization: You DO NOT need to store ALL the data
- Quantization Function: Choose which function to use
- Decimals to maintain: This cuts down on values with an insane number of decimal places being stored
- Estimate of total storage is provided.
Good luck!
5 Likes
I just updated to the latest version and thought I would have a look at Setting up Long Term Storage.
When I click on it and then Select Device/Data it asks for my hub security login information. I haven't got that set up.
It is a condition to use security if we wish to use LTS?
Thanks.
1 Like
Hmmm. I’ll take a look. I am unsure….
Added zero authentication option
1 Like
No
1 Like
Thanks. ![]()
I updated my graphs and they look like they might work, but I won't really know for a couple weeks.
It did remove my old data back to 10 events on my Daily data, so I will need to wait and have them fill back up before I know if it works or not. The time line seems correct.
The monthly graph initially would not update to the 1 year I set it to. So I deleted it and created it again.
Now the graph extends over the 1 year data period. After I went back and looked again I noticed the slider in each graph about long term storage available, use it? I had not selected that on the monthly graph so perhaps that is why it did not update.
The monthly graphs now only shows one data point. If I look at the event data for the monthly energy sensor it shows the data for the last 7 months but it is only pulling in the last one. That is also what the long term storage event list shows, one data point.
From what I gathered from your post above this was expected.
So I will wait and see how it fills in over the next few months.
I haven't looked yet but if these files are stored on the Hub as text files, could we download, and manually update the data and then write them back?
[edit]You can edit the files. I just added an additional data point to my monthly graph. I will wait and hear from @thomas.c.howard to see if he thinks this might cause issues before I try and add any more.
1 Like
@terminal3, thanks for taking a look. Some detail, I redesigned the LTS to work so that IF you set up LTS for a device/attribute then select it in the setup for the graph, the following logic is executed;
- Check for a file
- If the file exists, get ALL the stored data (no way around that).
- Combine the file data with the current data (starting with th last data point)
4, Prune and quantize the data according to the needs of the graph.
Make sense?
Also, clever idea editing the file. There is no reason it won’t work. Just be careful of the brackets, commas and date format.
Me again @thomas.c.howard 
When going through the setup of the LTS, it defaults to 12:00 for the time to start.
I'm using a 24hr clock so I changed this to 00:00.
I have seen this in the logs.
app:29502021-03-11 21:14:58.130 errorjava.lang.RuntimeException: CronExpression '0 0 12/null ? * * *' is invalid. on line 203 (hubiForm_section)
Is this something that I should be concerned about?
Is it anything to do with using a 24hr clock.
Thanks again.
1 Like
24 hour time...? Yea, you're British huh? From your output though, that is not the problem. You did not set the "Store Data Every X Hours". I need to make it required, I will have it fixed in the next build.
However, if you could post a screen shot of what you see, on the time selector, it would be helpful. I want to make sure the 24 hour selection works correctly. Also, look at the bottom of the app for scheduled jobs.
1 Like
The flag gives it away. ![]()
When I opened LTS up again, they were all filled in OK.
Now I'm not getting the error. I have been playing though so that may have been the issue. (Highly likely).
From my basic knowledge it looks to be scheduling OK. Here's the screenshot to confirm.
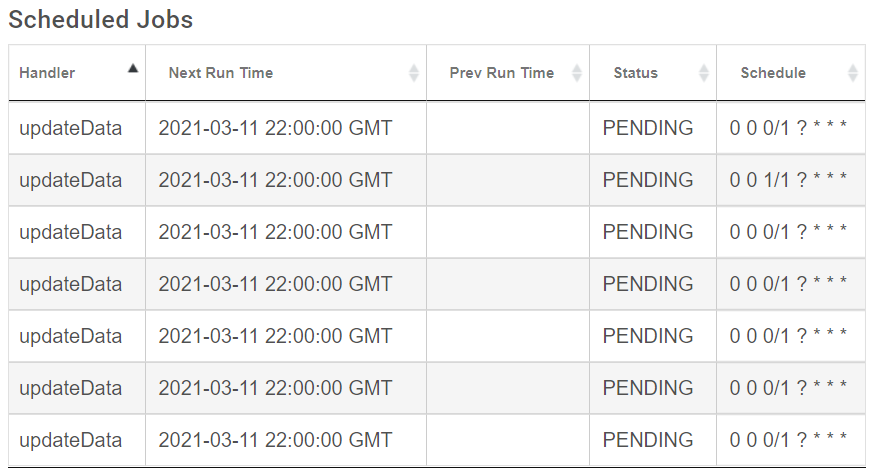
One of them is set 01:00 as can be seen above.

