Perfect!,!!
Thanks, much appreciated
Perfect!,!!
Thanks, much appreciated
Hi,
How did you make the monthly energy graph ? I did the diary graph but I can't do the monthly.
Thanks.
I just send the monthly energy data to a virtual sensor and then graph it, using a bar graph. What part do you need help with?
It's really not that useful for a monthly graph as Hubigraph only lets you graph 30 days of data. I asked about extending the amount of time awhile back but as of yet it still is just 30 days.
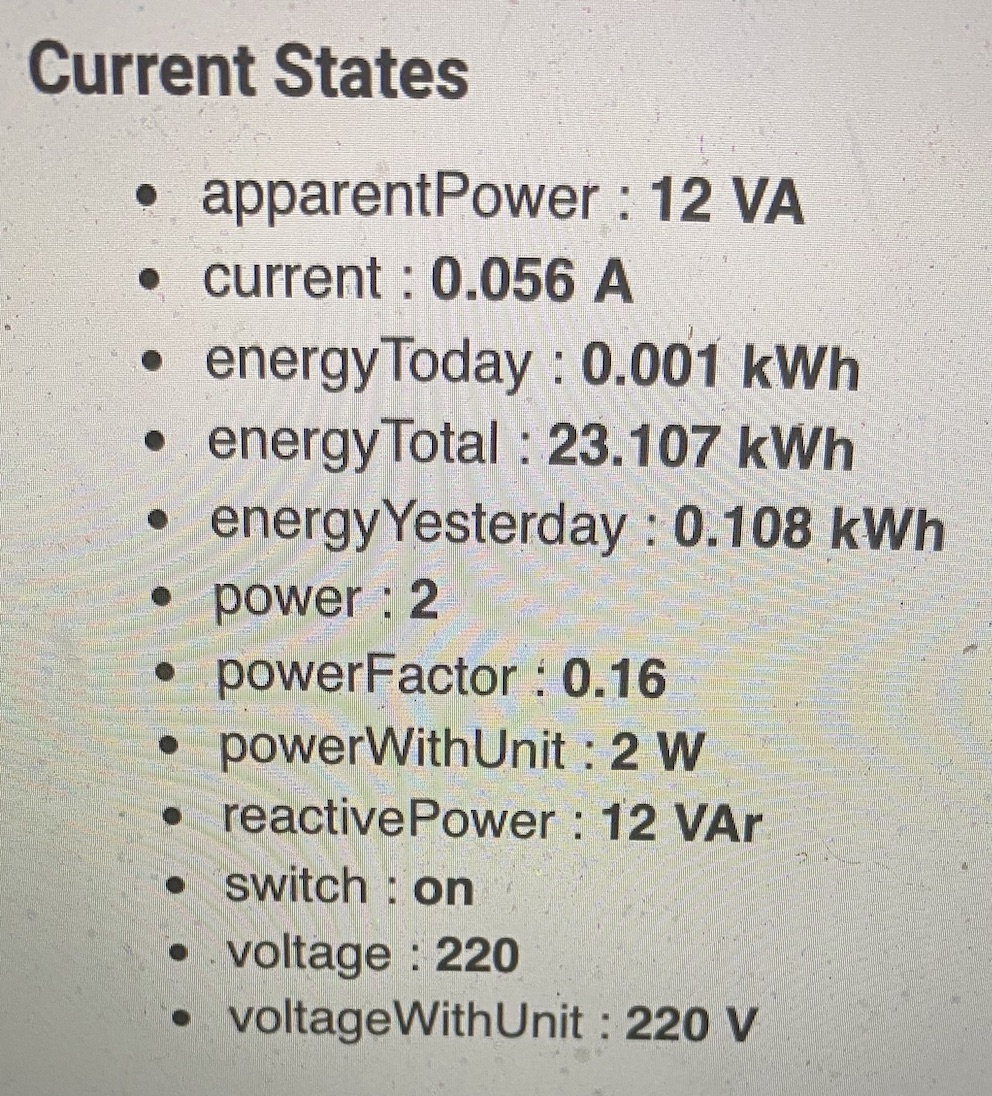
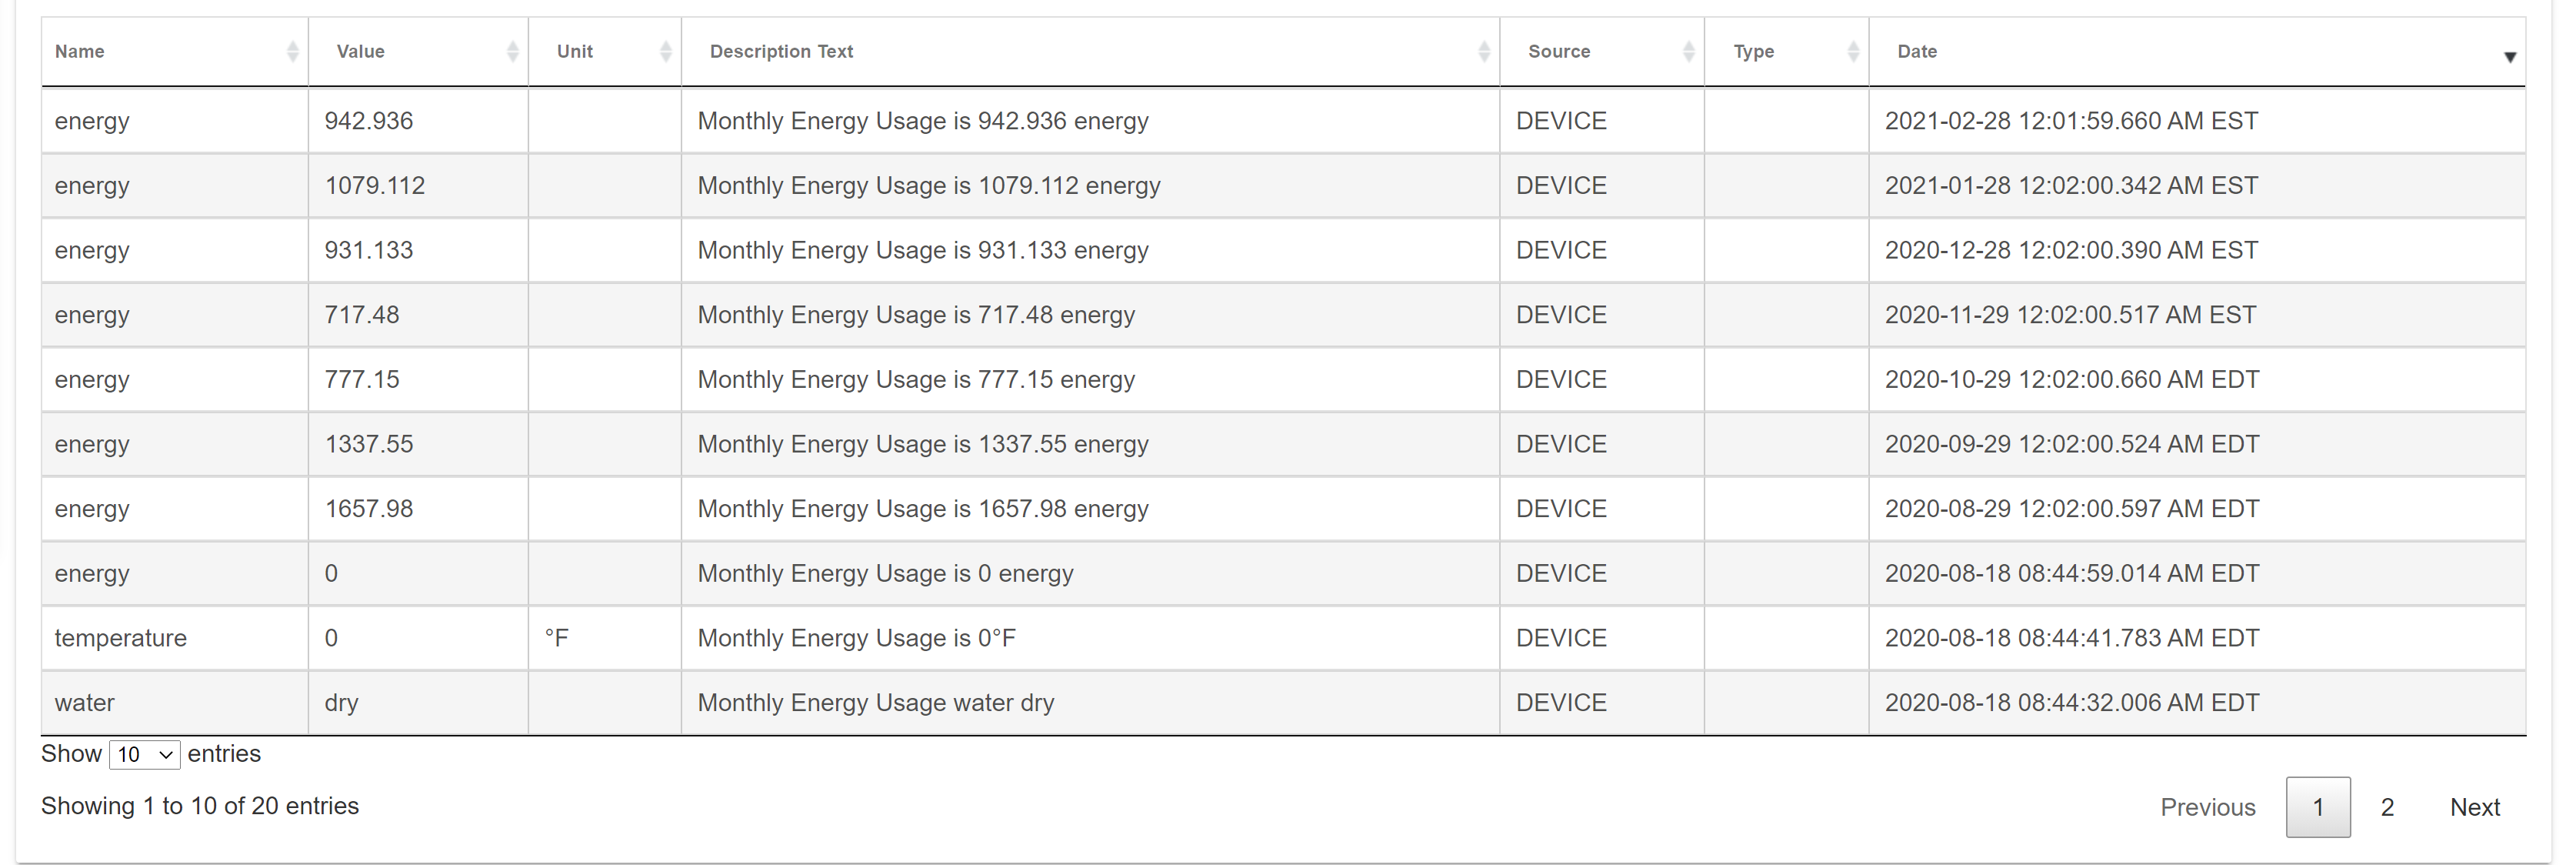
I'm getting the information from a plug that has the data below
I would also like to see the 30 day limit extended. With integration times of a day or more there's no reason to limit the charts to 30 data points or less.
If the plug keeps a running total of energy you just have to setup a rule to read the energy at the end of each month. I then reset the total and do it again the next month.
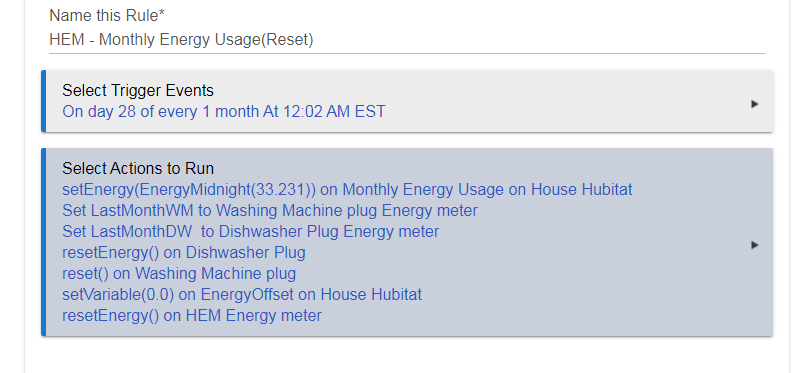
This is the rule I use. The first line of actions is sending the current energy reading to the Virtual sensor that I then plot in hubigraphs. I read the total home energy every night at midnight and save it in the global variable EnergyMidnight. That is done in a separate rule.
I also reset a couple of other plugs that read energy for the dish washer and washing machine. The last line resets my home energy meter.
Extending the time limit past 30 days is easy. My only concern is the amount of data that could expose LTS to…. I have been hoping that the Hubitat Lord would expose file writing and then it become really easy.
As an alternative, I could change LTS to only store the data it cares about (I.e. instead of storing ALL the data between two times, only store the data points; average, max, min, sum, etc).
Thoughts?
I understand the concern. In my case it's monthly energy data so only 12 points/year. I also would like to expand my daily log out to 32 days. Again only 1 point/day.
So for the applications I plan to use it in I wouldn't think it would be a problem. I guess a warning is the only thing you could do.
@terminal3, since you have been so patient, I did a quick update to allow graphing of UP TO TWO YEARS of data. The power is yours. I will caveat this with, IF YOU TRY TO BUILD A GRAPH WITH 200,000+ points, it WILL LOCK UP YOU HUB (even if there is no data). Everyone be careful to read the WARNINGS. You need to choose your TIME SPAN and INTEGRATION TIME carefully.
Also, LTS has an "Indefinite" option. You CAN save ALOT of data. I would suggest quantizing the data (like @terminal3 does) until I add the options to LTS.
Good luck....
Awesome. I just updated I will let you know how it goes.
Thanks for doing this. 
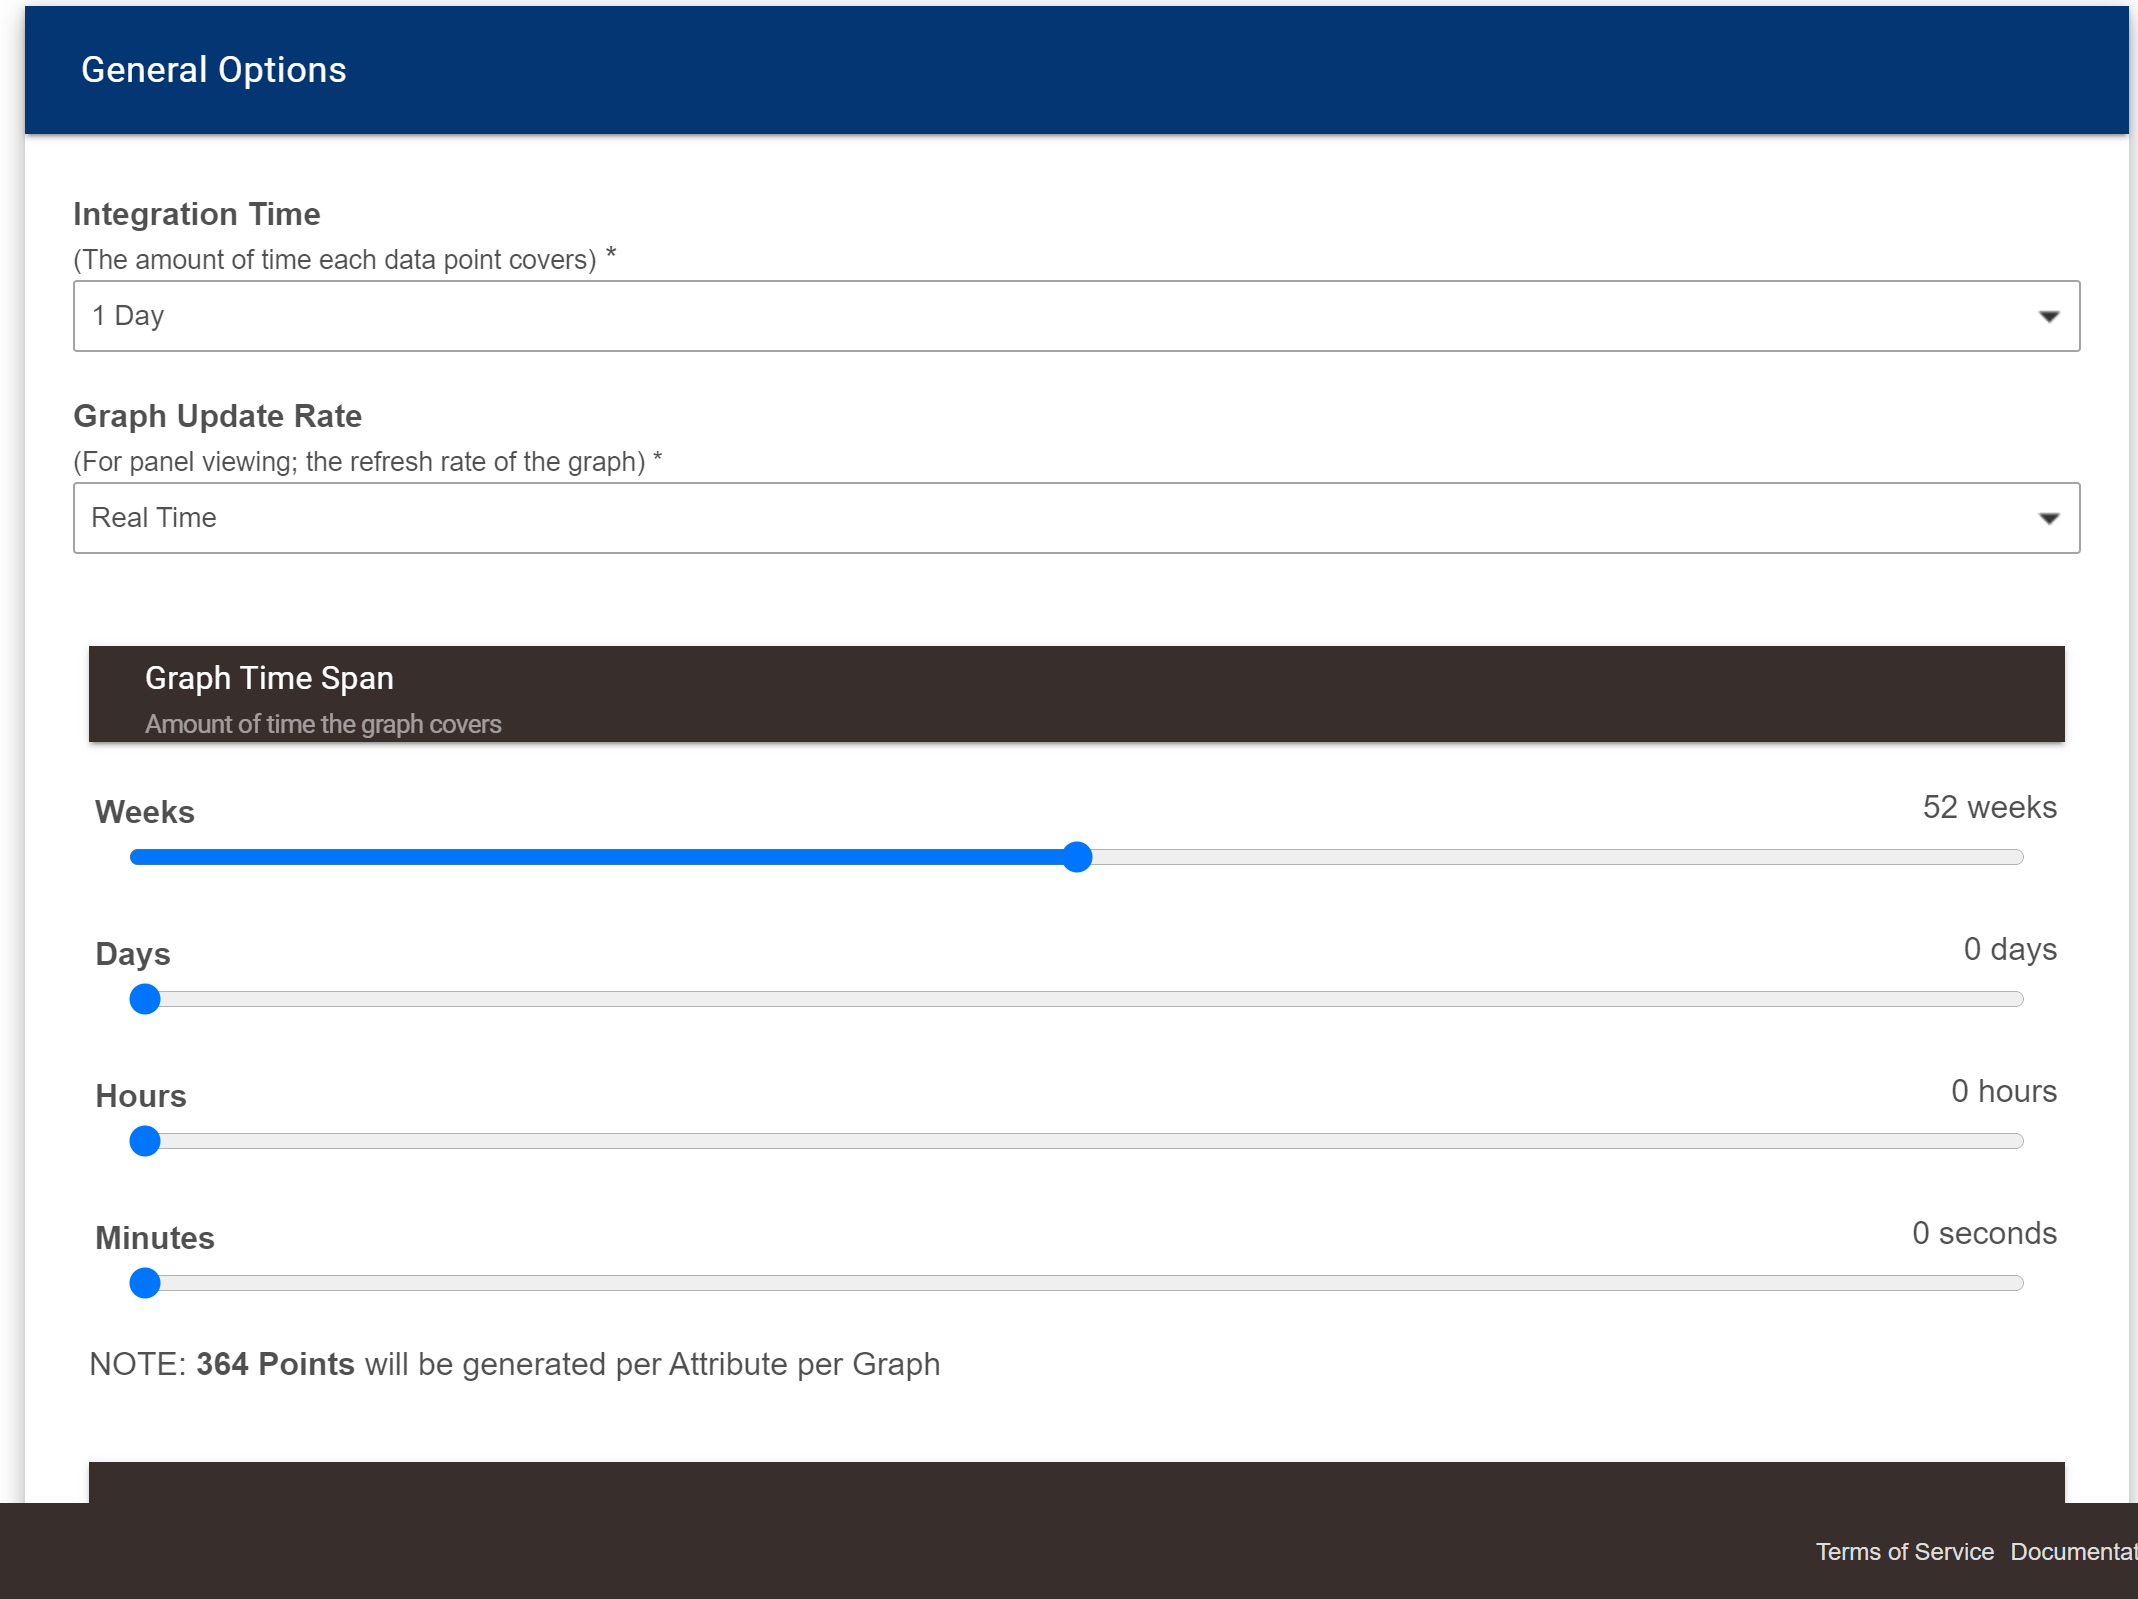
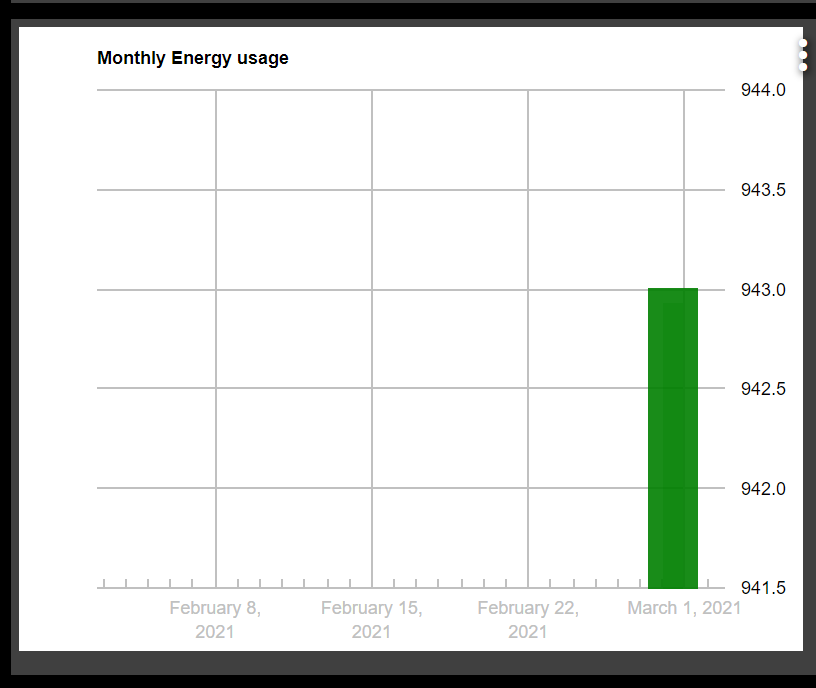
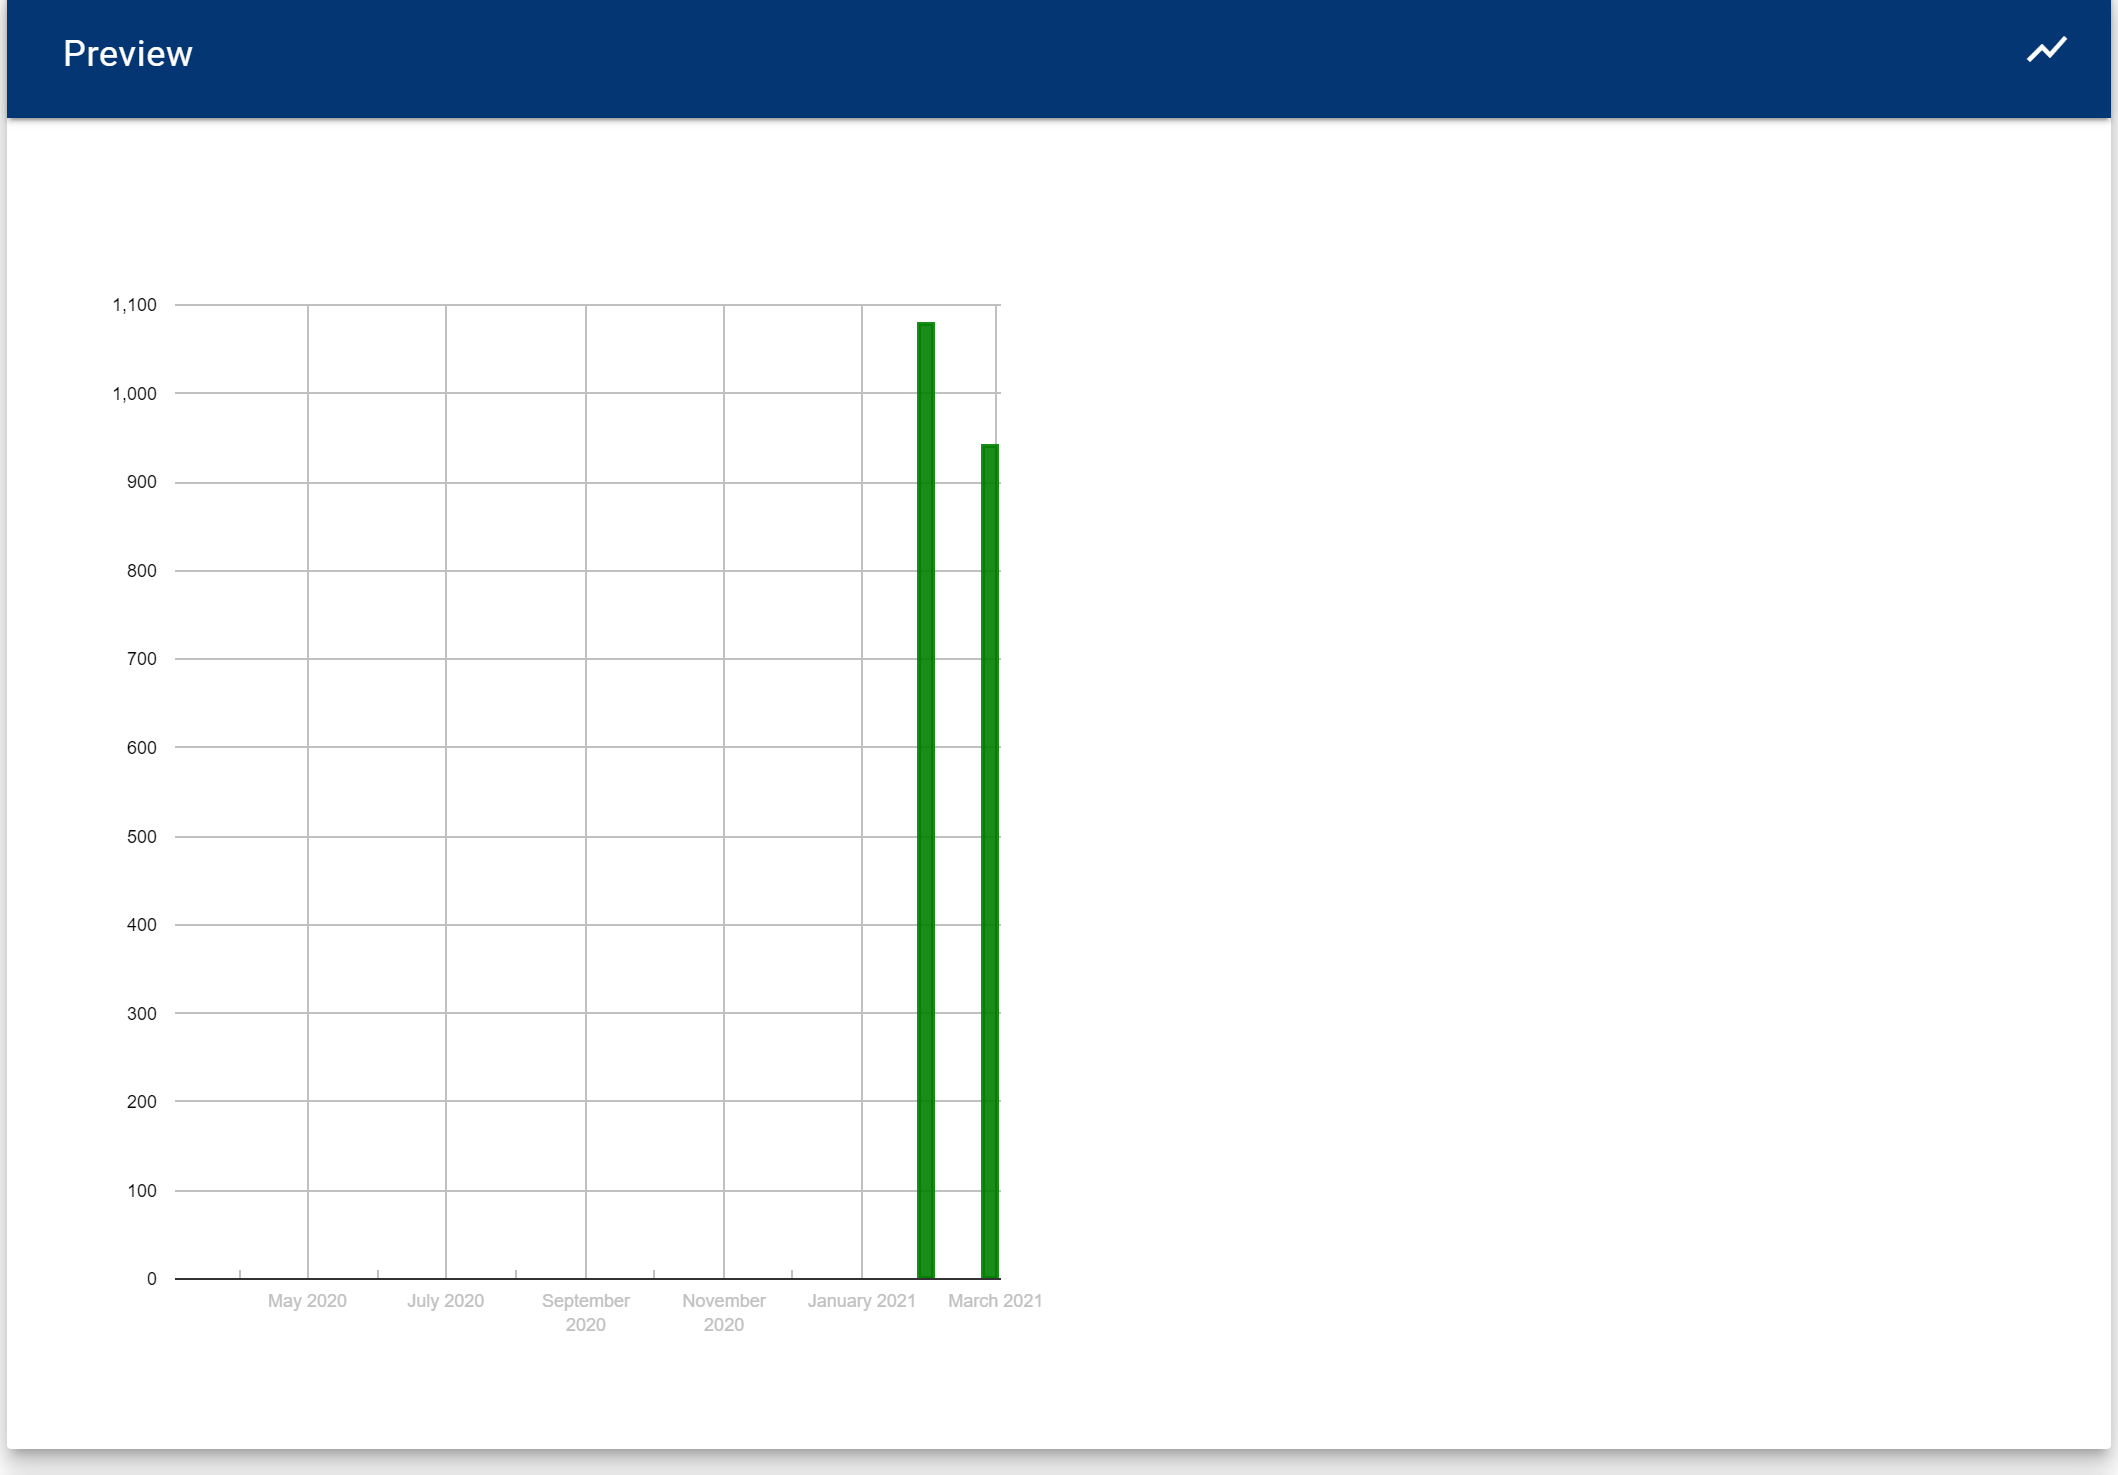
@thomas.c.howard, Just updated my monthly energy graph data to 52 weeks but it still only shows a month. I am graphing energy from a virtual omni sensor, currently it only has 8 data points. My graph only shows one, the latest from Feb 28th.
Setup:
Graph:
The data I have collected since setting it up in August:
I’ll take a look. Try a brand new graph? Are you using LTS?
I am using LTS. I will see if a new graph works.
Thanks
[edit] I created a new graph and the graph horizontal access is now a full year but it only shows 2 data points. I am using the same sensor.
I'm seeing the same thing. I changed two existing graphs from 30 days to 9 weeks. One of them worked fine, the other one didn't change.
@pfmiller, @terminal3 - I think I found the issue. I am using the statesSince call (it tends to be MUCH faster). Apparently there is a "time limit" as well as a number of "states". Frustrating. I will need to go back to events between... Give me a day to fix it
@terminal3 (and everyone else),
I could be wrong, but experimentation seems to point to a time limit for EVENT and STATE recall from the database. It seems to be somewhere around 2-3 weeks. Instead of complaining, I am thinking of enhancing Long Term Storage (LTS) for HubiGraphs. Features I think I can add:
Thoughts? Other features as I plan?
I think it would be great to be able to store data in a file. For me Hubigraphs is pretty close to everything I need. Only the ability to store my long term energy data is missing.
So any of the features listed above would be gravy.
I have generalized file storage and recall working (based heavily on HPM by @dman2306). Just need to add the options and integrate into HubiGraphs. I hope to have something this weekend.
Too many projects! I have HubiWidgets almost ready too. It has the JSON Configured Weather app working…Ugh.
Thanks for your help, I will try it. And waiting for the new option of up to two years of data.
It is not centered because the graph has no data. This is an issue I am investigating that could be fixed with long term storage…. Only option there is to change the timespan. As for the axis thickness, I can look but I believe Google Charts does not let on change the axis stroke, only the color…
Download the Hubitat app