Can you ask your wife about multiple lines on a single graph? Is she subject to bribes? 
2 Likes
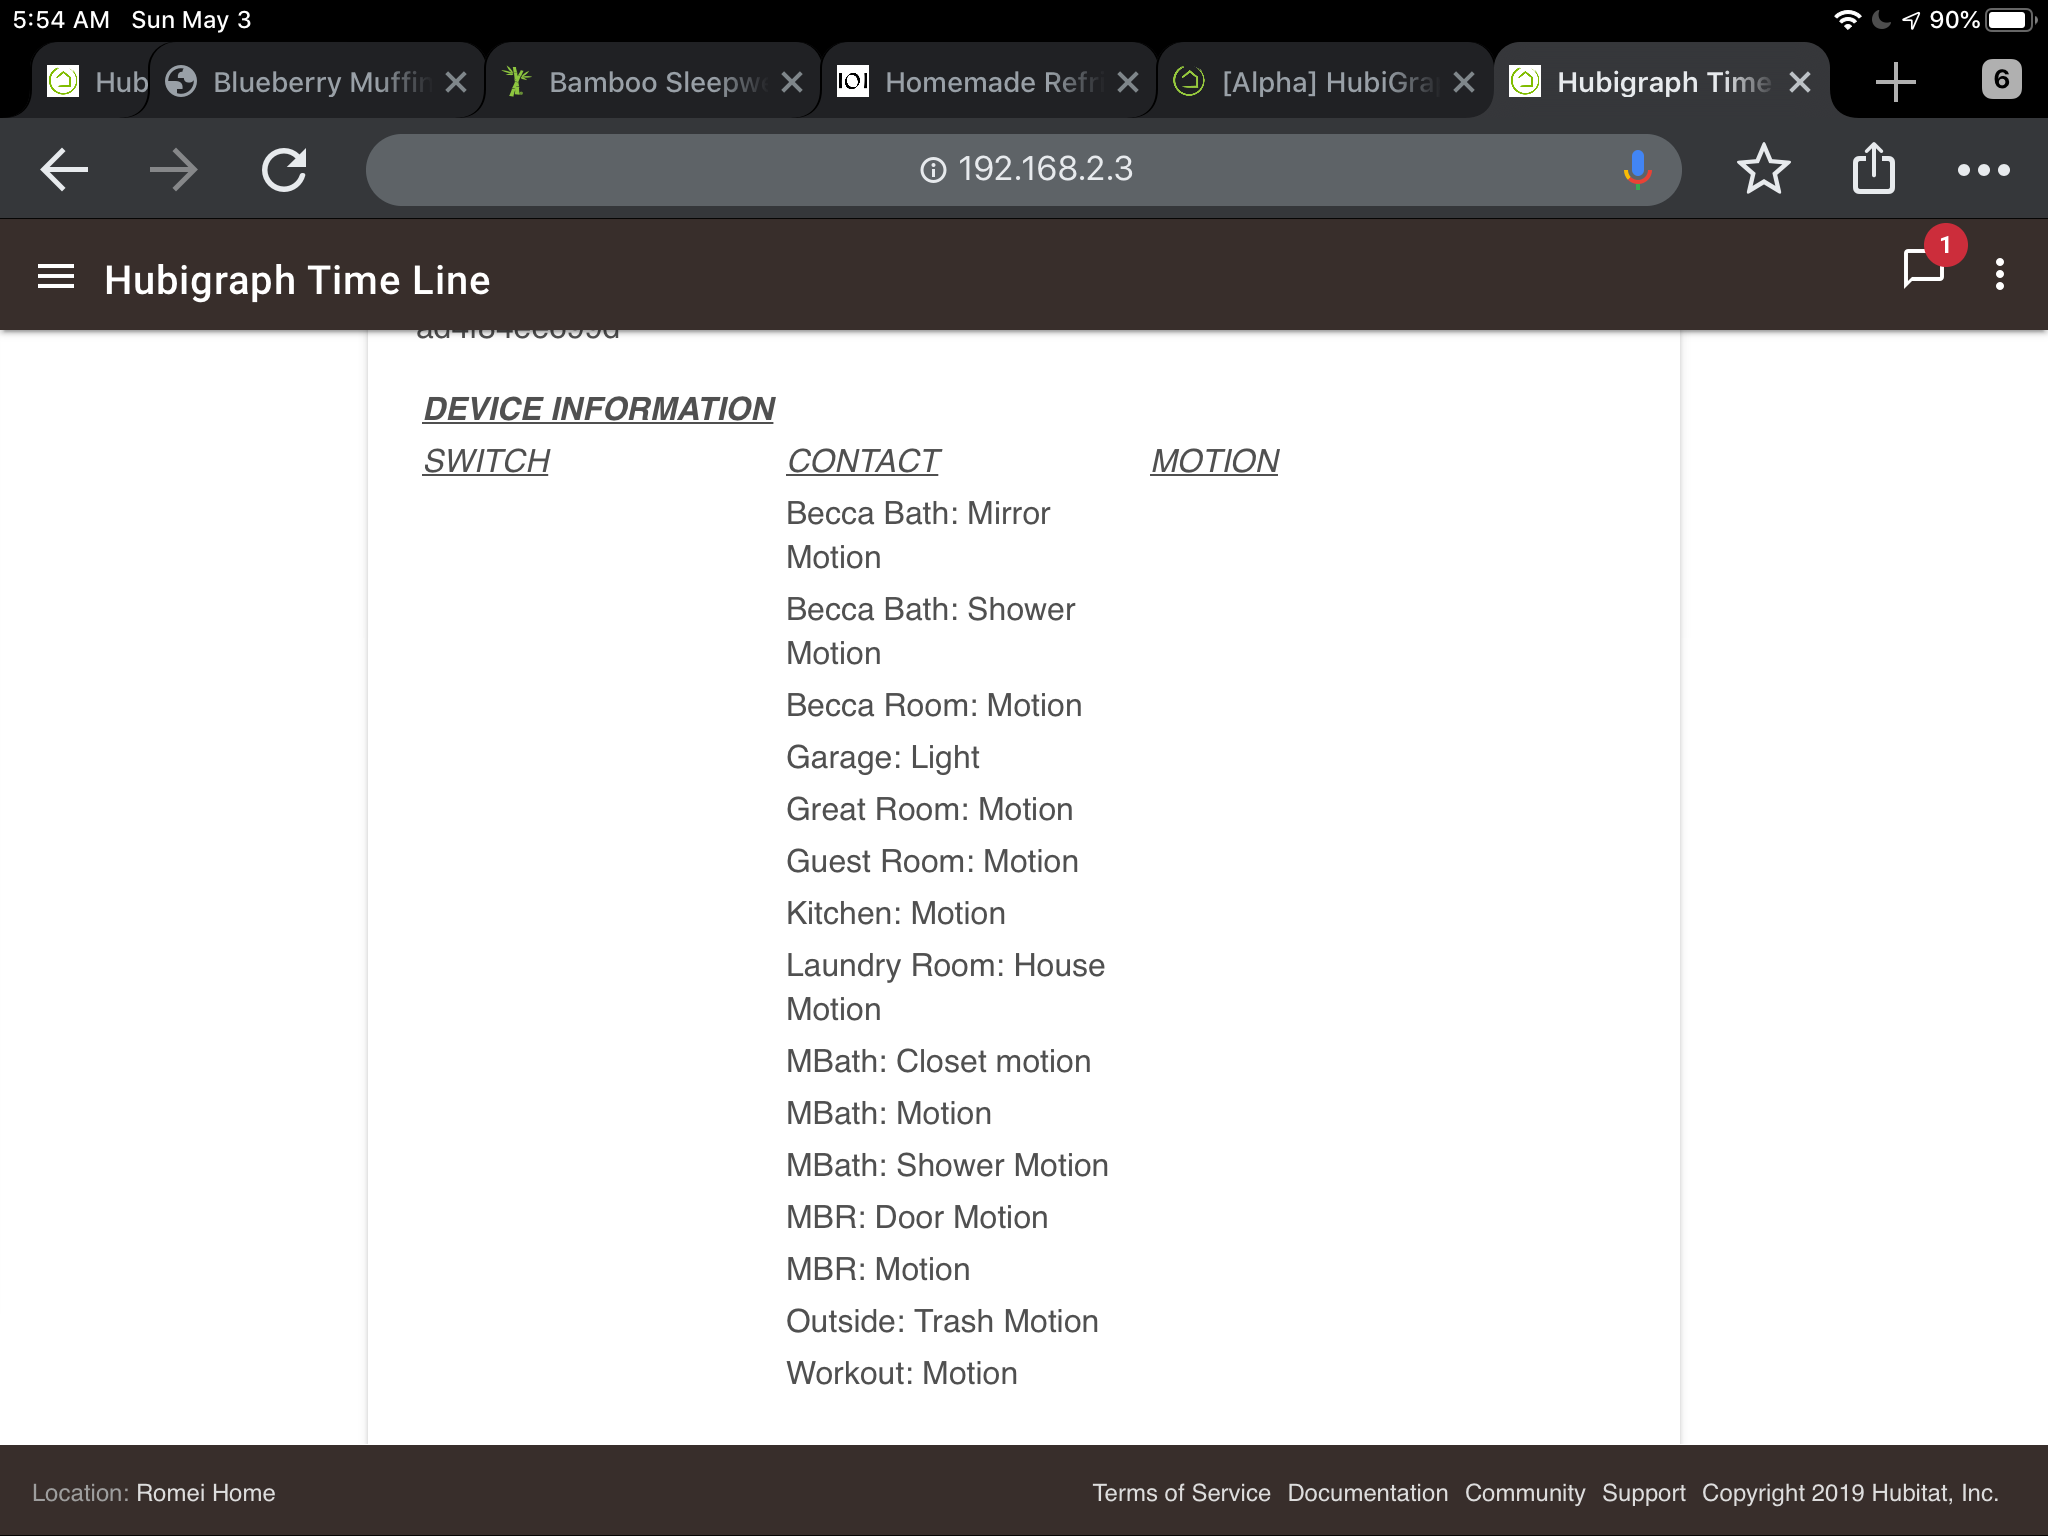
@thomas.c.howard just wondering how the app limits the available devices to choose from.
I have a couple virtual devices that I would think should be visible in the list to choose for graphing devices, for example with temperature or humidity capabilities. But they don’t appear as devices I can select.
Thanks!
The lineGraph allows selection based on the sensor capability. I have it on the list to
- Select multiple sensors for the lineGraph
- Allow different capabilities
For Timelines (besides obvious cleanup), I currently have on the list to:
- Create a "block view" which divides up a single device over multiple rows.
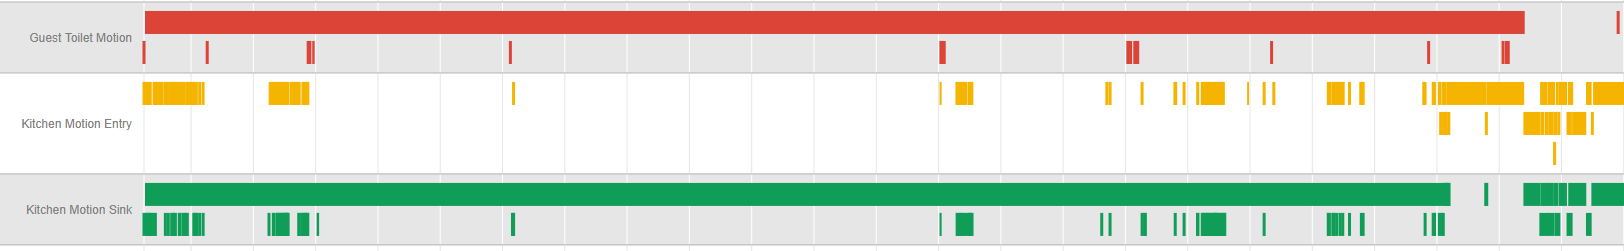
- Fix for "missed events". I.e. a motion device that register inactive and looks like a REALLY long event.
- Allows thresholding for numerical devices. Example, show me whenever the temperature got above 60 degrees.
1 Like
@nutcracker Fixed, updated to 0.21. This was caused because you (somehow) had "No Selection" for your update rate. It should have defaulted to 5 minutes. I have protected against it.
1 Like
Thanks but looks like a bad build... doesn't compile (source has two versions concatenated).
Thanks. I hate GITHUB update functionality... Fixed (maybe)
That worked, I have selected 5 motion sensors, but when I create the tile it gives me a scroll bar on the far right which has nothing below to scroll to just a blank space?
Yes; I noticed that. I will be looking into that this week.
2 Likes
Thanks. Working now. Keep the feature updates coming!
Working great now. Thank you!
Thank you for making this app! I just started working with it (installed everything about an hour ago so think it is all current. It seem fine on Android
Firefox is cutting off just a bit of the bottom

But iOS 12.4.5 is the big issue (this does not happen on my other iPad iOS 13.3.1)
@gregish : Updated Timelines to 0.22. Good news: gets rid of the scrollbar. Bad news, Google Charts does not support changing the horizontal axis font size. My son is researching a fix.
2 Likes
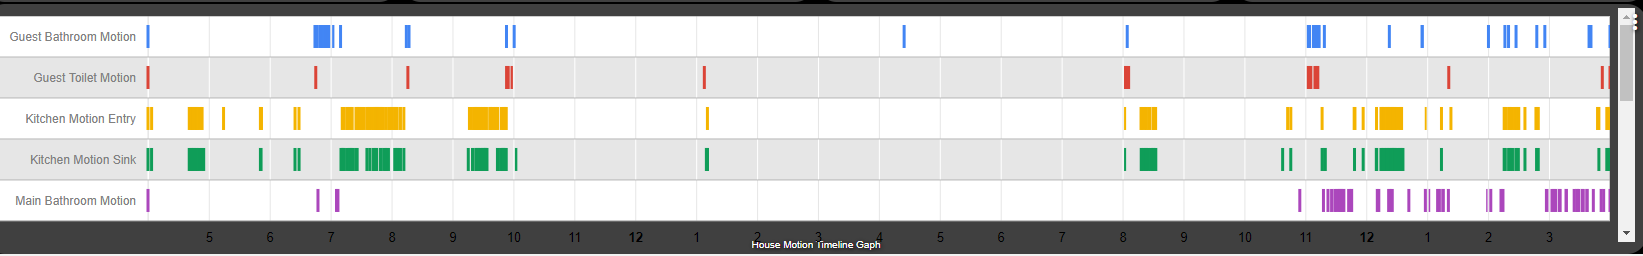
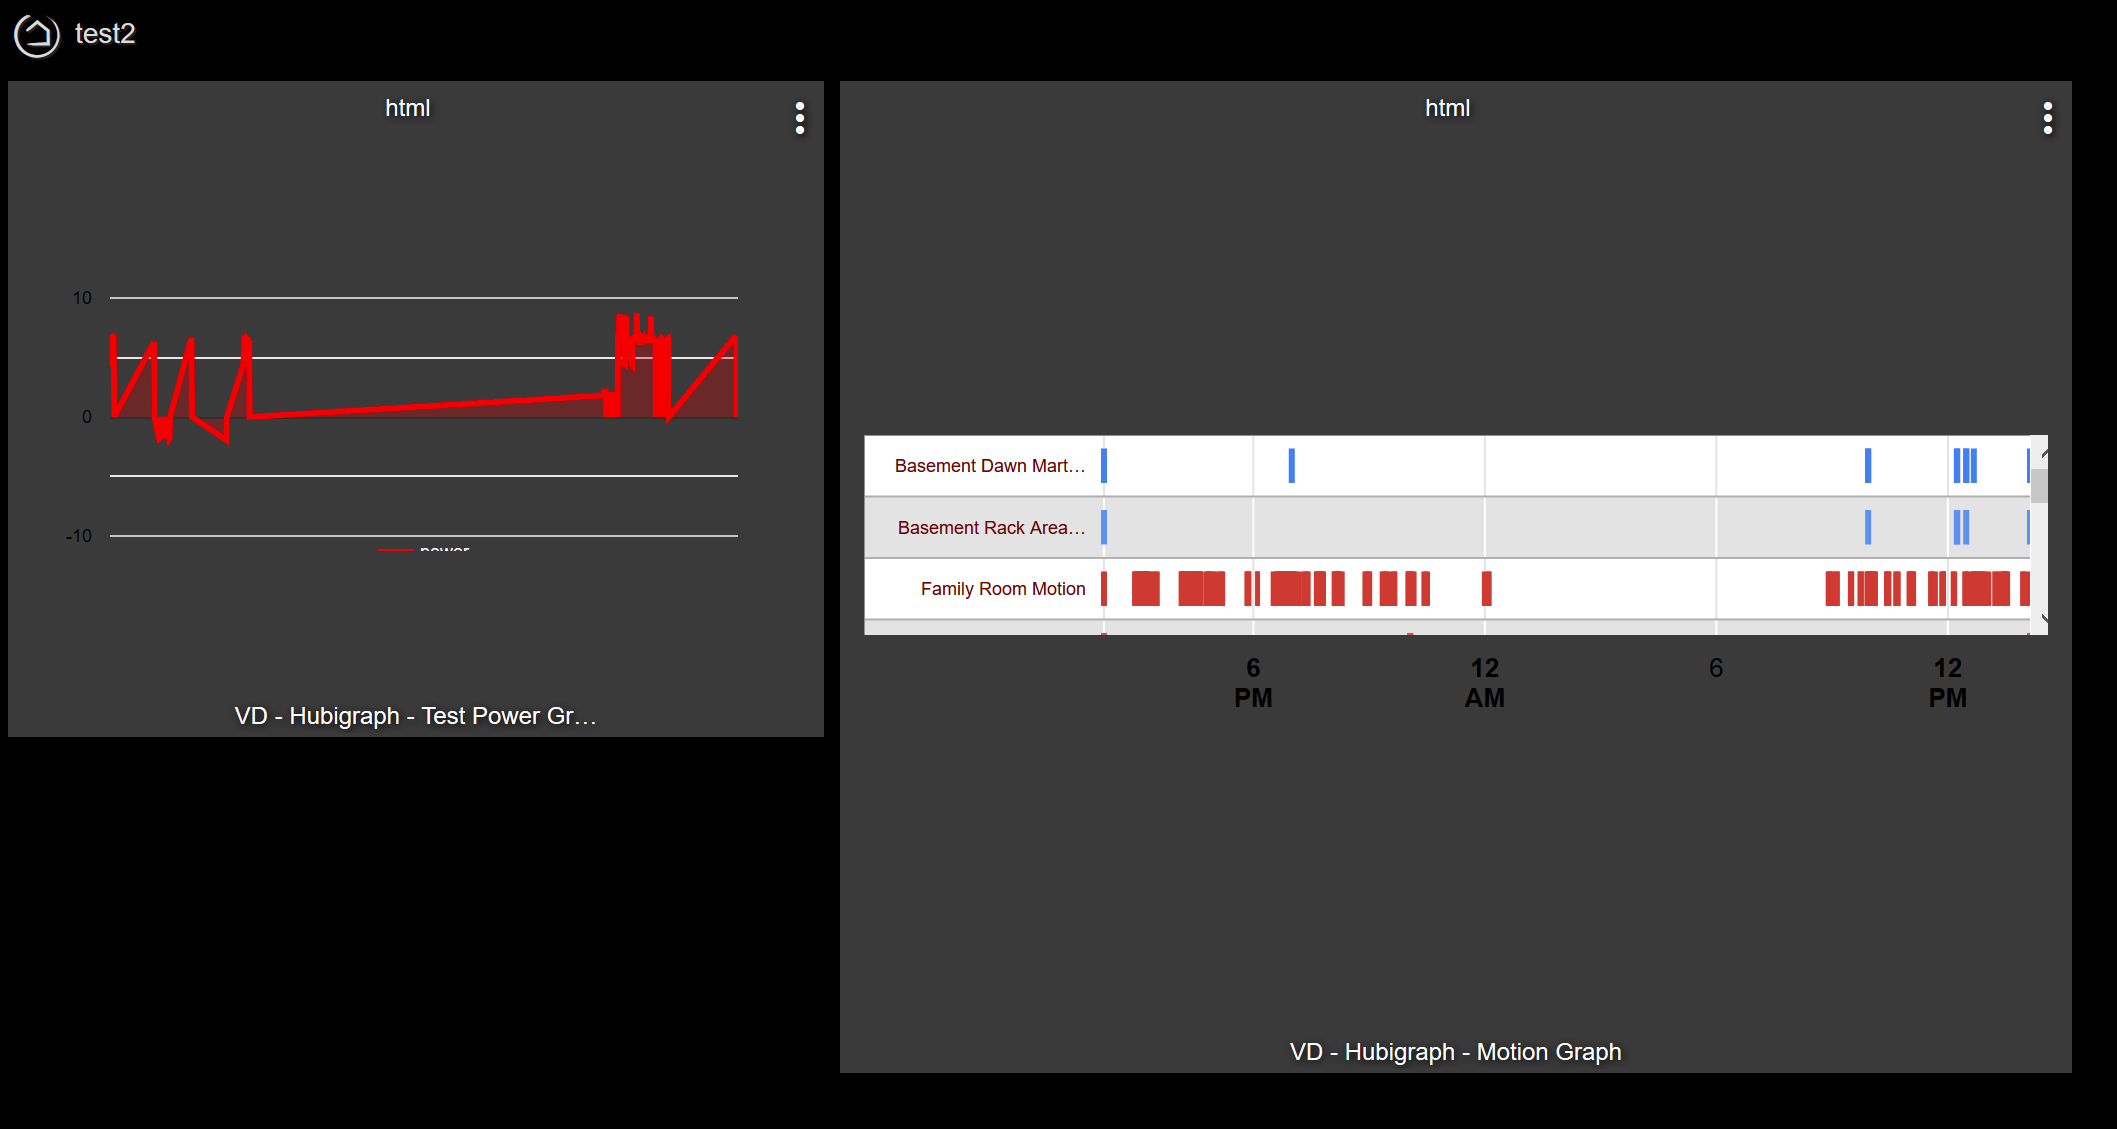
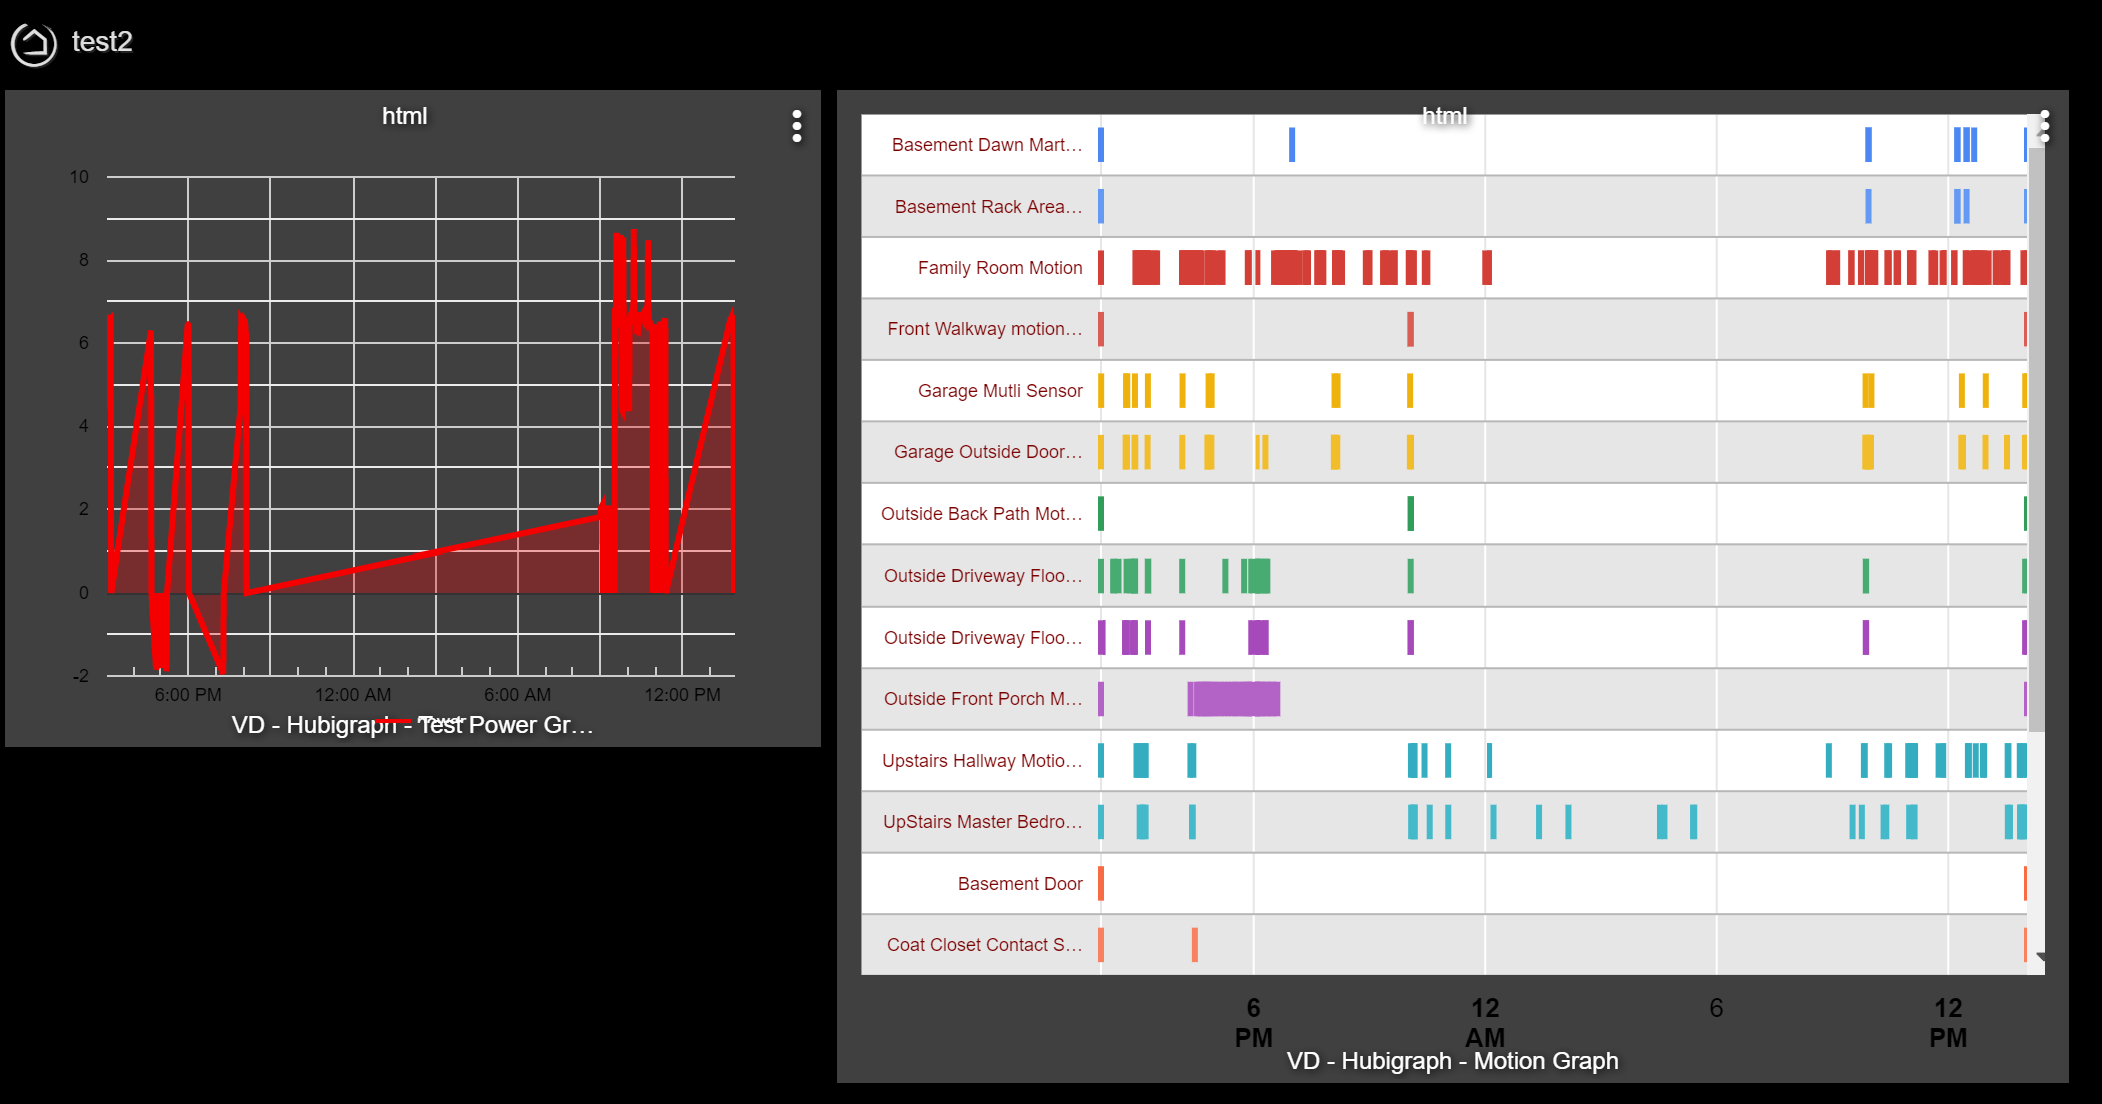
Thanks that got rid of the scroll bar, I wanted to ask? I have selected 5 motion sensors for the timeline graph, what I wanted to ask is why do some of them have 3 lines of data? I did see you working on the missed events as some of mine have a motion logged for 22 hours.
You are talking about the Shoo Fly Shoo name ?? It refers to a bug/fly that won't go away and sits there buzzing around... You FAQ swats that fly.
+1 for this ! We could cut down the need for multi graphs.
@greglsh, I need to work on the event logic to handle some "strange" situations that can occur with various devices; double or triple triggers, mode change not registering, hub missing an event. This manifests as overlapping events as shown in your graph above. Now that version 0.22 is looking more stable, I am going to review the code and try to bullet-proof the logic a little better.
2 Likes
Thanks, I hope you don't think I am trying to be a pain (FAQ  ), but just posting what I am seeing as I set this up. Thanks again for all the hard work and time that goes into these sort of projects
Got it, thanks. By adding the plain “sensor” capability to my virtual device’s driver code, I can see it in hubigraphs now.
Thanks!
It seems firefox does not like the dynamic graph sizing. I see where you can set the size, but cannot find a combo that will work. Any thoughts on what sizes might work in a manual setting?
FF
Chrome
EDIT: If I manually set the size, it also stops the older iPad from running off the edge. I just can't seem to find the right combo to make it fit.

