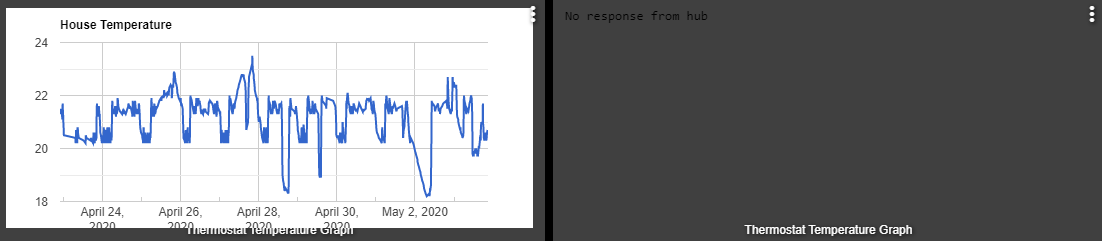
This is such a cool project. I do hope you're able to find the issues and squash them all. Unfortunately, I'm going to have to disable it for now. Two different hubs, one with absolutely nothing but HubConnect Server and HubiGraph on it, and still I get a lock up of the HE Web Interface and the chart stops updating too. Doesn't even display on the Dashboard. No errors to offer since I have to restore and reload the database. Glad it's working for others. Not sure why I'm the only one with this issue. Maybe it doesn't work well with noisy devices or with hub connector apps?
Bummer for sure. Have to soft reset to get back to a usable state each time unfortunately. It's been three hard lockups on two different hubs, so I'm going to have to bow out of testing for the time being. Never even got to testing Time Lines. Good luck with it. Great concept. Hope I can use future versions.
@SmartHomePrimer, thanks for giving it a shot. No promises, but my son has decided to fix the performance “problems” through websockets locally hosted. We already have a proof of concept. He’s excited, and motivated. Dangerous in a teenager
@SmartHomePrimer Done. The latest v0.3 is posted for both line/time graphs. Here's the thing. My son hijacked the same endpoint as the dashboard so now it does the processing VERY differently. Here's how it works
You follow the usual procedure.
When you click Done not a lot happens.
When you open the webpage, it can take 15-20 seconds as it downloads all the previous events from the hub. Bad, right? Well...
From that point on, the Javascript code is receiving events DIRECTLY from the websocket endpoint.
The browser receives updated data, clips "old data" and updates the graphs. This means that once the graph is loaded, THERE IS NO PERFORMANCE IMPACT ON THE HUB.
In testing, we have run 10 graphs running with a 10 ms update rate and no hub degradation.
You will notice there is a new option under Update Rate -- "Realtime". That ONLY UPDATES THE GRAPH WHEN A NEW EVENT ARRIVES. The other options will update the graph at a periodic rate.
If you update to the latest level, remember:
When you load (or refresh) the webpage, it will refresh all the data and may take 10-30 (depending on the number of data points)
If you update, you will need to rebuild all the graphs.
This update will support as many graphs as you want, but they are meant to be on a live dashboard.
My son spent his entire day proving a point (that he is smarter than me). Post any bugs, but remember my ego is fragile at this point.
Great work as usual. Can I throw another suggestion out there.
I think one of the issues is the amount of data that has to be processed. I've been using my temperature sensor and using data over a day loads fast but once I say something like the "last two weeks" it slows down as it has to process over 1000 data points.
So I started looking into how I can reduce the data points while still keeping the graph looking good. I came across something called the "Ramer-Douglas-Peucker Algorithm".
I was able to convert some java code to groovy and do some ruff tests with this algorithm with some nice results and its adjustable.
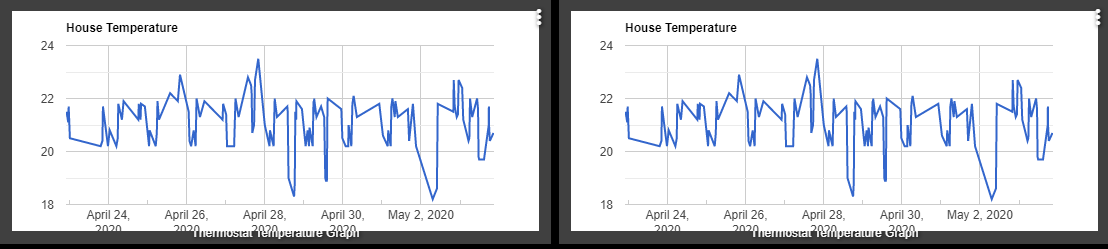
With two weeks worth of temperature data I had over 1000 data points. When I loaded this in my dashboard it was slow to load and the cloud link didn't even respond.
Note, I have two graphs as one is using local endpoints and the other is cloud so I can see the loading time differences.
As you can see they look very similar. You can adjust the algorithm to filter out more or less as well. I'm just doing some ruff tests at this point.
A power reporting device that reports data every second can have up to 86400 reports a day. I can see how this can be an issue when working with the google graphs. Thinks start to slow down with just 1000 data points.
If you are interested I can share the method I was able to get working for you to test with. Its ruff but is working.
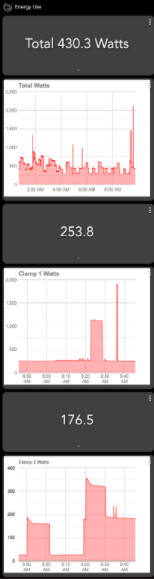
The performance improvement is immediately noticeable when working with your new child app code. I previously had reduced the update time from 5 seconds, to 1 minute to try to improve the stability. I have now set it back to REAL TIME updates. My HEM is set to update every 5 seconds anyway.
For me, the charts are loading in 5 seconds when opening the dashboard! Very nice.
I will allow this to run overnight and let you know tomorrow if I experience any issues or have any logs of value to you.
app:6882020-05-04 13:18:45.143 errorgroovy.lang.MissingMethodException: No signature of method: user_app_tchoward_Hubigraph_Line_Graph_387.eventHandler() is applicable for argument types: (com.hubitat.hub.domain.Event) values: [com.hubitat.hub.domain.Event@cbbbae] (eventHandler)
app:6882020-05-04 13:18:41.846 errorgroovy.lang.MissingMethodException: No signature of method: user_app_tchoward_Hubigraph_Line_Graph_387.eventHandler() is applicable for argument types: (com.hubitat.hub.domain.Event) values: [com.hubitat.hub.domain.Event@1e98c31] (eventHandler)
app:6882020-05-04 13:18:36.804 errorgroovy.lang.MissingMethodException: No signature of method: user_app_tchoward_Hubigraph_Line_Graph_387.eventHandler() is applicable for argument types: (com.hubitat.hub.domain.Event) values: [com.hubitat.hub.domain.Event@1b6dbd6] (eventHandler)
app:6882020-05-04 13:18:31.820 errorgroovy.lang.MissingMethodException: No signature of method: user_app_tchoward_Hubigraph_Line_Graph_387.eventHandler() is applicable for argument types: (com.hubitat.hub.domain.Event) values: [com.hubitat.hub.domain.Event@f7c99a] (eventHandler)
app:6882020-05-04 13:18:26.991 errorgroovy.lang.MissingMethodException: No signature of method: user_app_tchoward_Hubigraph_Line_Graph_387.eventHandler() is applicable for argument types: (com.hubitat.hub.domain.Event) values: [com.hubitat.hub.domain.Event@1a6bd63] (eventHandler)
That is caused by just replacing the code. The new code never subscribed to events, just uses the end points. To eliminate this, you need to reinstall the child app
@thomas.c.howard
busy setting up the graphs again with the new version, when I select my motion sensors , which also reports temperature, it no longer offers this as an attribute to graph where as the previous version did?
EDIT: I checked now and this is only happening with the 1 of my 5 motion sensors, but this one
was working with the older version?
Edit2: I went into devices, selected this device, clicked on refresh and then save device and now I
have the option for temperature again???

 It's been three hard lockups on two different hubs, so I'm going to have to bow out of testing for the time being. Never even got to testing Time Lines. Good luck with it. Great concept. Hope I can use future versions.


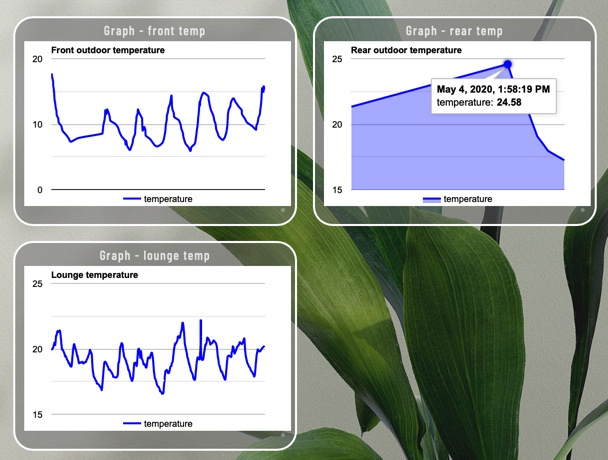
 Just transparent iframes for the graphs and it would be possible to get it to blend in even more.
