Thanks,This is awesome!

2 Likes
Granted, it's far less capable than the Sense Energy Monitor and doesn't have their beautiful UI (Kind of miss that thing), but at $85 CAD this is totally functional and a fraction of the $380 CAD the Sense was.
Thank you so much team Hubitat, @thomas.c.howard and son, @srwhite and @csteele for making this possible.
5 Likes
Looking at the github repository, you have the wrong license file (it is the GNU GPL3 license). I suggest you change that to the Apache license to match the notices in the groovy files.
Thanks for the advice
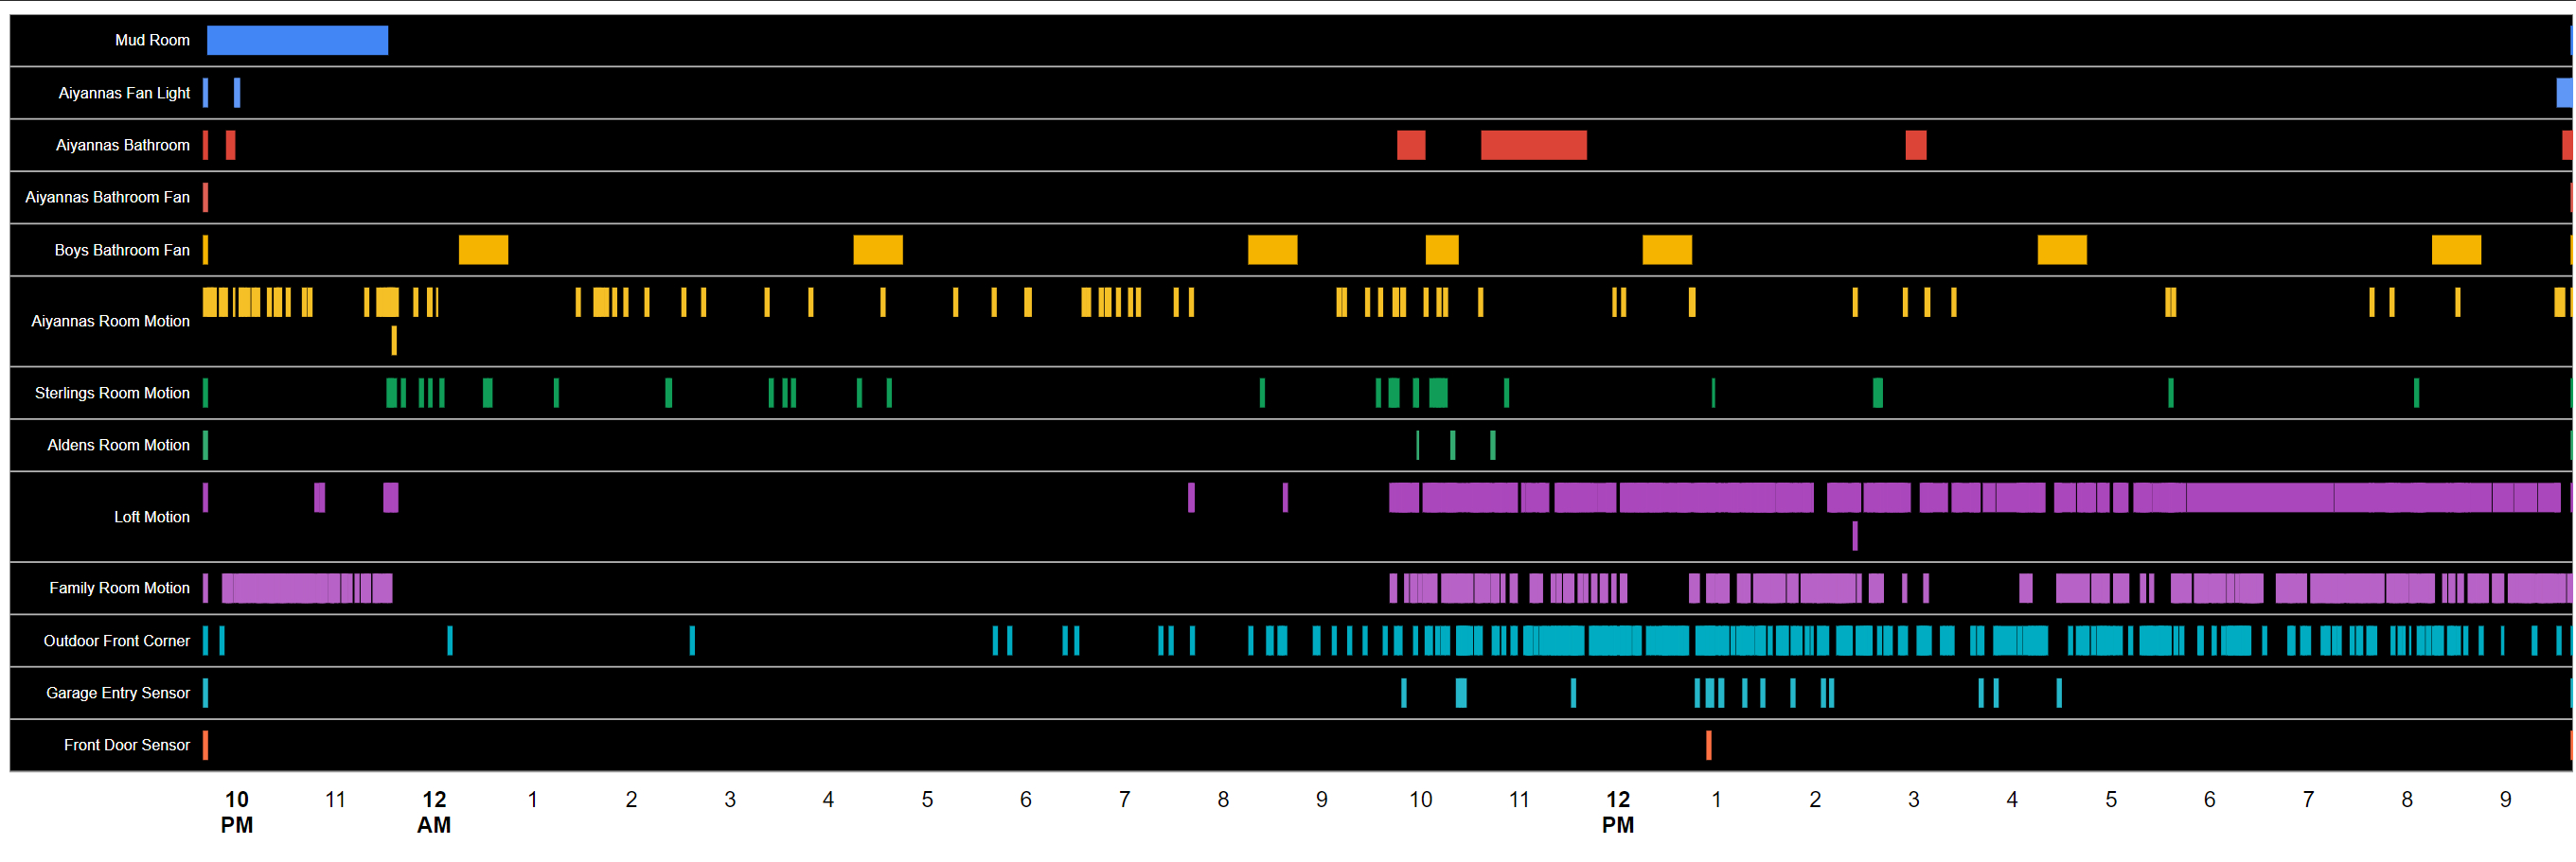
Neat. Reminds me of how Nest shows their Pathlight History on the Protects. Always thought that would be a cool thing to have for monitoring sensors, and there it is.
Thanks again!

Not a complaint, but I tried this from the cloud dashboard and it didn't show. I will never use it this way in my normal day to day stuff.
The webpage produced is the local one. If someone knows how to get the cloud-based webpage, I can add it to the config page; if the is interest
not from me 
Don't know what I did, I added the timeline code, and then tried to add an instance of a timeline. I got through the enable API, then I got this.

Your link sends me to a github 404 page?
@thomas.c.howard FAQ should be a standard part of any community app/driver IMO. Call it the "Shoo Fly Shoo FAQ"
2 Likes
Would it be feasible to support other Google graph types in the future? I'm thinking guages in particular (eg. to show the latest temperature reading against a scale that can be set using global variables). I think scatter could also look cool for showing sensor readings. Radar also to show various device parameters. Oh, this app has legs! Incredible, fantastic effort guys, well done! 
something like this will work for cloud url
["Cloud URL:\n${getApiServerUrl()}/${hubUID}/apps/${app.id}/$path", "?access_token=${state.accessToken}\n\nLocal URL\n${fullLocalApiServerUrl(path)}?access_token=${state.accessToken}"]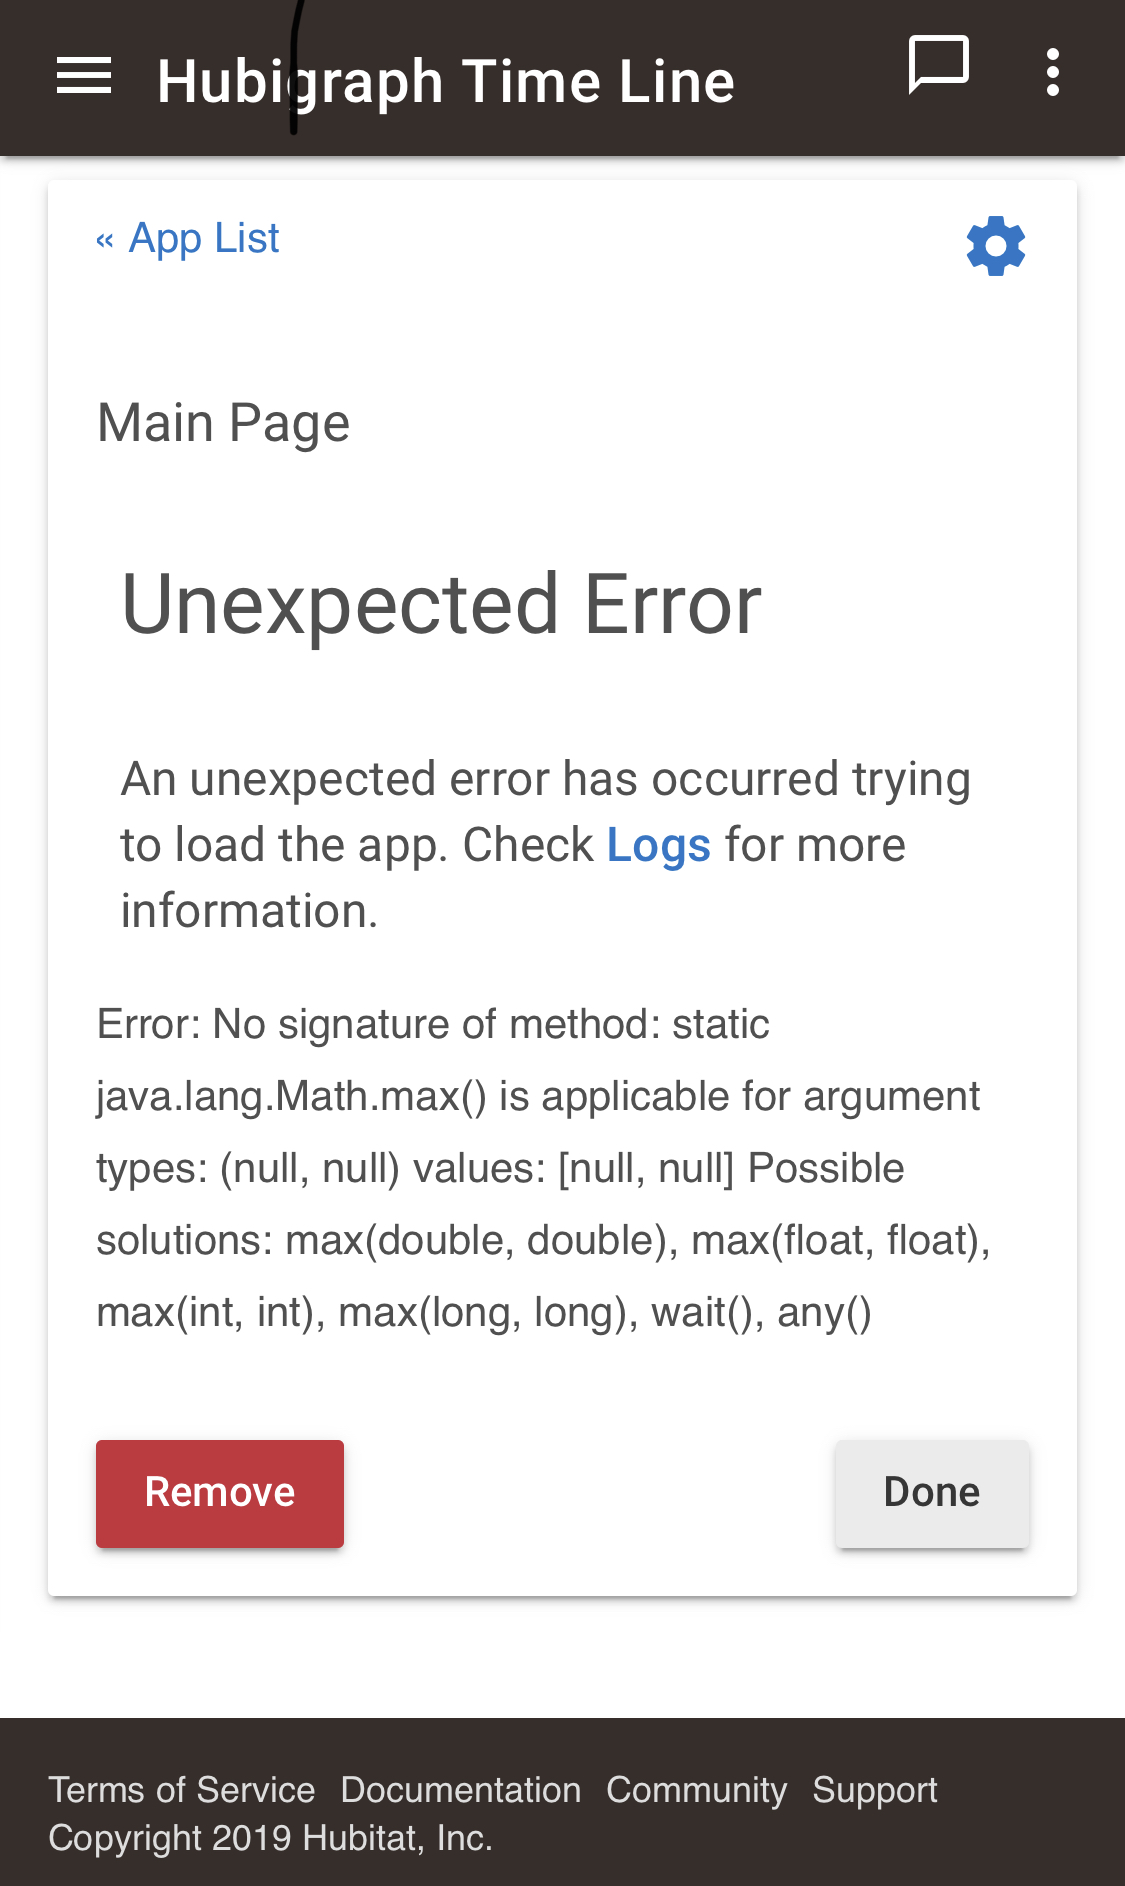
I totally love this idea, but since it is alpha I am hesitant to install it without knowing a bit more on how this works as I am concerned about the Hub load as I don´t want to create an unstable environment.
It is not fully clear to me, but is the data stored on the hub or in the cloud ?
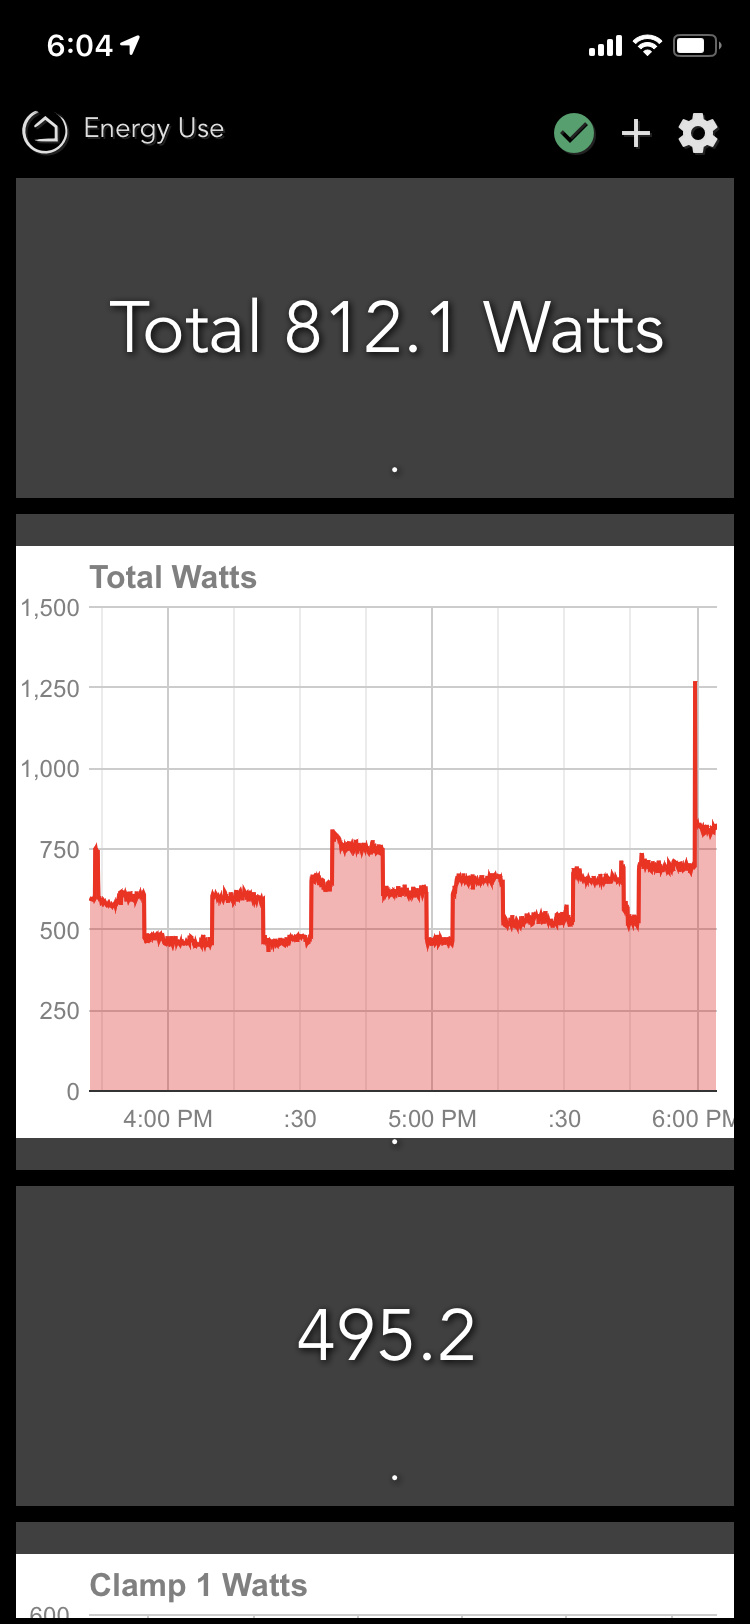
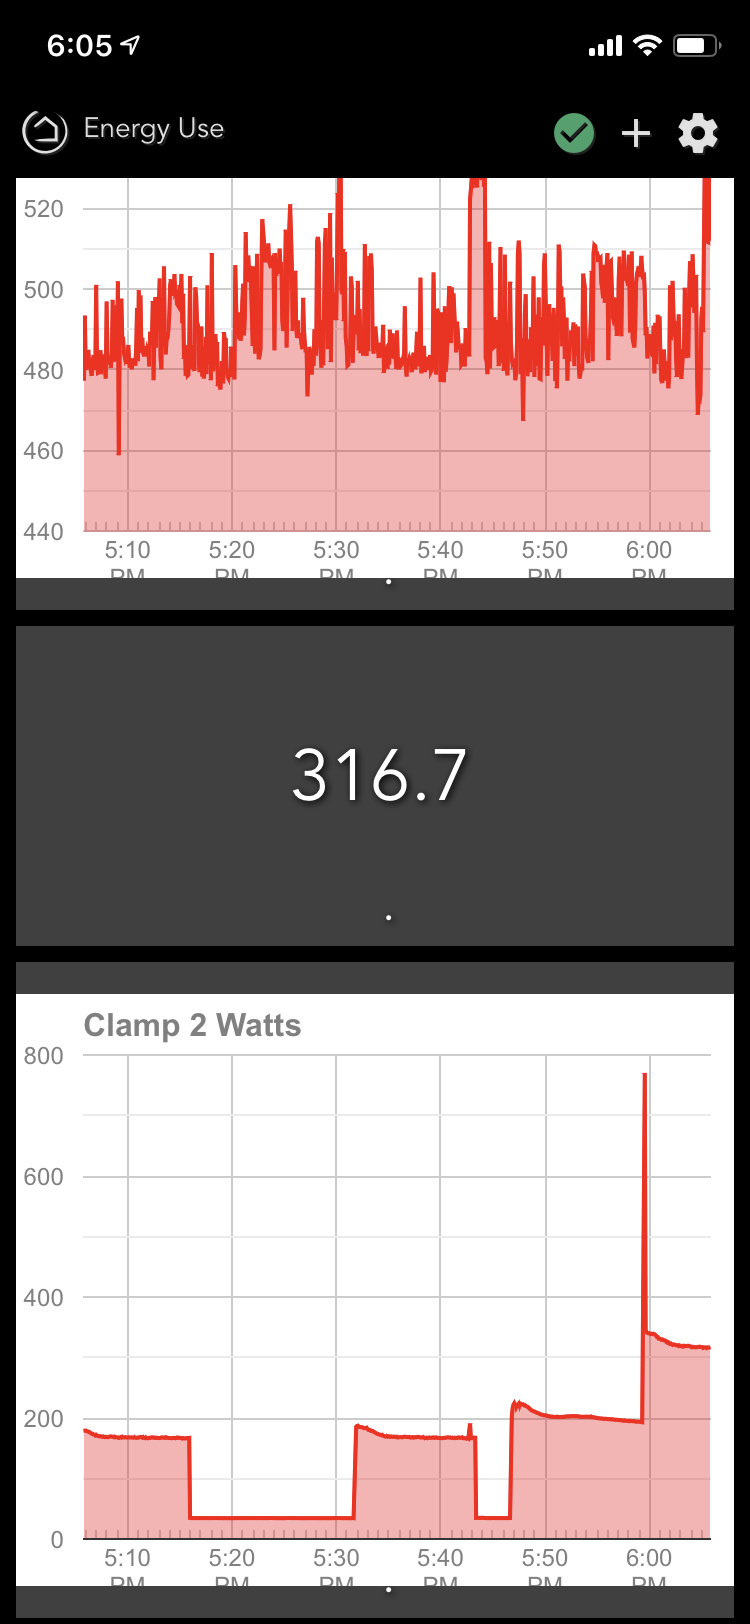
Hi, this application just pulls the historical data that already exists within HE into a simple graph that you can include on your dashboards for example. Very useful and saves having to wire up things like Graphana, etc. The latest release posted above works for drawing graphs - timeline is buggy (no validation checks for NULL values).
Thanks for the clarification. I bit the bullet and installed it to check it out and discovered what you mention, that it just pulls the data that is already available. This is a great start to some better logging on Hubitat.
I used to be on Vera and used the dataMine or dataYours plugins which stored historical data on a USB stick (our could do that). I think that would be great for longer term data storage, if possible on Hubitat.
Version 0.2 of the timeline code is available that fixes some logic which provides the new device summary page. You can get it here. Now to respond to everyone that does not sleep when I do
@napalmcsr, @tsviper : Fixed in version Timelines 0.2
@Angus_M: Link above should work. Yes, adding other graphs should be easy with the LineGraph and TimeLine Frameworks. As my FAQ states, if my wife wants it, I will do it. So really we are waiting on her.
@Evilborg: (Post 1) I don't get it? (Post 2) I will look into it.
@Kulfsson: I understand you hesitancy. Take a look at the code or give it a try. Your call. Really this is only loading the data initially, then updating when events occur (like a regular app). As mentioned in previous posts, my son (high schooler) spent some time devoting the processing into the host-browser. Our tests at home show a 140ms cost per graph update.
5 Likes
Just updated to latest.
java.lang.NullPointerException: Cannot invoke method toInteger() on null object on line 148 (mainPage)

