@thomas.c.howard Success! Not on the hub where the HEMs are, that still locks up the hub UI hard, but I did the back and forth, Link to Hub/Hub Link "Rube Goldberg" thing with my three hubs, and with your code (and your son too. Very nicely done!) it's working with the Omnisensor. I changed capability.sensor to capability.powerMeter in the child and then I could select the virtual HEM.
Can't get the individual clamp readings this way, but I can work on getting HubConnect setup over the next couple of days and that should resolve that problem for me.
Thank you again for this. Exactly what I was hoping for!


1 Like
For some reason this doesn't work on iOS. Tried in Chrome for iOS, Safari for iOS and the Hubitat App. But it's fine on Android.
Chrome for iOS
Safari for iOS
HE iOS app
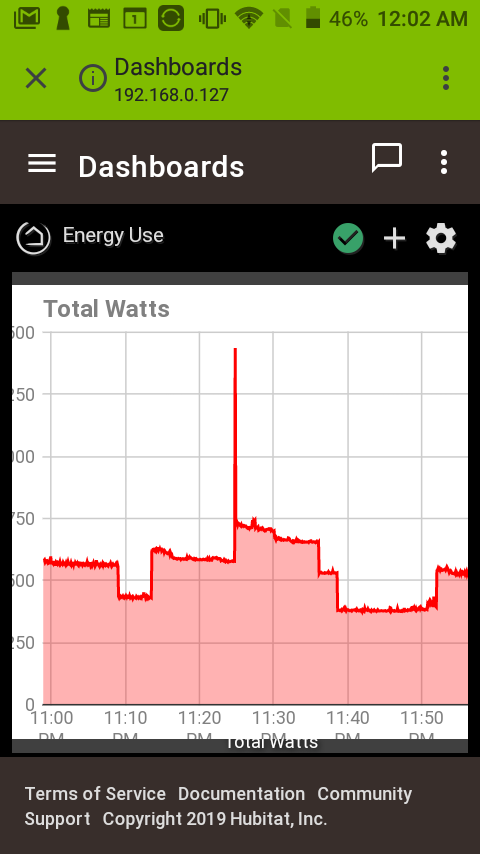
HE Andriod app
I’m experiencing the same empty graphs on v0.2 as well. Reverted back to 0.1 fixes it.
I’m on iOS and macOS.
I’ve reverted back to v0.1 (requires the removal of the word Legacy from the definition name) and my graph is working again...!
Thanks Alpha team (I.e those willing to try this out!). You are all correct; version 0.2 does not work on IOS. I am back in the game! I will have a fix shortly (or my son will .... ha ha). I have corrected the description with the warning
2 Likes
Tut, tut. The kids of today.

Hi
Thanks for this app, I am just having an issue with showing the units on the x and y axis?
Looks like you may have made your header color white or you set the font size too low?
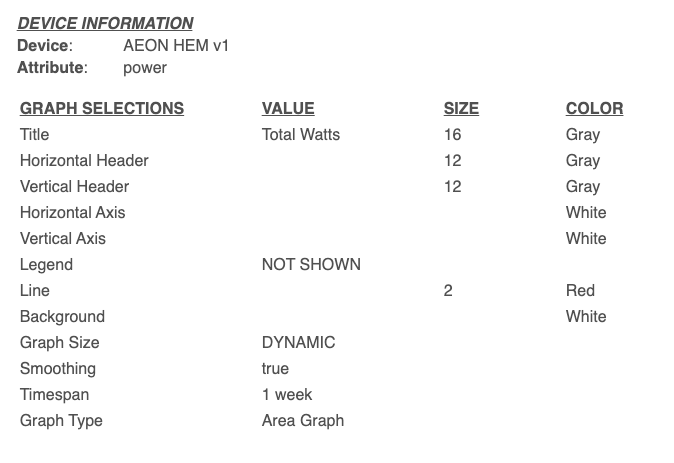
Can you show a screen shot of your Graph Selections?
Example:
Another example, If I set my Horizontal Header font to 1, the timescale will disappear.
Version 0.3 (Alpha is released). IOS devices are now supported. I kid you not, I told my son that the community (thanks again for the support) had found that IOS browsing broke his "miracle"--his words-- solution so he rolled out of bed and fixed it in 30 seconds. By the way for all those interested, this is "Apple's fault for not supporting industry standards." Sigh Well at least we have a fix. It is posted (as usual) here
6 Likes
Hi SmartHomePrimer
Thanks for the reply I just copied your settings and it all seems okay now, just one more thing, how to try and make this "use the tile space" better. If I drop the Height by 1 it starts to crop the y axis, if I drop the width by 1 same thing with the x axis. Seems to be a large blank area below the graph.
Thanks again for the help
Do you have the graph size set to DYNAMIC (i.e. don't force the graph size). If you do, it should fill the tile completely. Also a thought: in the screenshot below, the square tiles are 6X5. I made them large so I could add space between them easily. That might do something...
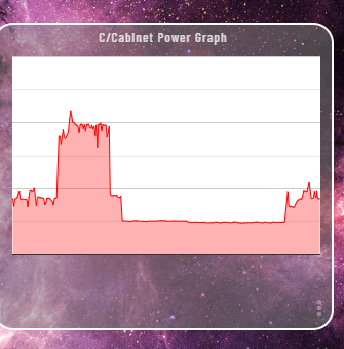
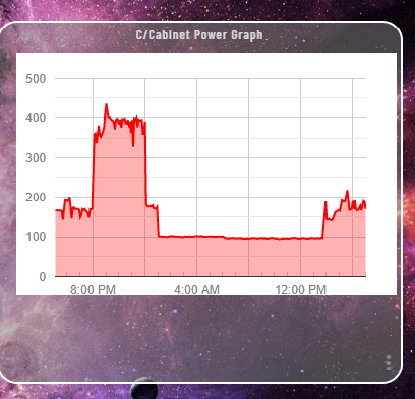
Here is my tile:
Something not right. Seems to be duplicated content from line 1-37. I'm getting an error on save. I tried just removing the duplicate code. I'm not a dev so that just breaks it! 
1 Like
I screwed that commit up BADLY. Thanks. It shoudl be fixed now.
1 Like
Hi thomas.c.howard
These are my settings
Yep working for me too! Thank you.
Working great! That you and your son.
1 Like
Seems like it's your dashboard setup. Are you using an app to modify its appreance?
1 Like
Okay, that could be it. I originally used the smartly dashboard app so maybe this is messing with it, I will ask them on their thread. Thanks again for the great app and SmartHomePrimer for the help.
1 Like
Wow this is great! Trying to wrap my head around node-red, influxdb and grafana has been fun and all, but as a simple dashboard graphing solution that's self-contained within Hubitat and easy to setup, this is amazing.
Plus we get to read your sarcastic commentary about your teenager? I'm in.
Instant @Kings status for @thomas.c.howard? @bobbyD what do you say?
5 Likes