LOL; you actually called me on that? They are there, just manifested differently  Did the fix work?
1 Like
@thomas.c.howard update resolved issue - no more crash and burn, no puff of smoke!
And I was apologizing for my lazy reading, which clearly overlooked the reports of similar symptoms from others
Glad to hear it's working! Easy fix, I was just to lazy to actually code it.
And who has time to read 933 messages? Good luck and let me know if you have any features you want added.
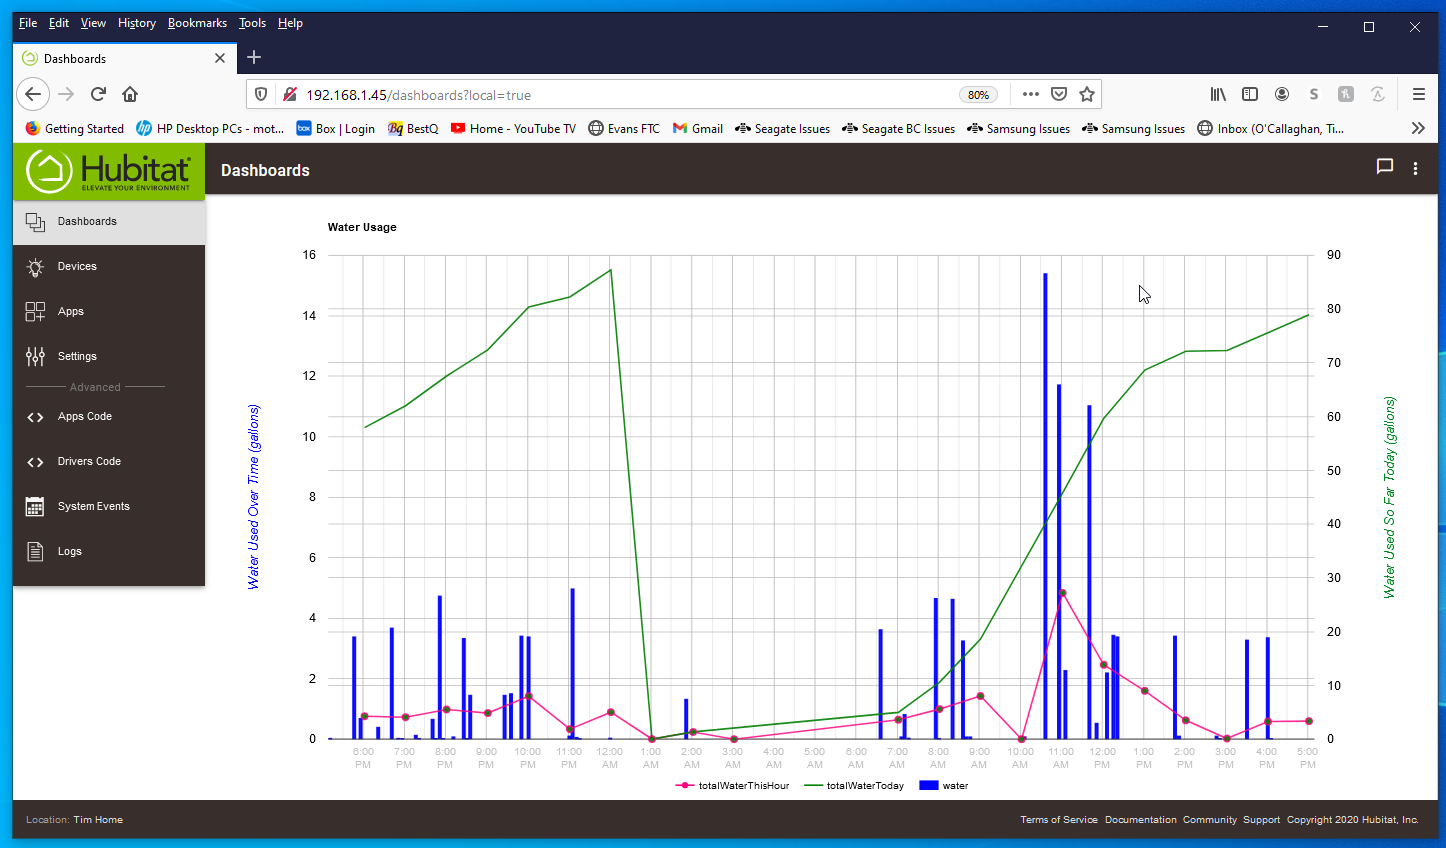
Has something changed....I am not getting graphs updating at all.
My interval is 5 mins but after 3 hours the graph has not changed : )
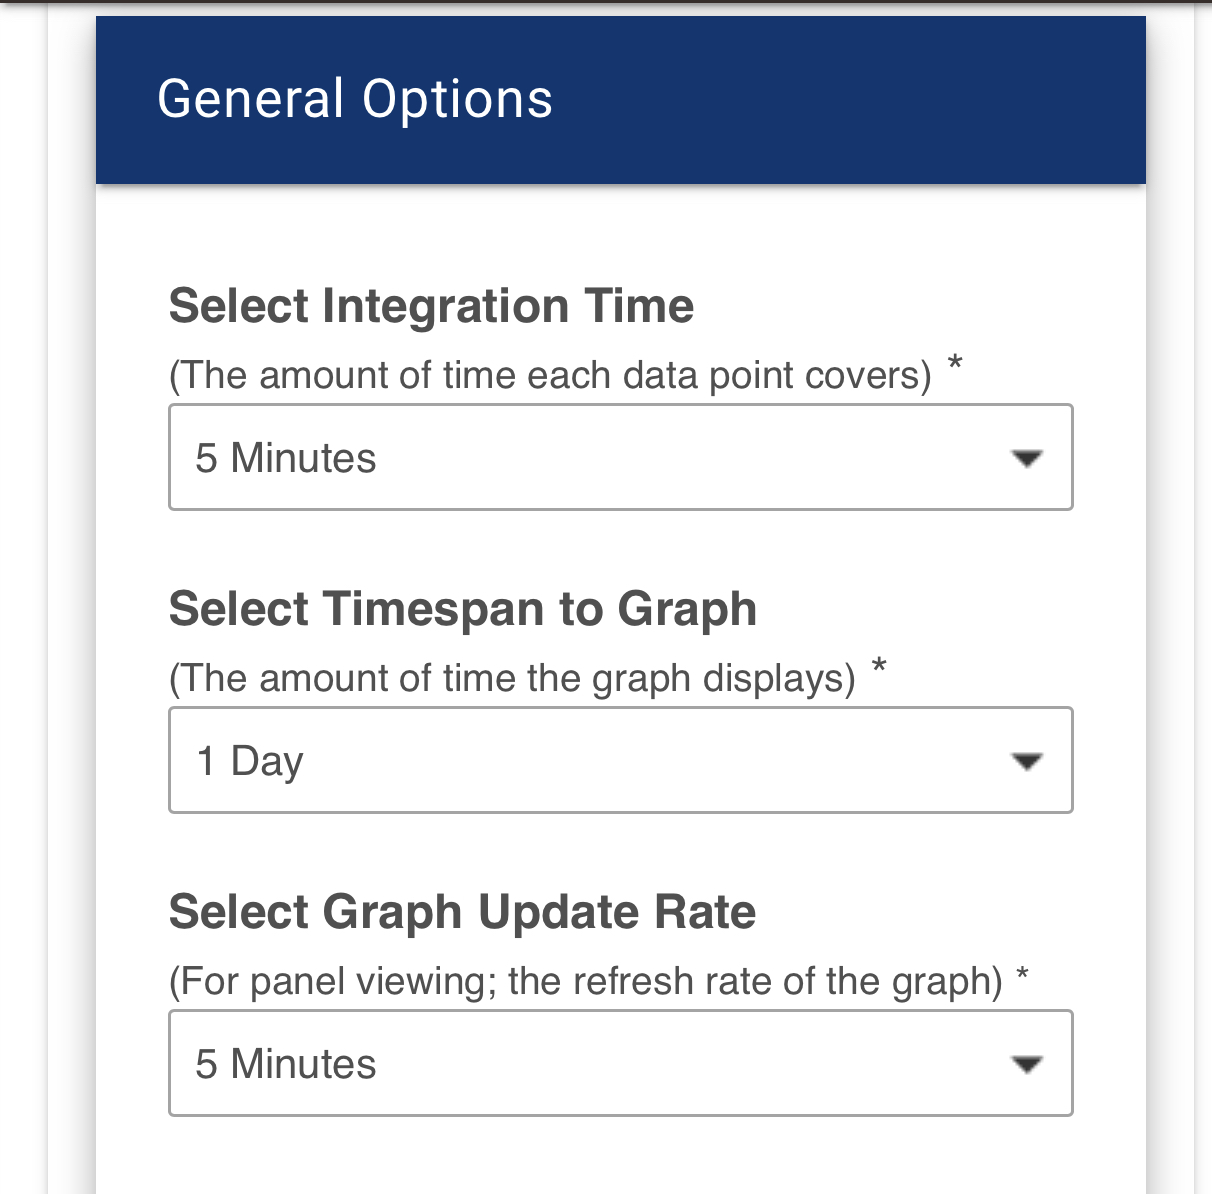
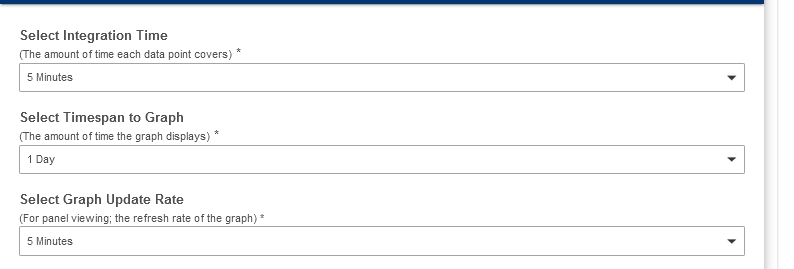
@tim.ocallag, what do you have in your graph options? What are you graphing? Integration Time is the number of "points" over a given time... Graph Update Rate sets how often it updates. If there is no data, it should have blanks... Is that happening? Did you update? You might need to "revisit" the Options screen to refresh things
Thanks for your help @thomas.c.howard. The point about seeming like we were using two different hubs was the key. The weather tile is a huge contributor to the WAF for my system. 
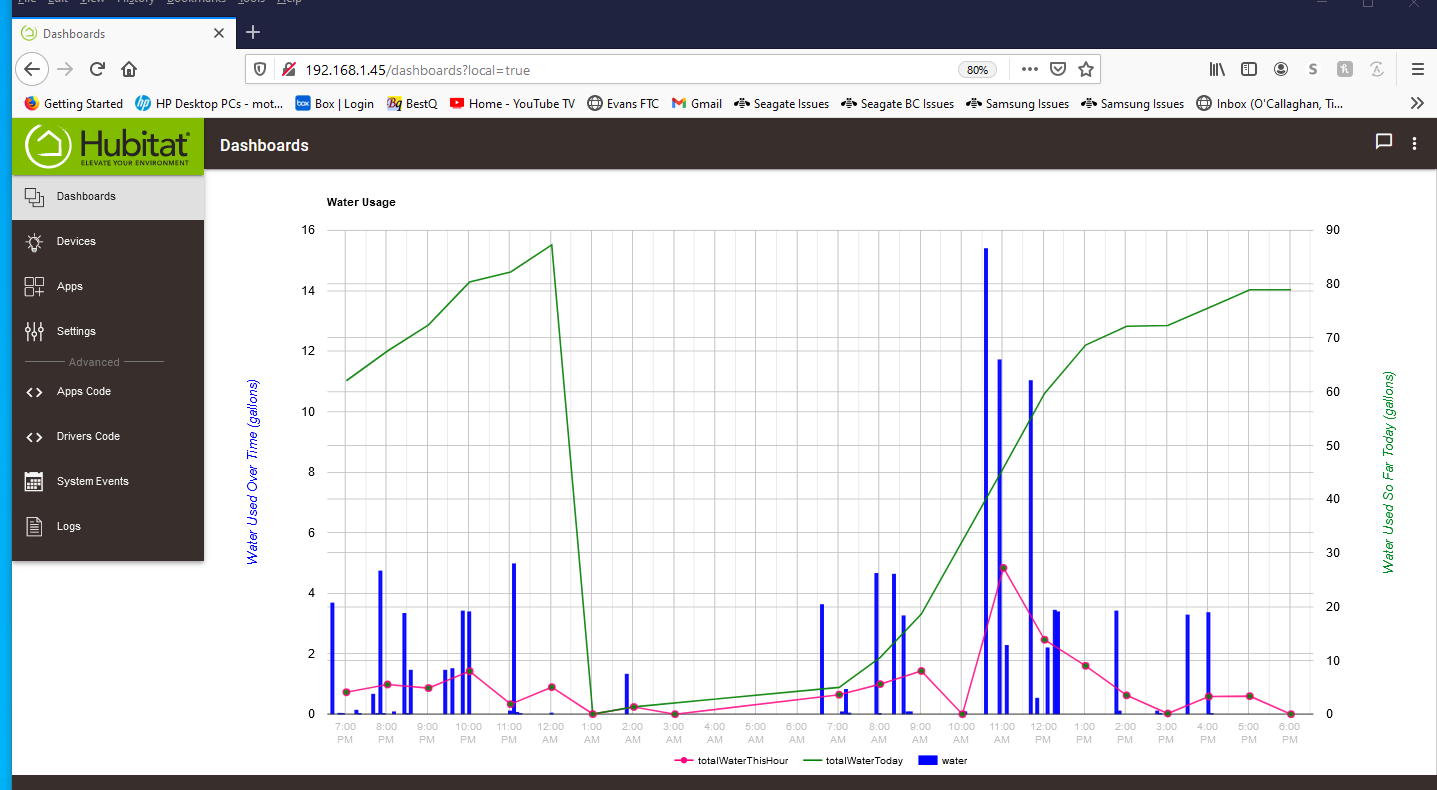
Do you have a screenshot of the graph and then again in an hour (no refreshes between)? Also, is this running on a dashboard? Is the device you are graphing authorized for the dashboard. The new security (in Hubitat's latest update) might be messing with this....
First of all ... well done sir!
For me ... HubiGraphs is what Hubitat is all about! I love it.
I've pretty much figured out the Range, Heat Map, Time Graph, Forecast and Radar. I'm sure I'll find more to use as I increase the number of devices to match your collection!
I only (currently) have one feature request and that is to add an auto-range (min/max) on the Range Bar (like you have for the Time Graph). I'm using it for a min/max temp over the week and in Arizona, those keep shifting (if I want a tight graph).
Thanks again!
Keith
Hi Folks,
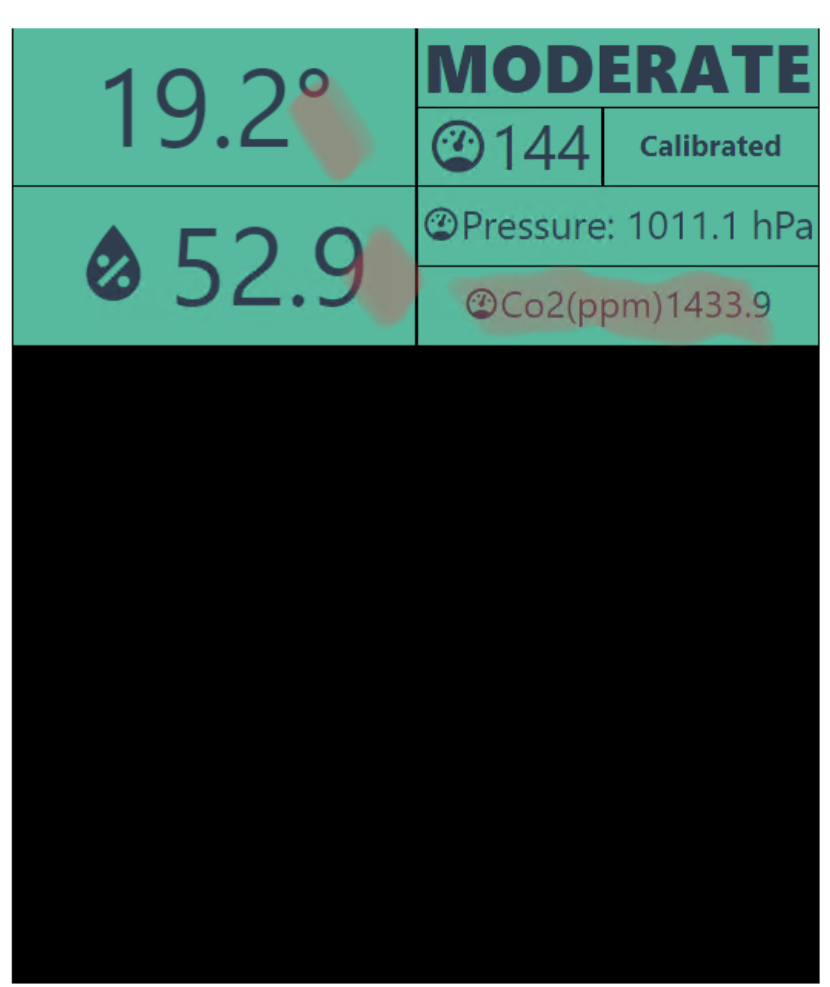
Trying to use WeatherTile 2.0 to display some general sensor values, rather than using it to display weather data...
Sensor temperature when added to tile is represented as XXX and then when revisiting the tile the added sensor isn’t retained..
Screen capture video of what I’m seeing...
And logs:
app:41072020-11-18 07:39:13.592 pm debugcurrent.rain.1h: Cannot find data: java.lang.NullPointerException: Cannot get property '1h' on null object
app:41072020-11-18 07:38:59.081 pm infoSent setGraph: http://172.24.1.202/apps/api/4107/graph/?access_token=
app:41072020-11-18 07:38:59.023 pm infoCreated HTTP Switch [Forecast Tile]
app:41072020-11-18 07:38:58.842 pm debugCreating Device Forecast Tile
app:41072020-11-18 07:38:58.838 pm debugnull
app:41072020-11-18 07:38:58.832 pm infoCreating HubiGraph Child Device
app:41072020-11-18 07:38:58.811 pm debugUpdating Name to Hubigraph Forecast Tile
app:41072020-11-18 07:37:41.921 pm debugcurrent.rain.1h: Cannot find data: java.lang.NullPointerException: Cannot get property '1h' on null object
app:41072020-11-18 07:36:57.292 pm debugcurrent.rain.1h: Cannot find data: java.lang.NullPointerException: Cannot get property '1h' on null object
app:41072020-11-18 07:36:25.098 pm debugcurrent.rain.1h: Cannot find data: java.lang.NullPointerException: Cannot get property '1h' on null object
app:41072020-11-18 07:36:02.592 pm debugUpdating Name to Hubigraph Forecast Tile
app:41072020-11-18 07:35:01.994 pm debugcurrent.rain.1h: Cannot find data: java.lang.NullPointerException: Cannot get property '1h' on null object
app:41072020-11-18 07:33:44.230 pm debugcurrent.rain.1h: Cannot find data: java.lang.NullPointerException: Cannot get property '1h' on null object
Any ideas where I’m going wrong?
Great Video. It exposed something. Due to security — new to the latest firmware, you’ll need to configure your app and everything FROM YOUR IP address (not hubitat_local). Once configured, no issues... Make sense?
1 Like
great ! that worked!
It would be great if you could override the units of measurement and specify these manually, eg ppm and oC and
is it possible to add a graph within the weather tile? eg showing a small line graph showing temperature trend would be awesome!
This is a really powerful way to create custom “widgets” not just for weather !
great work!
Hi the ipad in the kitchen hasn't updated since 6am ....I did update the Hubitat hub...
Is there something I would do to "authorize" that ipad?
I just screenshot a graph taken after clicking the dasdhboard on my PC...i will wait and hour and snapshot again.
Thanks for all the help!
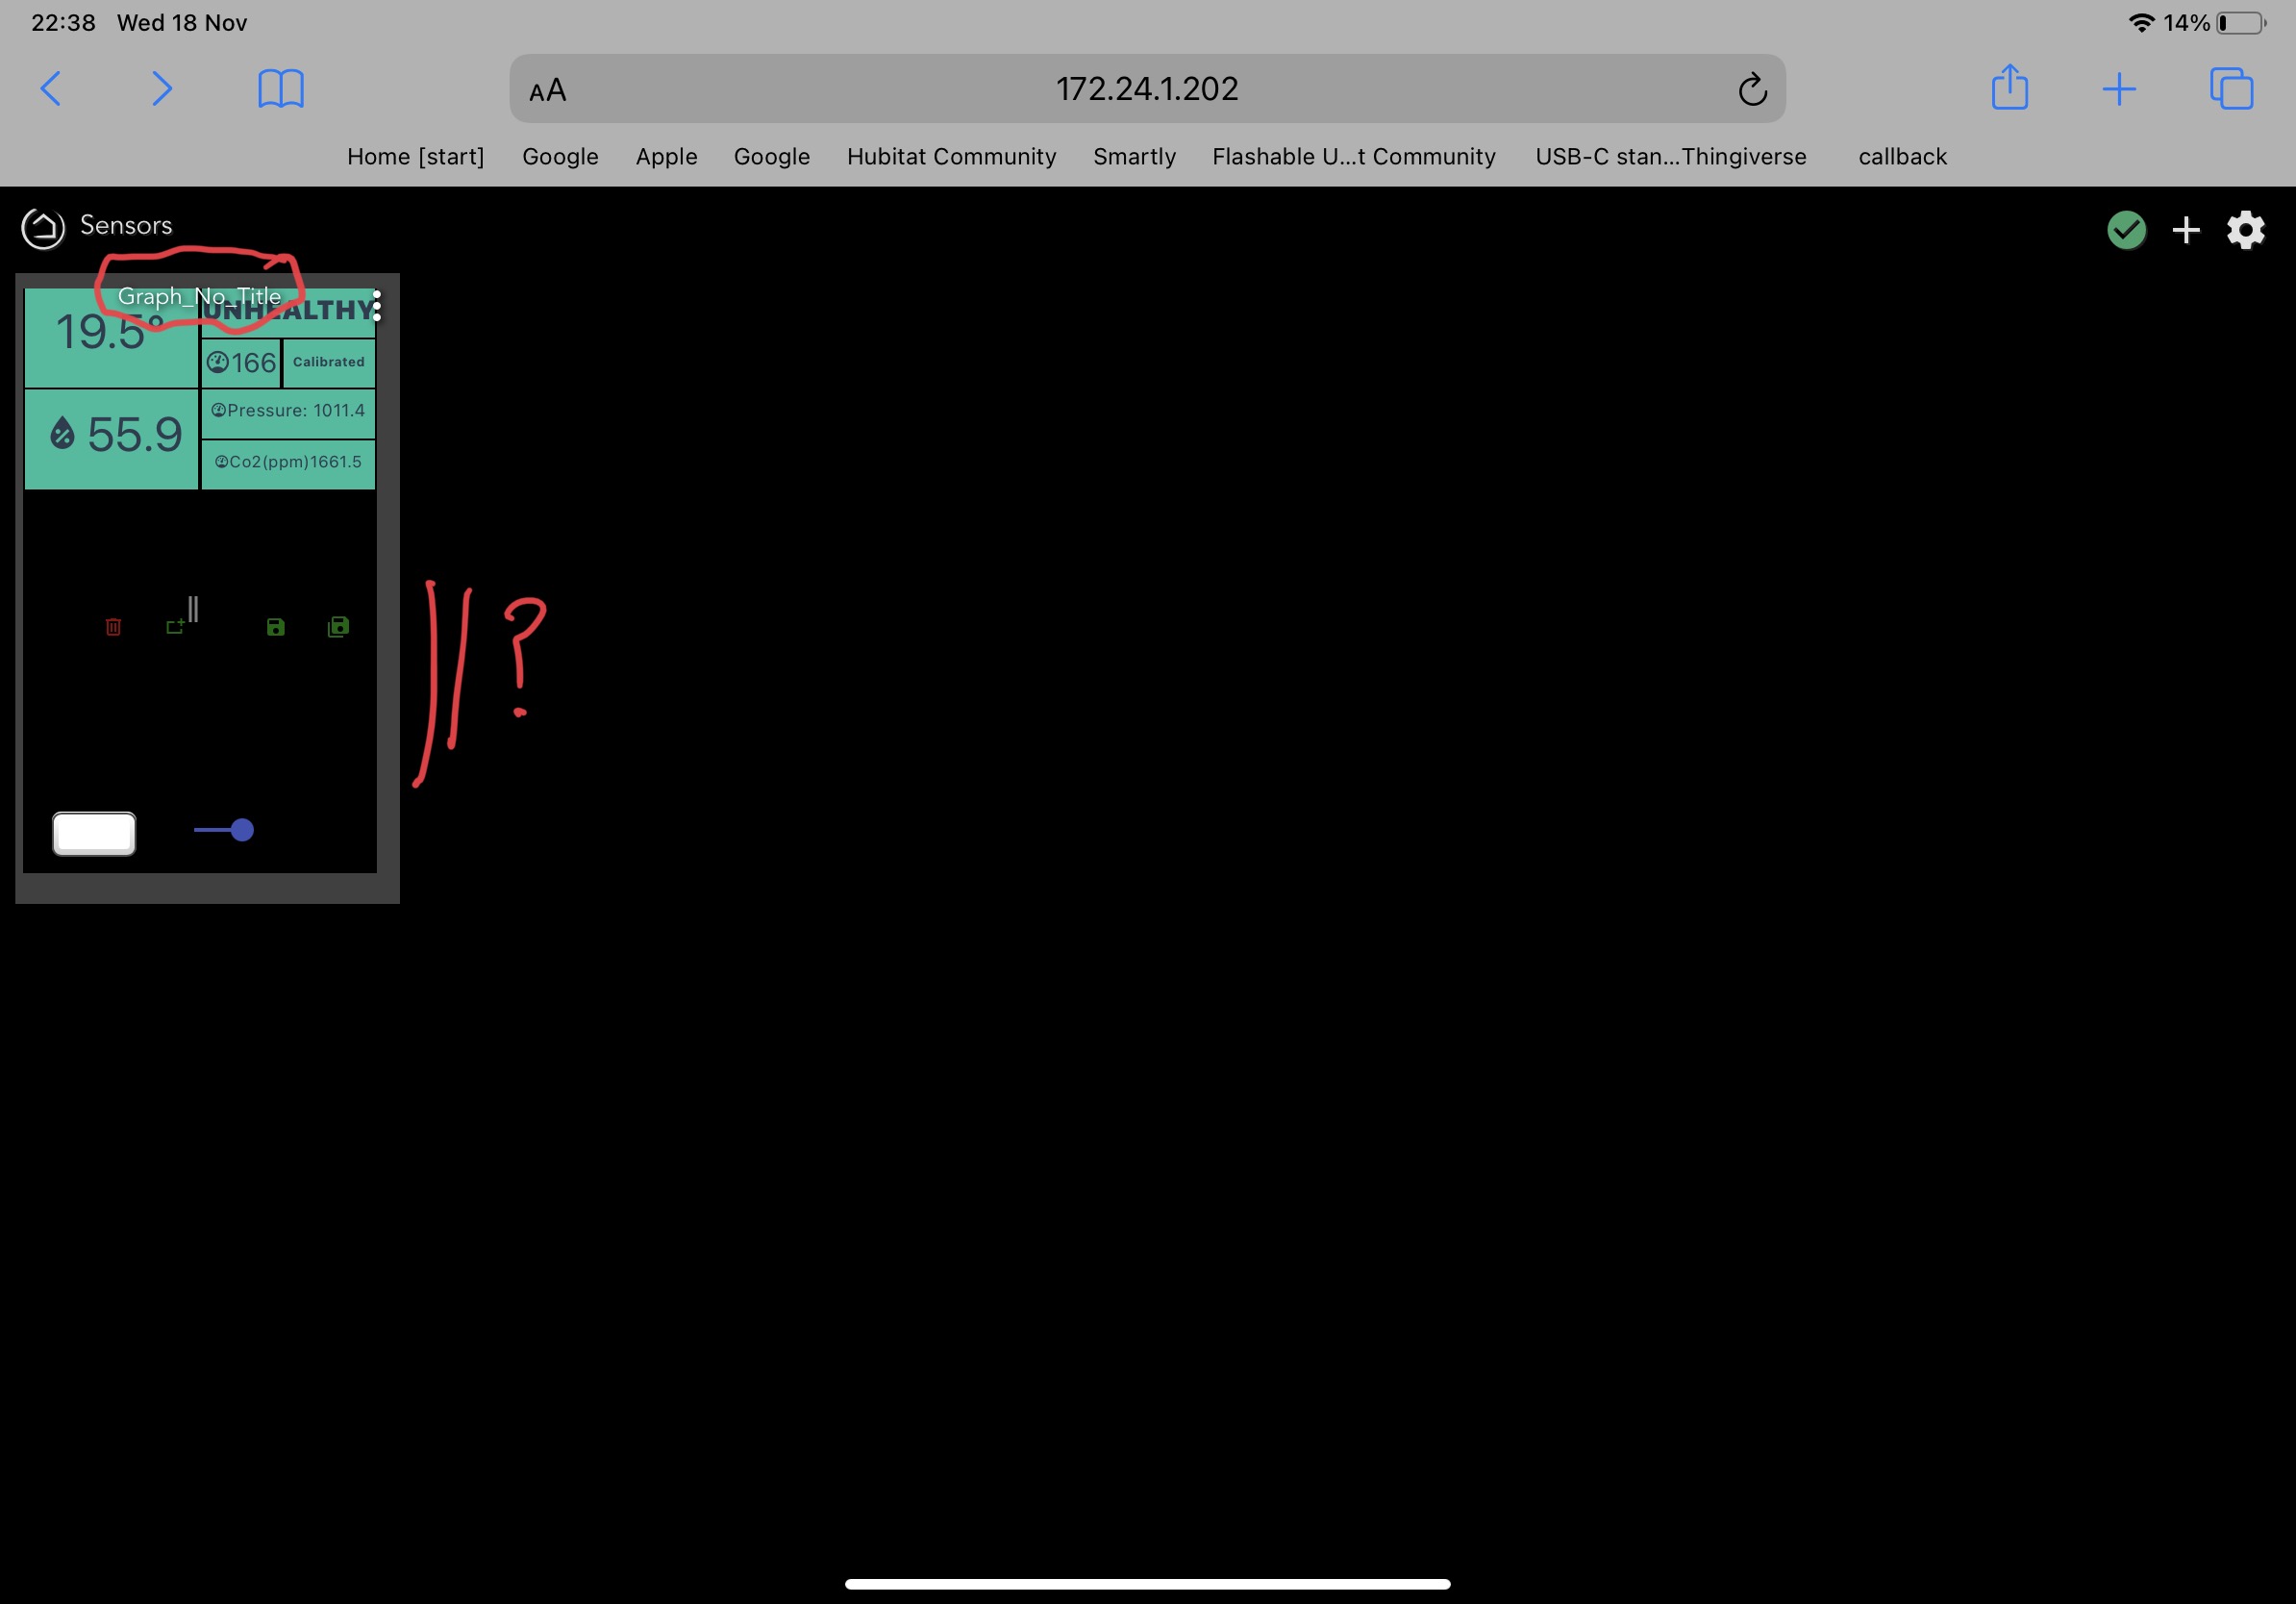
Did you install this as a HubiGraph tile? There are two frames that are built. That looks like the configured one... This is a bug that I will fix
Yes, I did ... is there any workaround to display on a dashboard?
It might be the no_title version. Try the title version
@daniel.john.edge, fix is uploaded. Please update and then rename your child device and then save. It should work now.
um,so it is updating on the PC.....just not the ipad.....which is of course where it will seen the most : )
I take it back,,,,neither is updating : )
Is there some security i now have to setup ?
Anyone else seeing auto-update not working?
Thanks Tim

