This week I've had a number of issues, firstly z-wave stopped responding (message to that effect on the home page) so I shut down the hub, powered it off for a while. Seemed to clear the issue.
Today I have the following:
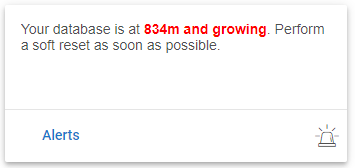
This is a very frustrating error because I have no indication of what "881m and growing" means. Will it fail at 1000m? Sooner? Later? What causes this? Why would a backup, soft reset and restore fix this?
My hub failed when I was on holiday recently preventing people turning on and off lights, I can only assume it was related to the database size error shown above but no way of knowing because by the time I got home I had no option but to reset it adfter the database corrupted on reboot (maybe a power cut, maybe not).
Is there something I can look at to see why the database is growing in this way? I have very few devices and even fewer apps on the hub. What should I be looking at?
Thanks
David
"Normal" database size for me is about 30-40m on my production hub and 10-15m on my development hub - I have an alert set for when it exceeds 85m; so you're at almost 10x my alert level. As to what causes it there are a number of things - some of these are to be addressed in the upcoming 2.2.9.x release.
The process of reloading the database from a backup forces a rebuild of the database which compresses it and generally removes any corrupt rows.
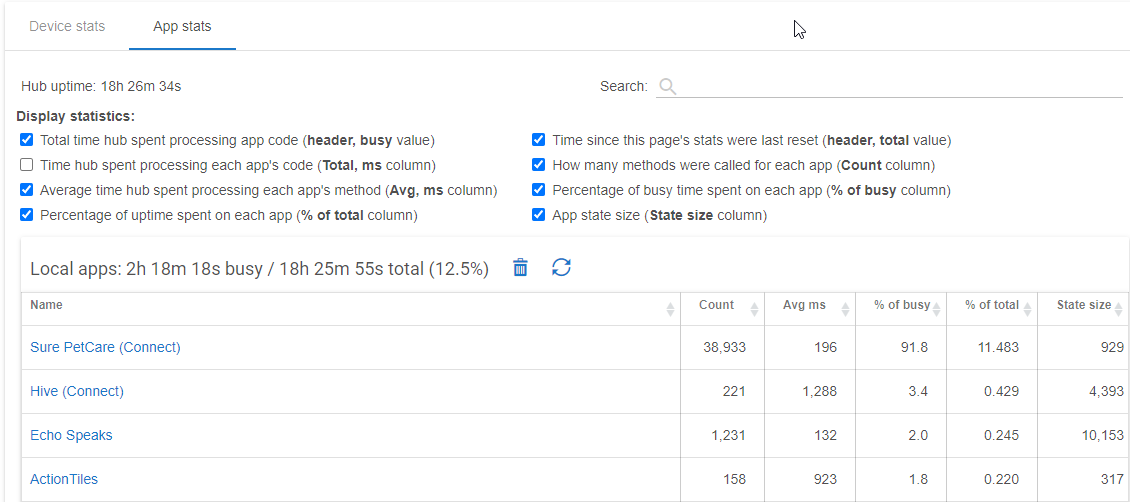
You can look at the runtime statistics for an app or device that is showing an unusually high usage rate, but unless the hub busy time is extremely high that may be a red herring as a high percentage of a low cpu busy rate is actually a low percentage; i.e. if you have an app that is 25% of application busy time, but application load on the hub is only 5%, the app is really only taking 0.05*0.25≈0.0125 or 1.25% (more accurate to actually grab the amount of time applications are using and determine the seconds the app has used based on the %, and then divide that by hub uptime but this is close).
I have one app which seems to be fairly noisy given what you describe:
Would that be a likely cause? Should I move that integration over to my HomeAssistant instead of Hubitat?
FYI: the database went from 800m to 1000m in about 2 hours this afternoon, so I have gone ahead and backed up the database, done a soft-reset and waiting for it to restart as we speak
1 Like
Still only ~11.5% CPU. It's a little heavier than most, but not as bad as some I've seen out there (I'm guessing it does a lot of HTTP traffic). Even if your device usage is the same as your app usage you'd only be at 25% which shouldn't normally cause an issue.
What does your free memory look like? (http://<yourHubIP>/hub/advanced/freeOSMemory) Given the high amount of HTTP traffic that may be a more likely suspect for the earlier lockup. My production hub usually has about 340000, while my development hub is normally in the 450000-490000 range (unless I'm playing with some new code a make a mistake).
Regardless probably should do the soft reset and restore if you haven't already as the large database won't go away until you do (and will start slowing things down).
2 Likes
I recommend this link Alert - Your database is growing
TL;DR, there is an issue with the current FW. Your issue could be caused by a ghost zwave device, or just simple warm reboot your hub.
1 Like
I cold booted mine the other day and then noticed an hour or 2 later that my database was starting to climb. I warm booted when I noticed and the database shrunk and has been fine since.
I've installed the Hub Info driver and set myself up an alert rule so I know well in advance next time. I am also exporting the device across to my HomeAssistant setup so I will be able to graph the memory and database stats going forward.
2.2.9 update is out, it should solve with the "growing database" issue. Please let me know if it still happens on 2.2.9.
6 Likes