Have an automation that is not working properly? Many issues with devices and app code can be identified by using the logs built into your web user interface. Examining your logs can save you a lot of time and frustration by quickly pinpointing the line of code in the device or app that is throwing an error.
Open your logs by clicking the "Logs" button ![]() in the main menu of your web user interface. If you have devices connected and active, you should start seeing log lines appear as those devices check in with the hub. Each log will have one of five codes:
in the main menu of your web user interface. If you have devices connected and active, you should start seeing log lines appear as those devices check in with the hub. Each log will have one of five codes:
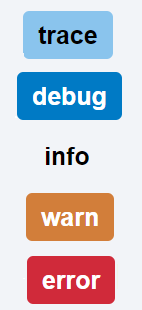
“Trace", “Debug”, “Info” and "Warn" logs display routine messages from properly functioning devices or apps. Red “Error” messages are the ones to watch for.
To troubleshoot your hub, try triggering your troubled automation or device while watching the logs for an error (you may need to open the "Logs" in a separate window or tab, if you need to view other sections of the web interface - navigating between pages, clears the "Logs" page).
If you notice an ![]() in your logs, it should be followed by additional information to help you diagnose the issue:
in your logs, it should be followed by additional information to help you diagnose the issue:
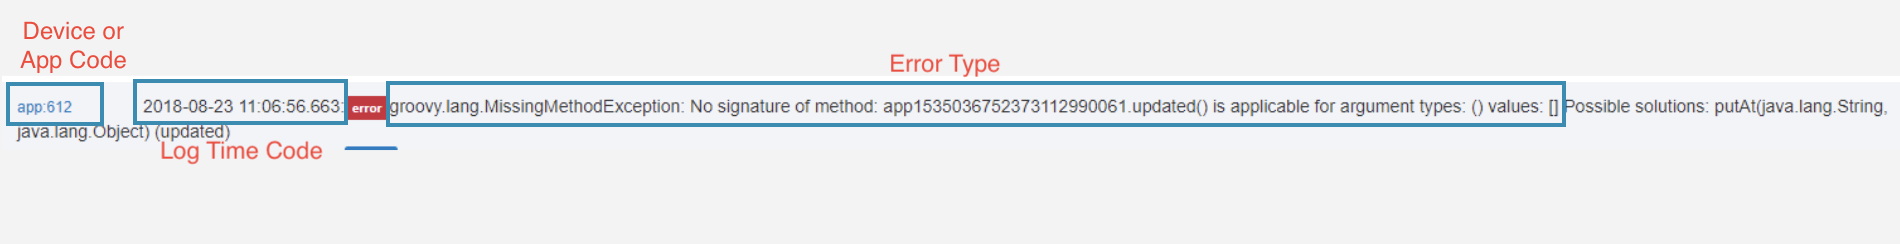
Pay special attention to error logs that say “no method exists” or “caught exception.” The affected device or app code will be listed on the far left side. The error line number tells you which line of code is throwing an error.
Click on the Device or App code and the app or device will be highlighted at the top of the log page. You can also click on the device or app name at the top of the page to only view the logs related to a specific device/app. If the error is in a custom drive, the Error Type can give you clues to start fixing the code (or contact the app developer with this information).
If the error comes from a built-in app or driver, please contact the Hubitat Elevation support team.