A basic understanding of networking (e.g. difference between an IP address and a port).
An always-on device capable of running Splunk. A full list of support OS's can be found here. NOTE: Since there is no log queing, if the machine running Splunk is offline, any logs sent during that time will be lost. Using a syslog does not change local log retention on the HE, so the logs will still be available locally.
A DHCP reservation or static IP set for the device hosting Splunk.
Benefits
Reduced log retention requirements on HE.
Persistent log availability (e.g. looking at log events from a month ago).
Better searching of logs (e.g. search based on device name and time and keyword).
Install Splunk following the instructions here. Be sure to switch to the free license. NOTE: The URL for accessing Splunk will be the "<device_ip>:8000". If your accessing Splunk on the machine that it's installed on, you can just use "127.0.0.1:8000"
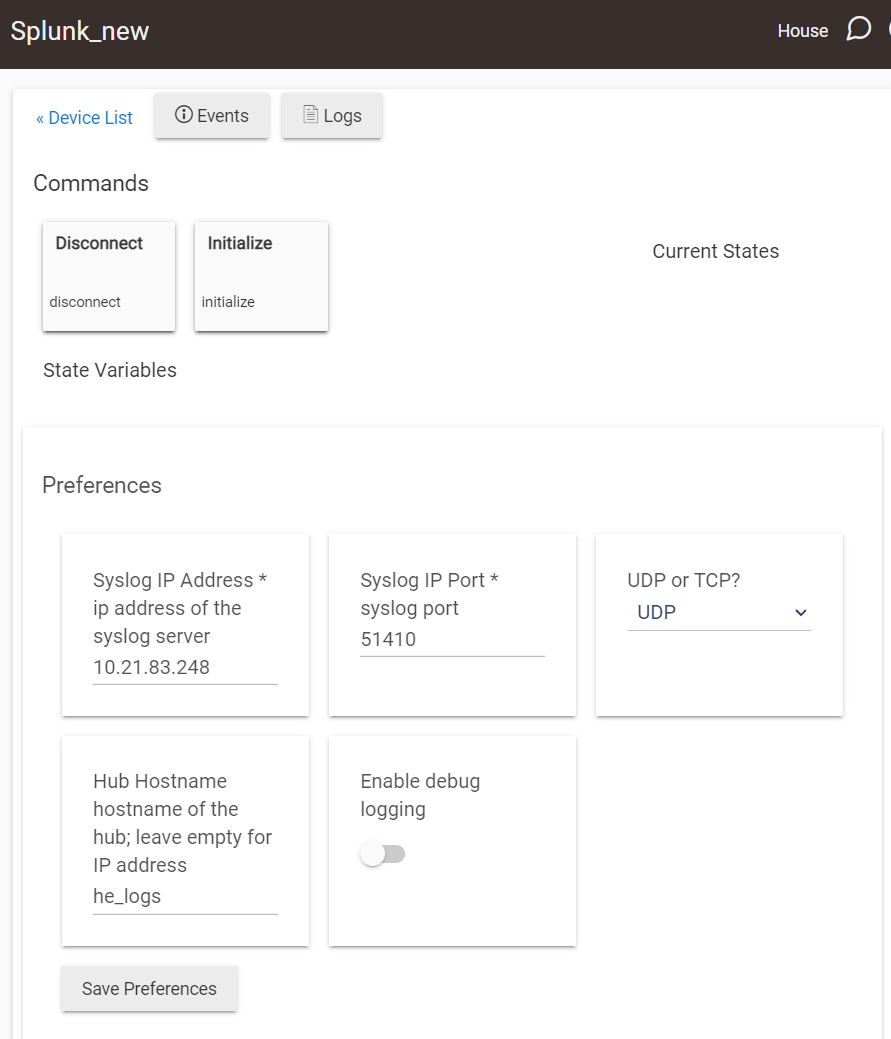
Create your virtual device on HE using the "Syslog" device driver.
Set the "Syslog IP Address" to the IP of the machine you installed Splunk on. Set the port to whatever you'd like to use. Choose your protocol (I opted for UDP and haven't had any issues).
Set the "Hub Hostname" to something easily remembered. You'll want to use this for searches if you decide to start sending logs from somewhere else (I'm also sending logs from my network gear). This will be the "host" field in Splunk.
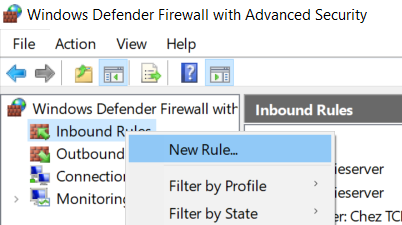
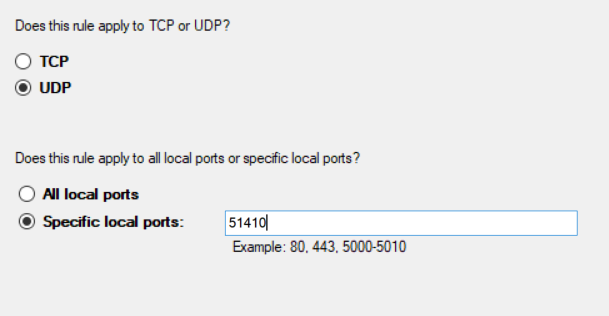
Match the protocol and port that you set in the driver on HE.
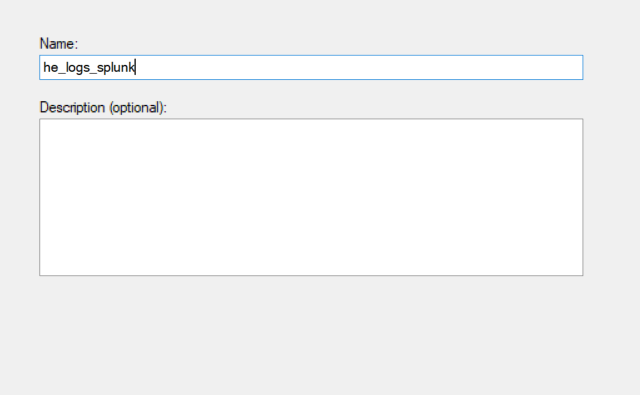
Leave the rest of the options at default. Give the rule a friendly name.
Back to Splunk
Select "Settings" in the upper right-hand corner.
Select "Data inputs" from the drop down list.
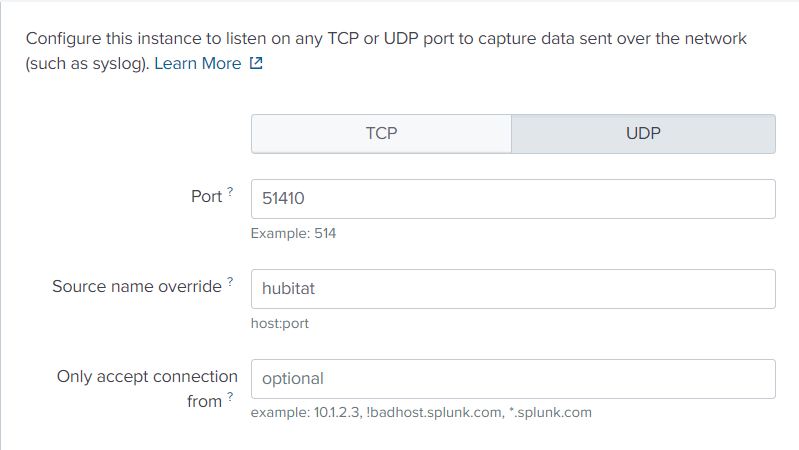
Select "+ Add new" next to the option for "UDP".
Enter the "Port" you set in HE.
Set the "Source name override" to something friendly. I use "hubitat". NOTE: You can also set the "Only accept connection from" to your HE IP address. If you don't set this, anything sending data to Splunk on the same port will be ingested. If you do set this, but have multiple devices, you will need to specify a different port for each device. The "Source name override" can be set to the same value for all.
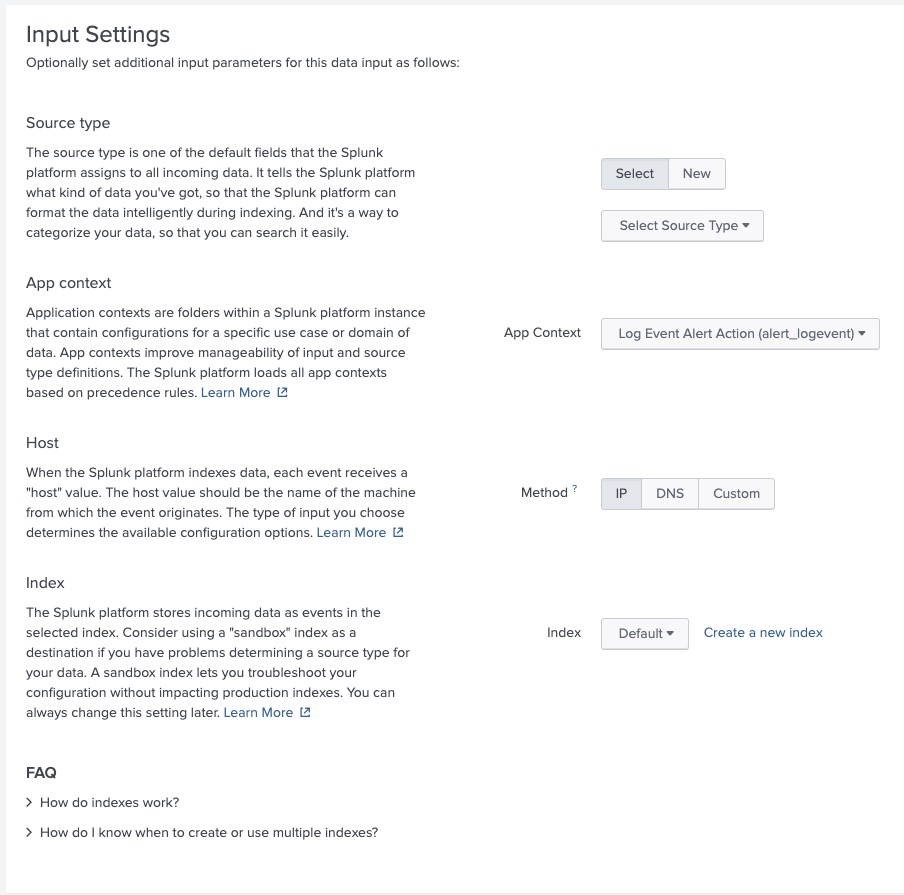
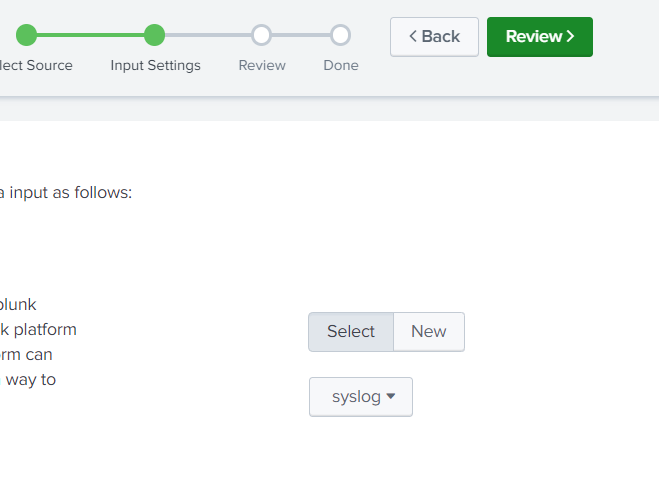
Click on "Select Source Type". Go to "Operating System" and select the "syslog" option.
Click on "Review" in the upper right-hand corner.
Click on "Submit".
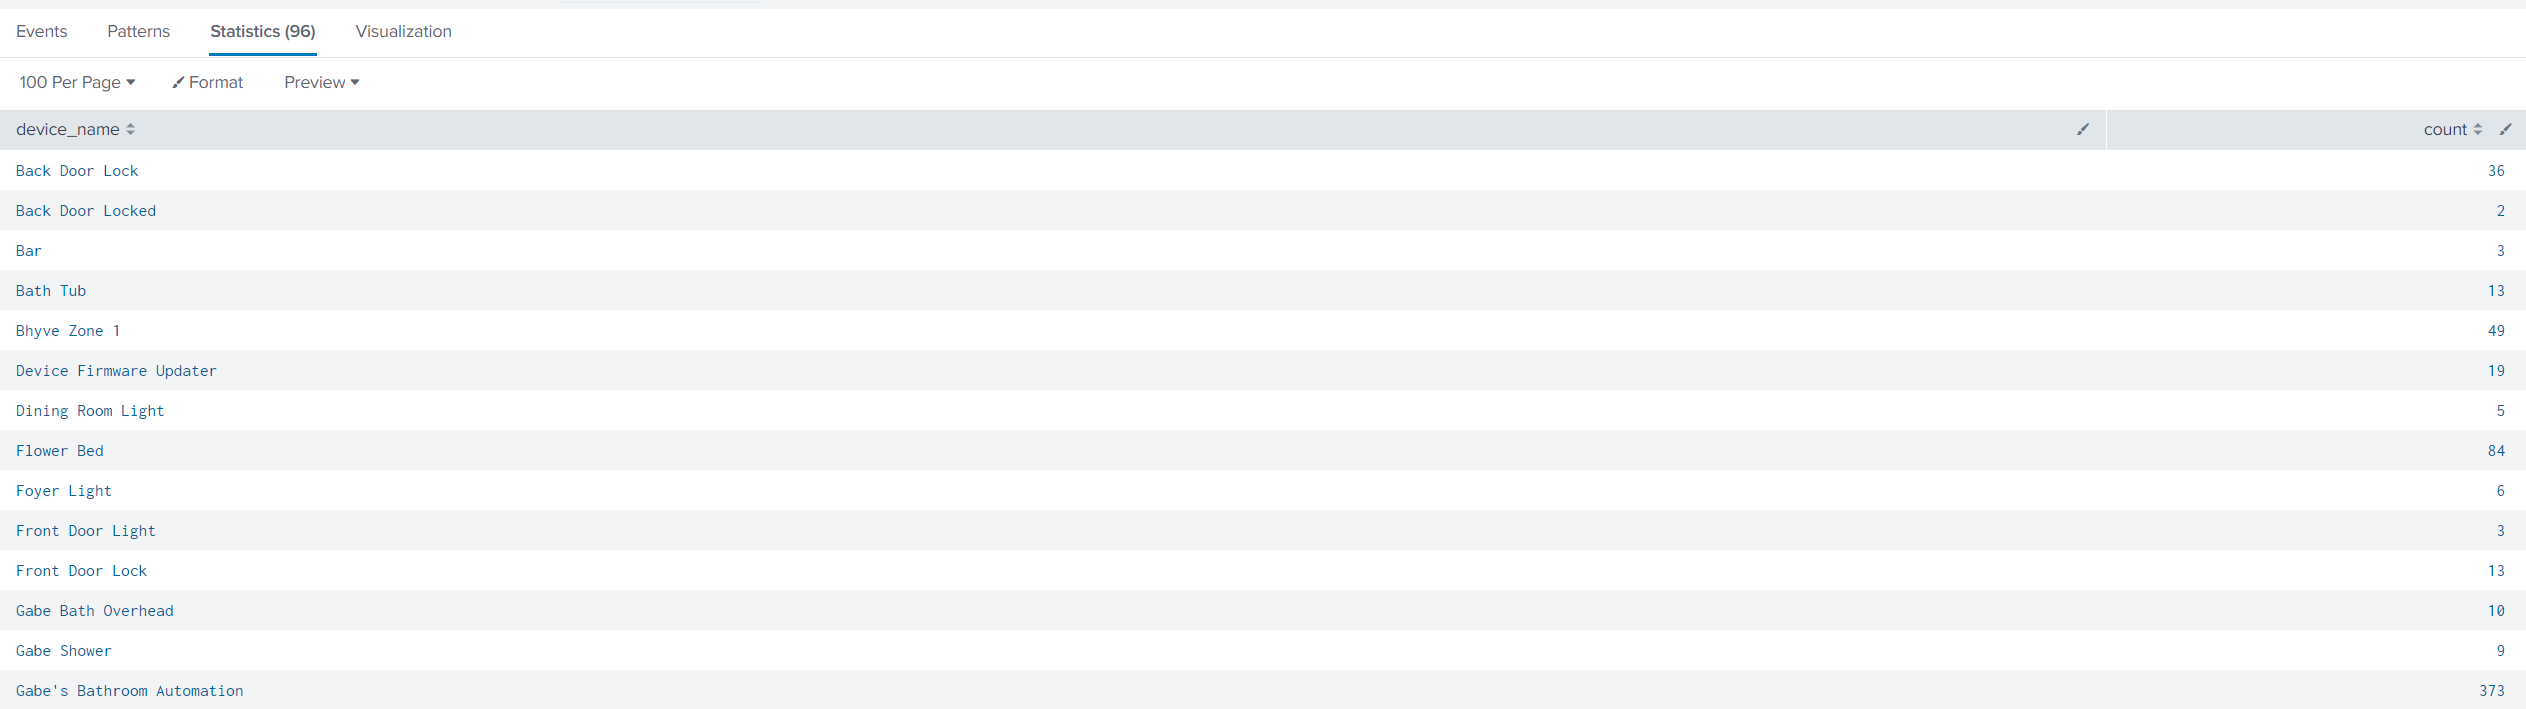
Click on "Start Searching" and make sure you're seeing the logs. NOTE: It may take a minute for anything to populate depending on how busy your hub is.
To take it a step further, we can setup field extractions. This makes searching and displaying results a lot easier. Instead of scrolling through raw logs, we can pull out just the information we really want to see.
Basic Log Extractions
Select "Settings" in the top right.
Select "Fields" from the dropdown.
Click "Add new" next to "Field Extractions".
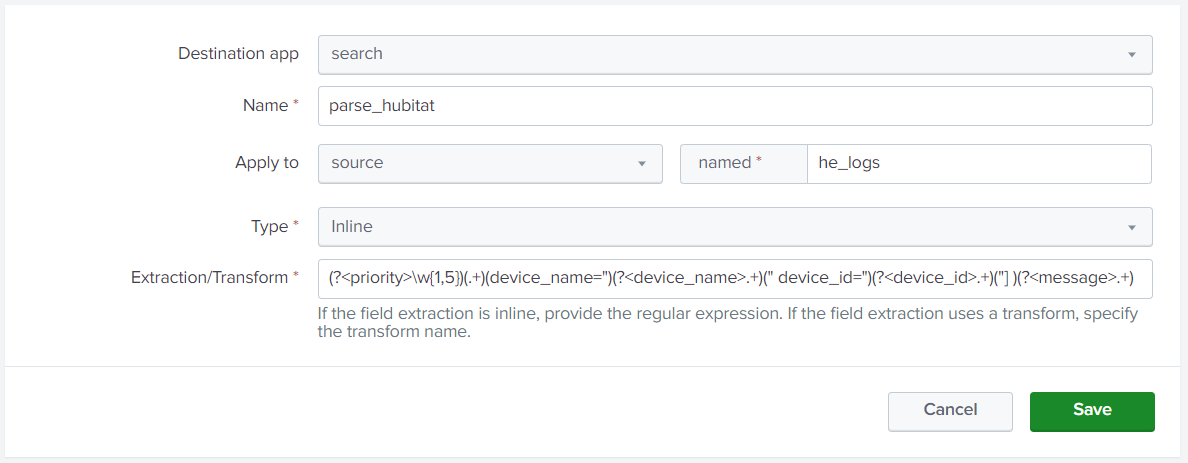
Give the extraction a name. This can be anything as it's not used anywhere except here.
For "Apply to"; select "source" from the dropdown and type out the source name you set for data input in Splunk (Step 6 in the Splunk setup).
Paste this regex into the "Extraction/Transform" field: (?<priority>\w{1,5})(.+)(device_name=")(?<device_name>.+)(" device_id=")(?<device_id>.+)("] )(?<message>.+)
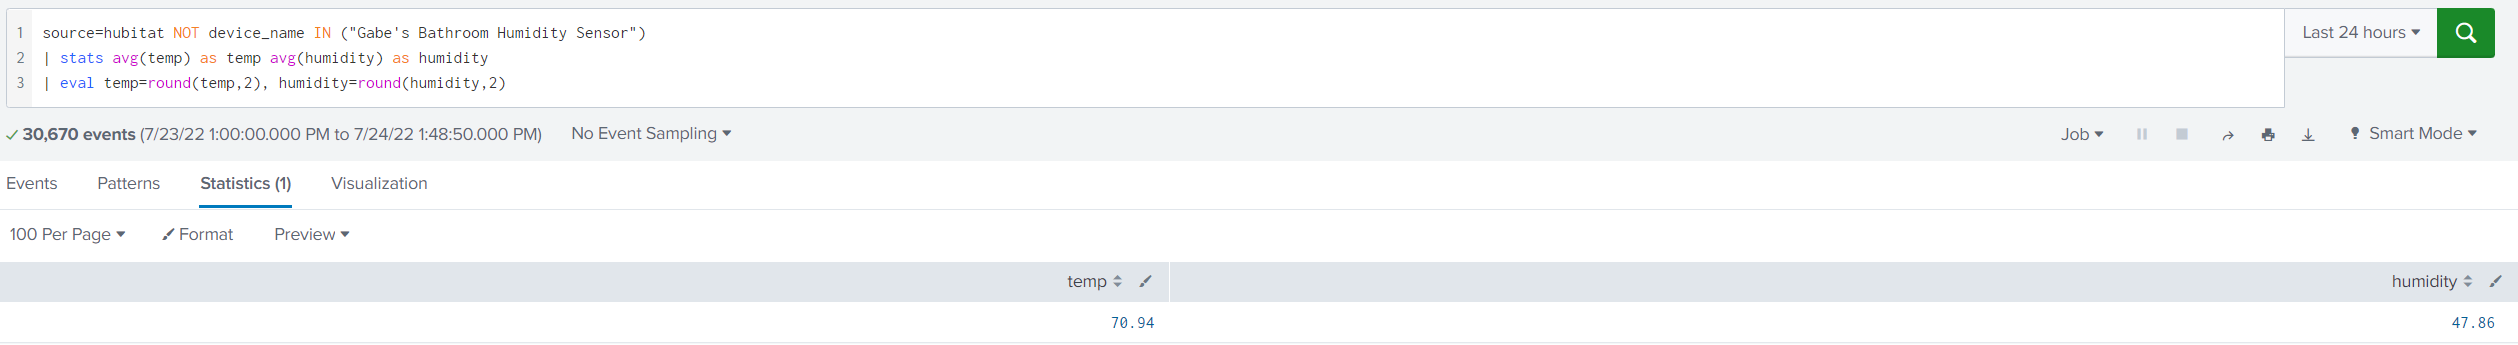
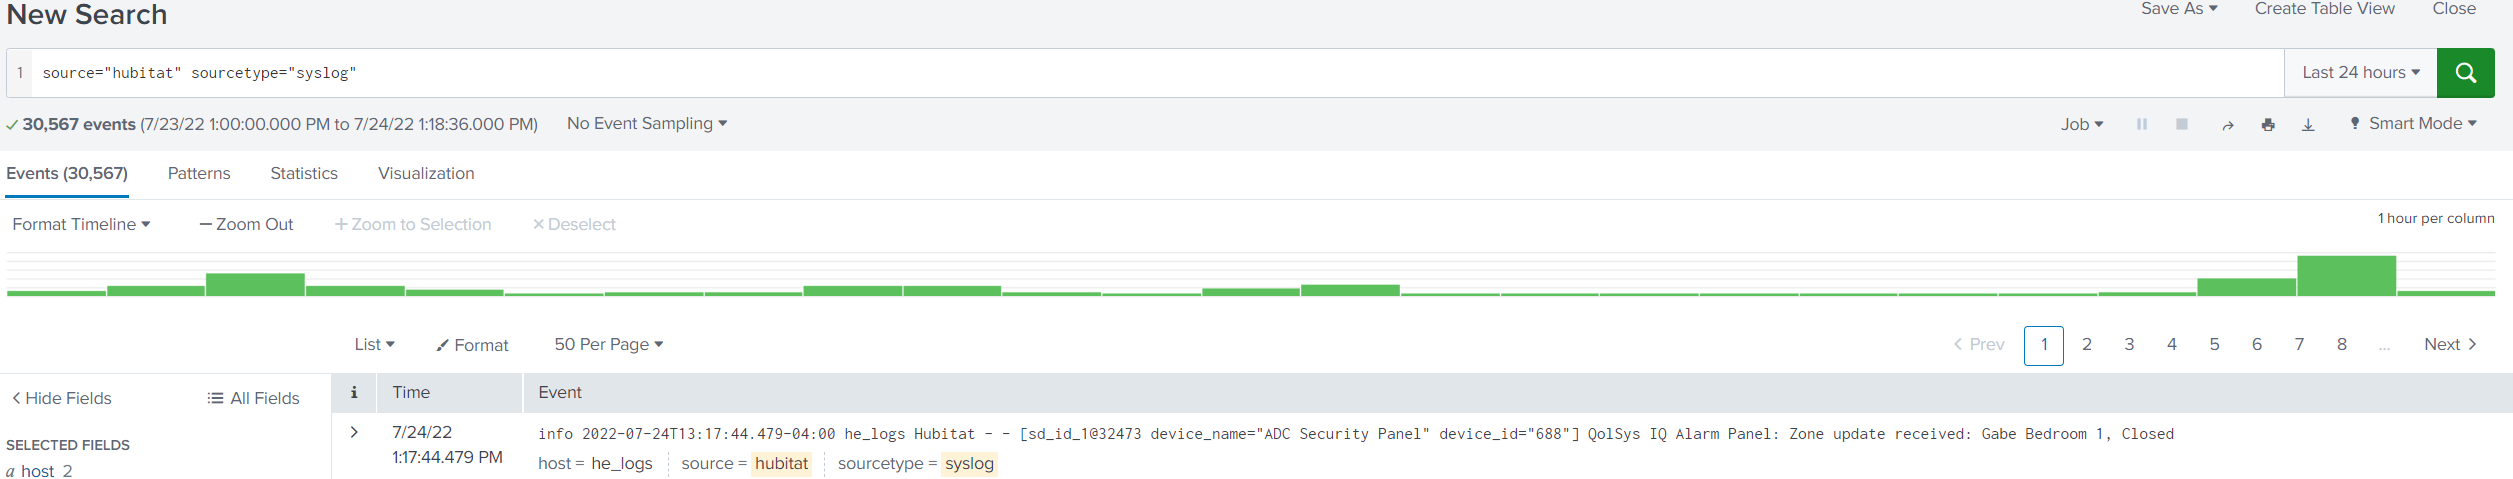
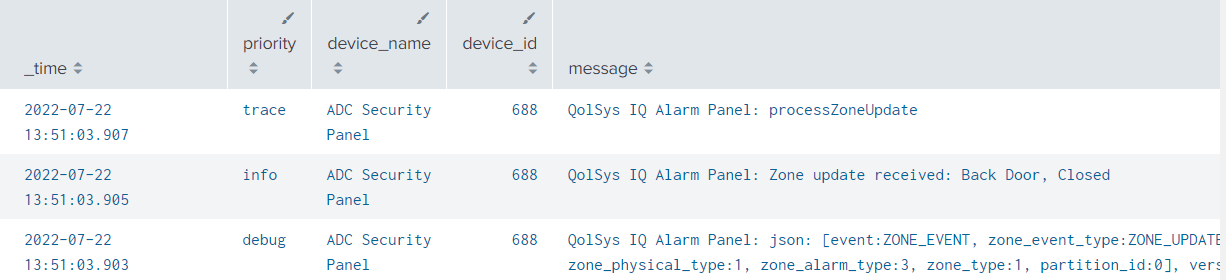
Run a test search and verify the fields are all populated. NOTE: Be sure to change 'source=hubitat' to whatever your source name is. NOTE: The '_time' field is auto-extracted, so you don't need to do anything special for it.
This will get allow Splunk to pull the attribute values for battery, humidity, temperature, and power. I've written this based on what I'm looking for with my logs. If you would like to see additional attributes, provide a raw log snippet that contains it and I'll get you an updated regex.
Repeat steps 1-5 above.
At step 6, paste this regex in instead: ((battery is )(?<battery>\d{1,3})(%))|(((Humidity|moisture) is )(?<humidity>\w{2,3})(%))|(((Temperature|temperature) is )(?<temp>\d{2}.\d{1,2})(°F))|((power is )(?<power>\d{2,3}.\d{3})( W))|((was turned )(?<on_off>\w{2,3}))
Re-rerun your search. NOTE: The field value will be blank if that value didn't exist in the log message. You can sort by the different fields to verify they are populating where expected.
If you're unfamiliar with using Splunk, here is a video playlist that covers some of the fundamentals. NOTE: Alerting is not available with the free license.
Also, Splunk has a pretty well written knowledge base and they also have a community forum like this one with some really helpful folks.
The field extractions are written with regular expressions. If you'd like to try your hand, the regex101 site is pretty handy for testing and helping figure out what you did wrong .
Apologies on bumping an old thread, but as I was just linked to it from elsewhere, figured I’d add my .02.
I’m making use of splunk as well for Hubitat data, the main difference for me is that the driver I threw together is making use of Splunk’s HEC data input. This is an HTTP based input that can take whatever data you want to send. One of the benefits over a syslog input is that you can more easily configure a sourcetype on a per log basis. You can also more easily send over data in JSON form and save yourself some field extraction effort (granted you could send json via syslog as well, you just have the syslog header to deal with). Overall I’ve found HEC to be easier to work with.
If I ever have some time, I should clean up my HEC driver and post it for public consumption. At the moment it is hacked together just for my needs.
If you decide to publish your driver, drop a comment here. I'll give it a test drive and add it to the writeup unless you cover that in a thread yourself.
@anon47916022 I just got Splunk up and running with your instructions and syslog driver. So far I can see it working so that's awesome.
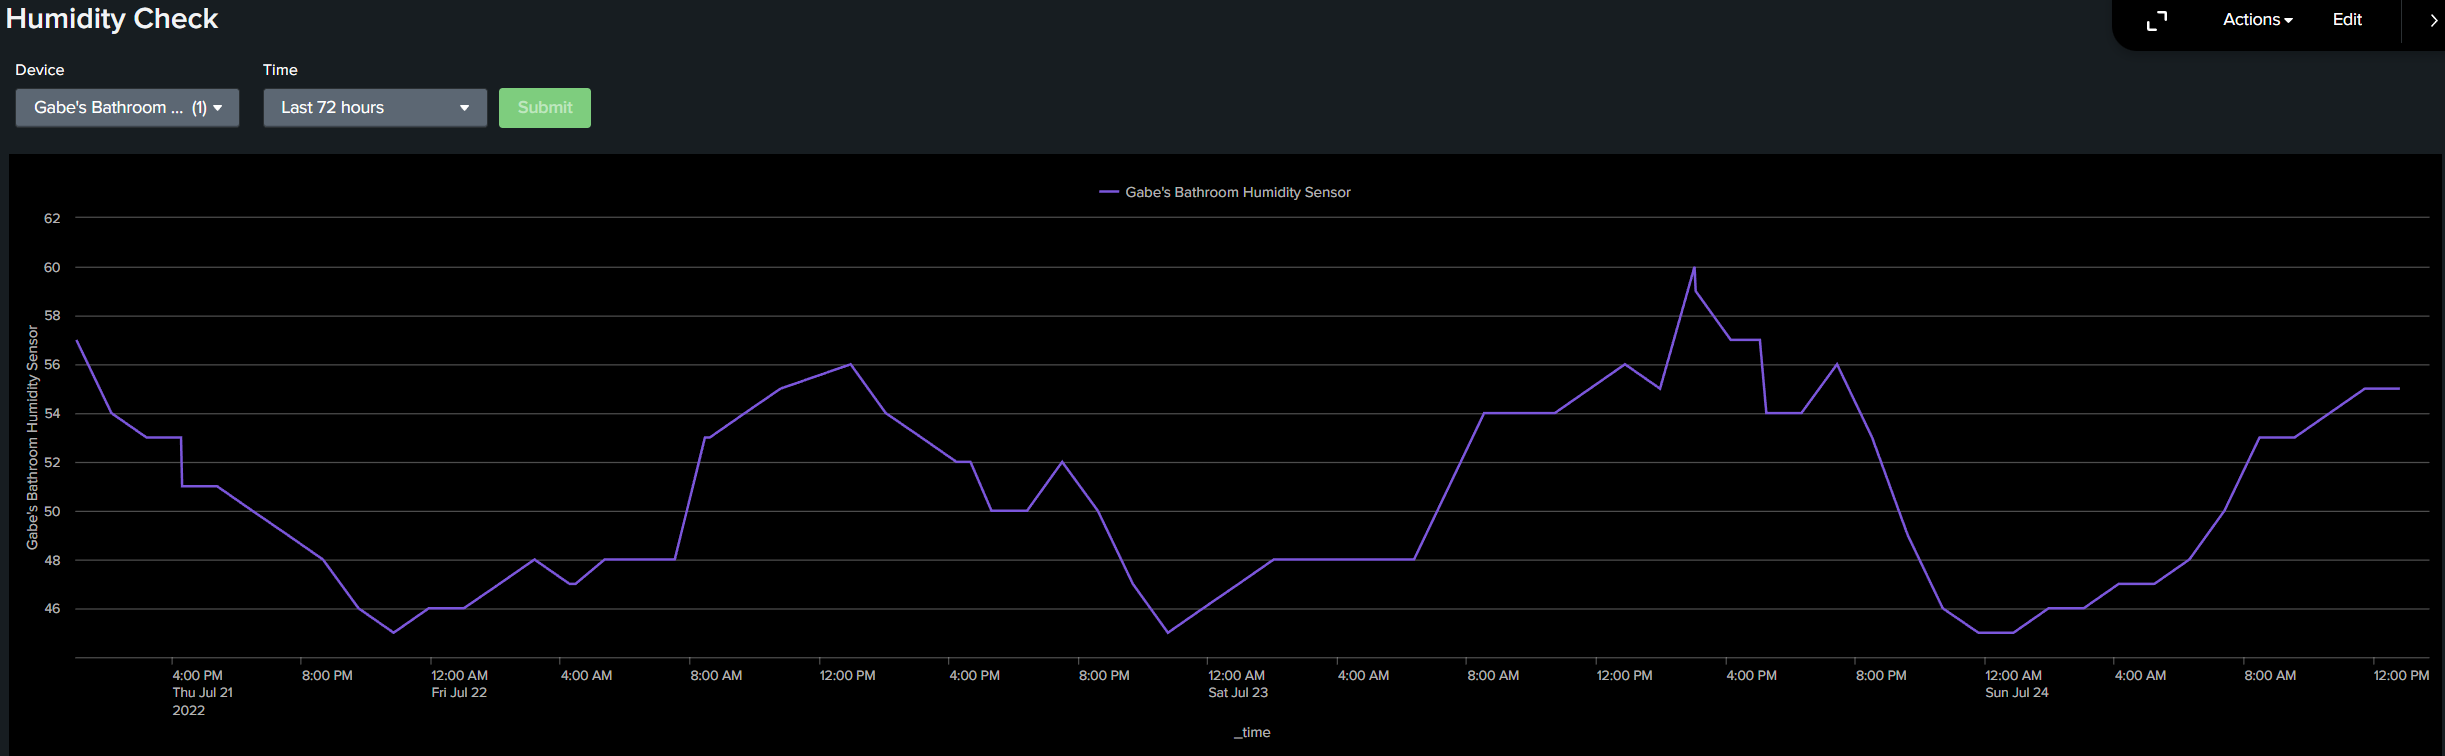
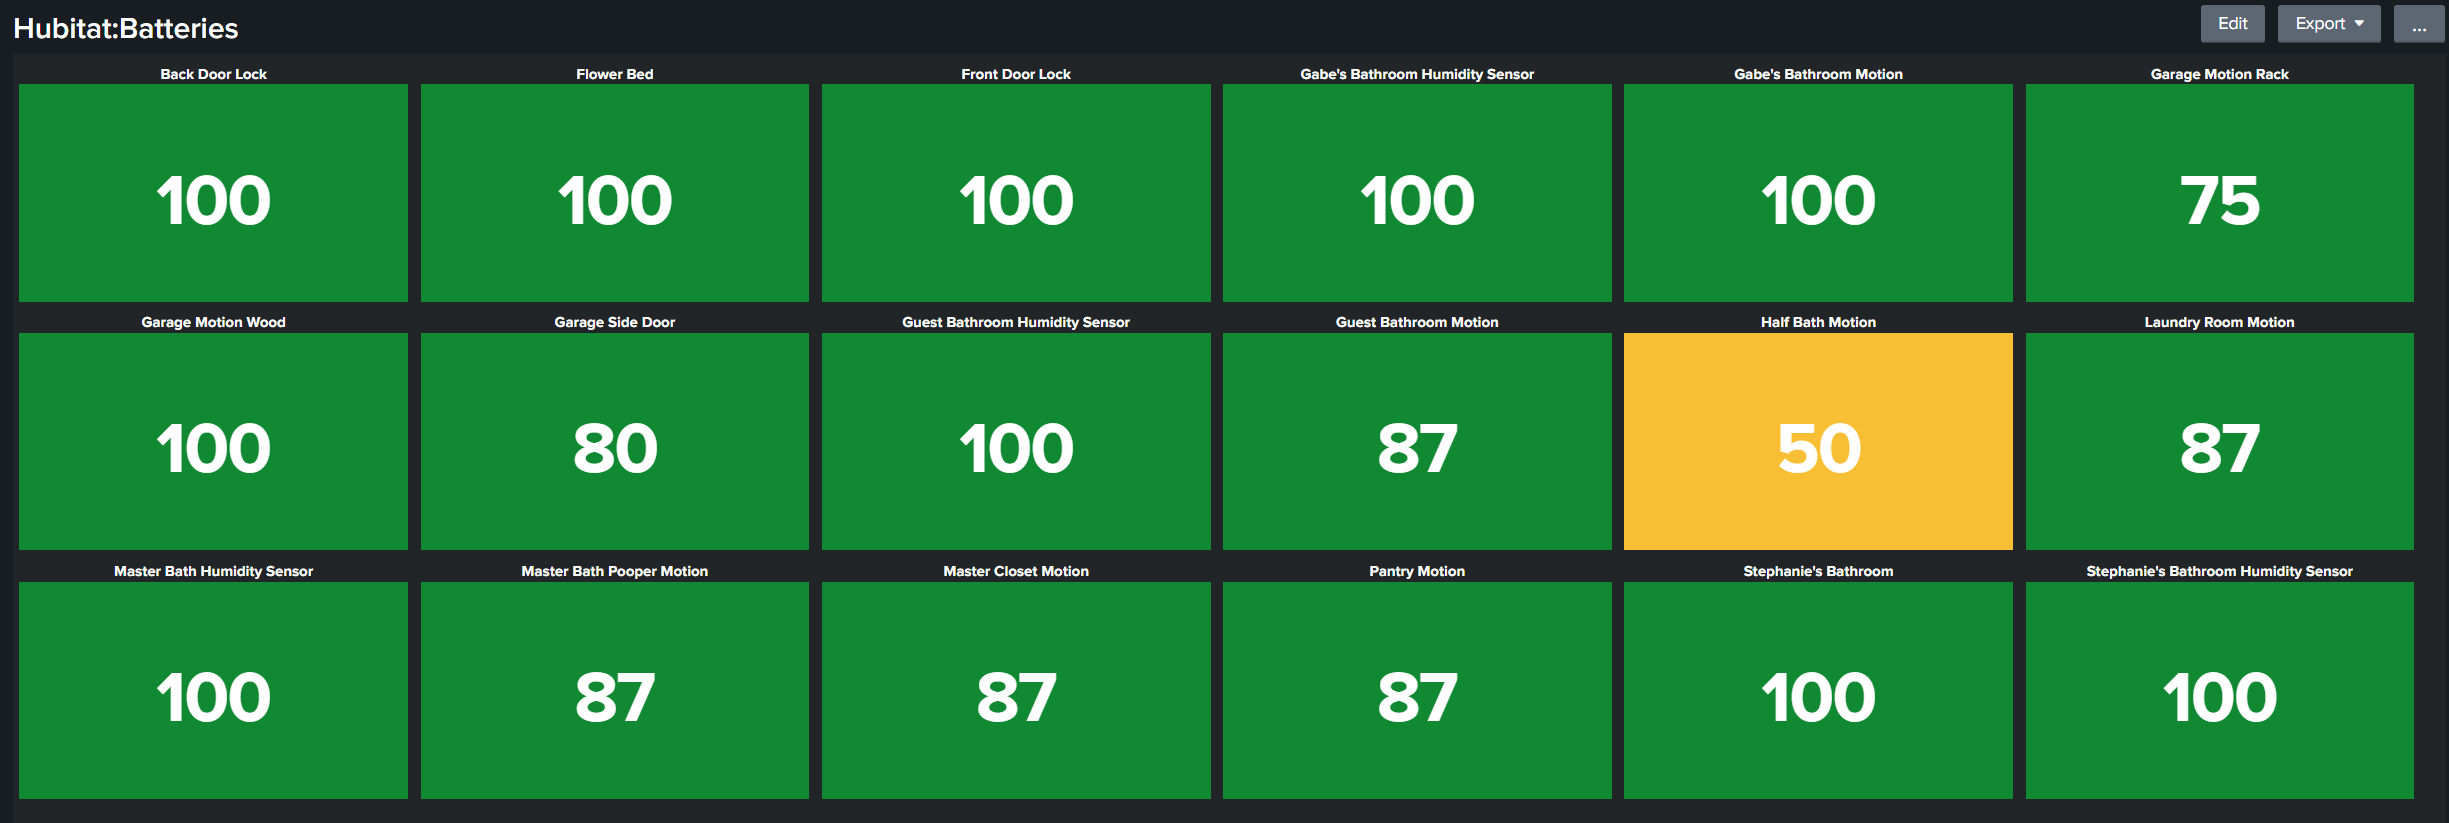
If you feel like showing how you made those dashboards (like battery level) that would be awesome. In the meantime I have some videos to watch it seems!
Hi @anon47916022, I'm in the process of setting this up - got the HE syslog driver installed on my hub, and despite zero exposure to Splunk it looks like I've got it succesfully installed in a Docker container on my Synology NAS, since the login and configuration pages are all displaying correctly.
But I am stuck at your Step 7 - the selections on my system seem different than what's displayed in your (partial) screenshot, and I can't seen to get the "Select Source Type" pulldown menu to stick with "Operating System", thus "syslog" is not an option. (Have tried multiple browsers.) Has Splunk changed their configuration process since you published your guide? If so, any clues as to the right procedure to set this configuration parameters on the updated page?
@anon47916022 Thanks for this. I just set it up and I am playing with it. I also added it to my unraid server. Still teaching myself the attribute extractions.
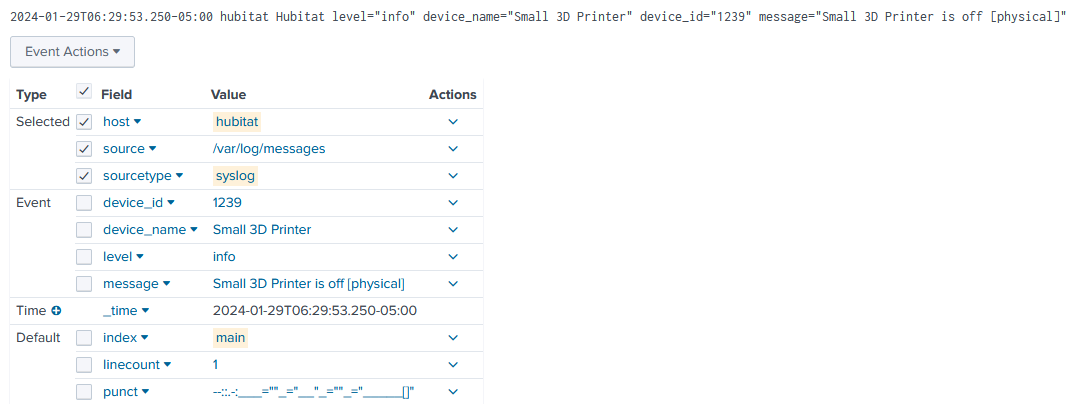
I noticed when I was trying this out that the messages the driver sends aren't Syslog compatible (RFC5424). In particular not having the facility/priority value at the beginning makes my log server (rsyslog) quite unhappy, with doubled dates, misparsed data, etc.
I have adjusted the logging string to be RFC compatible, which seems to have made rsyslog much, much happier with the data. Additionally, I dropped using structured data mode as not all log servers handle it properly/identically, which makes parsing it harder.
Additionally, the simple "key=value" format is parsed automatically by Splunk:
 .
. .
.