I installed the Hub Information Driver mentioned in this post: [RELEASE] Hub Information Driver, but I can't figure out how to actually use it.  The linked forum post talks about using it to track CPU temperatures, etc, so it could be quite useful. I know I should make an app for it, but I'm not sure how to get started. Do I code my own app with groovy, or is it linked somehow to rules in an existing app?
Create a Virtual Device of any type. then change the driver to use the Hub Information Driver.
Create a device under the Devices menu: Add Device: Virtual
Then, click Type and scroll down until you find the Hub Information driver.
Once you have installed the code, create a virtual device with it (in the Device Tab) using the driver as the Device Type, and hit Configure to populate some initial values. Then go down into the Preferences section, turn on polling for the attributes you’d like to have tracked, enter a polling rate (in seconds - I’d recommend 600), and click save. If you want to see the values on a dashboard tile turn on the preference to create the html attribute, use an attribute tile template to display it.
The device can now be used by any rules engine (RM, webCoRE, etc.) or you can export the values as they change into something like InfluxDB and Grafana to produce graphs of the changes.
Ahhh, thank-you for your answers! That was too easy. 
And if you use security (which you should), make sure you select that in the driver's preferences, hit save, and then enter your hub username/password, and hit save again.
This looks really good - I have installed the driver I just do not understand how to get the data to display in a Dashboard. Can you please provide some guidance on that part of the process? Thank you
Attributes.... do I win the prize for quickest response... ?
Depends on the type of dashboard your are using, are you using an old-school dashboard or Ez-Dashboard?
If you've turned on the generate HTML in preferences it will create an html attribute that can be used with the Attribute Tile type in the dashboard. The HTML output is controlled by a text file in the File Manager (default file name is hubinfo.res) you can edit that and add/remove attribute and associated text.
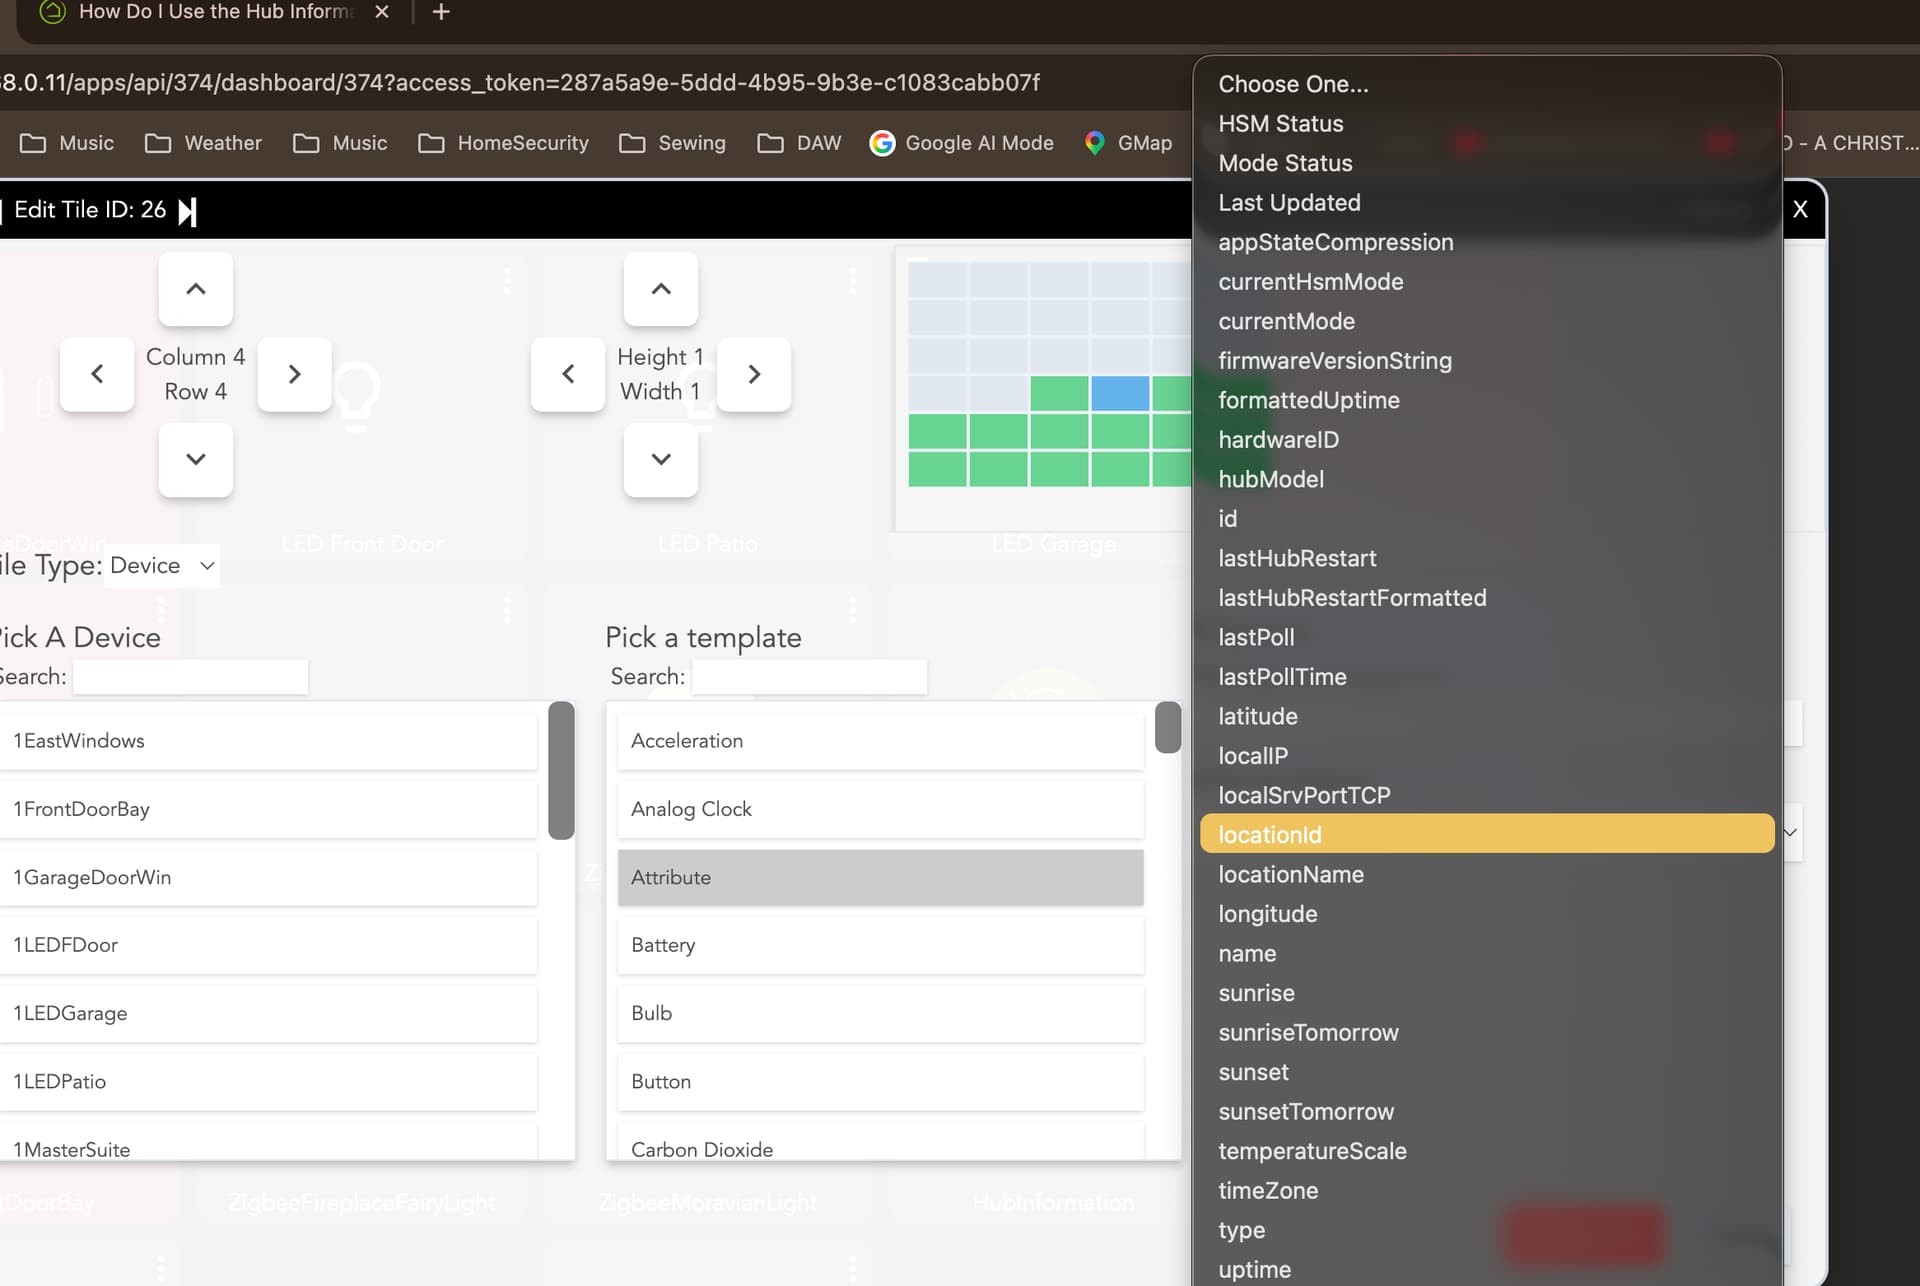
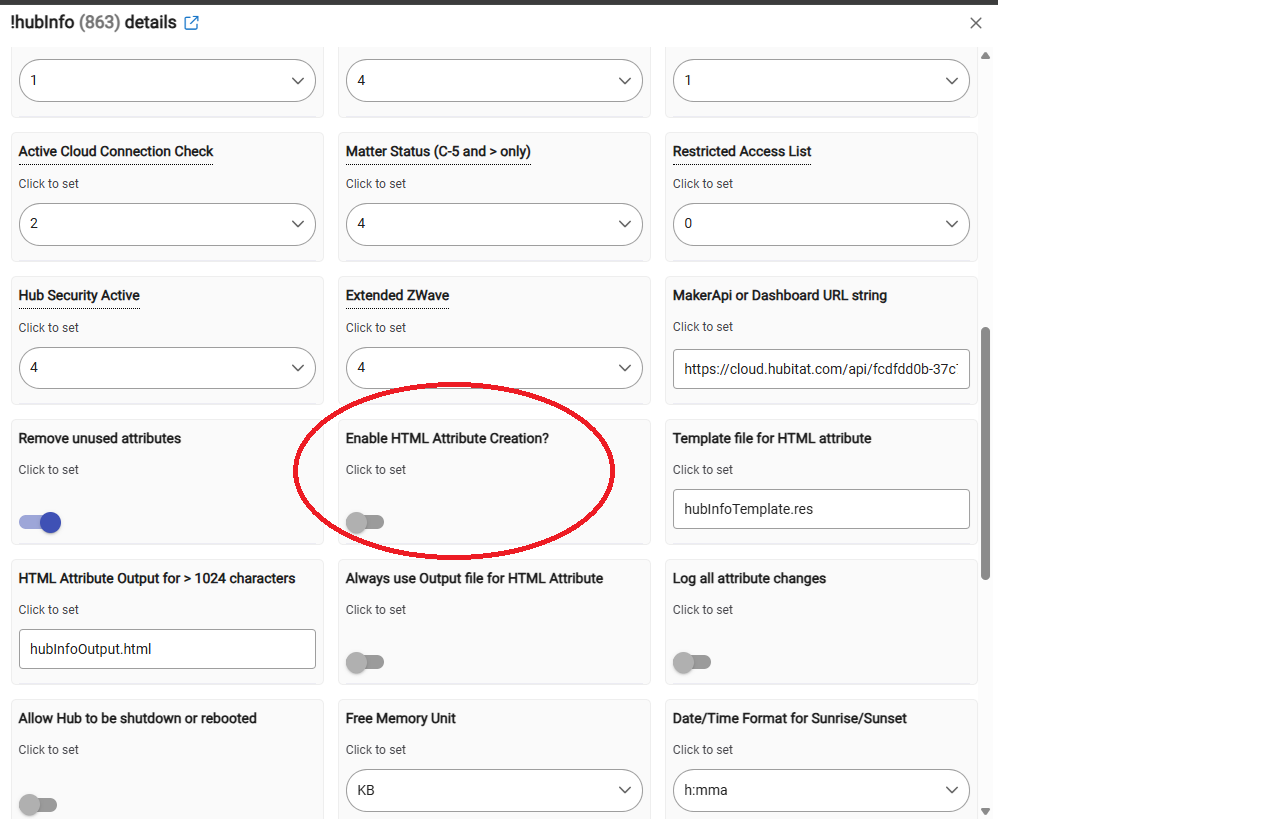
Ah, thanks. I am sooooo close. I just do not see how to enable the attributes so the panel will display CPU Load, Memory, DB size, etc. There is obviously a toggle I am missing somewhere?
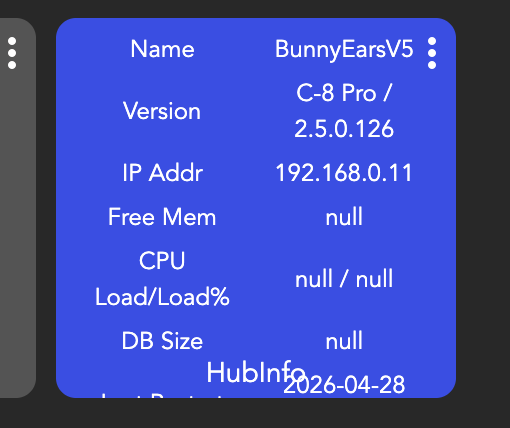

Ta Da! Functioning perfectly. Thank you so much - my dashboard has risen to a new level of usefulness! I appreciate your time!