HELP! Within the past few weeks, I've noticed that my Hub has started to REALLY slow down.... then it seems to stop or crash. I've had to reboot multiple times and even Soft Reboot and restore from backups. I use webcore for the automation. This morning, I woke up to find that none of the lights (based on motion sensors) were working, but the automated blinds (based on timing) still are. I get an Error 500 if I try to log into the Hub, but I was able to finally get in and get some logs. It seems like the initial error starts and then uses up all of the Hub's resources and slow everything to a crawl. . I've sent this to support@hubitat.com and I'm waiting to hear back. It looks like the Life360 connection.... which I re-installed a few days ago last time I had an issue. Anyone have any ideas here?
Thank you!!
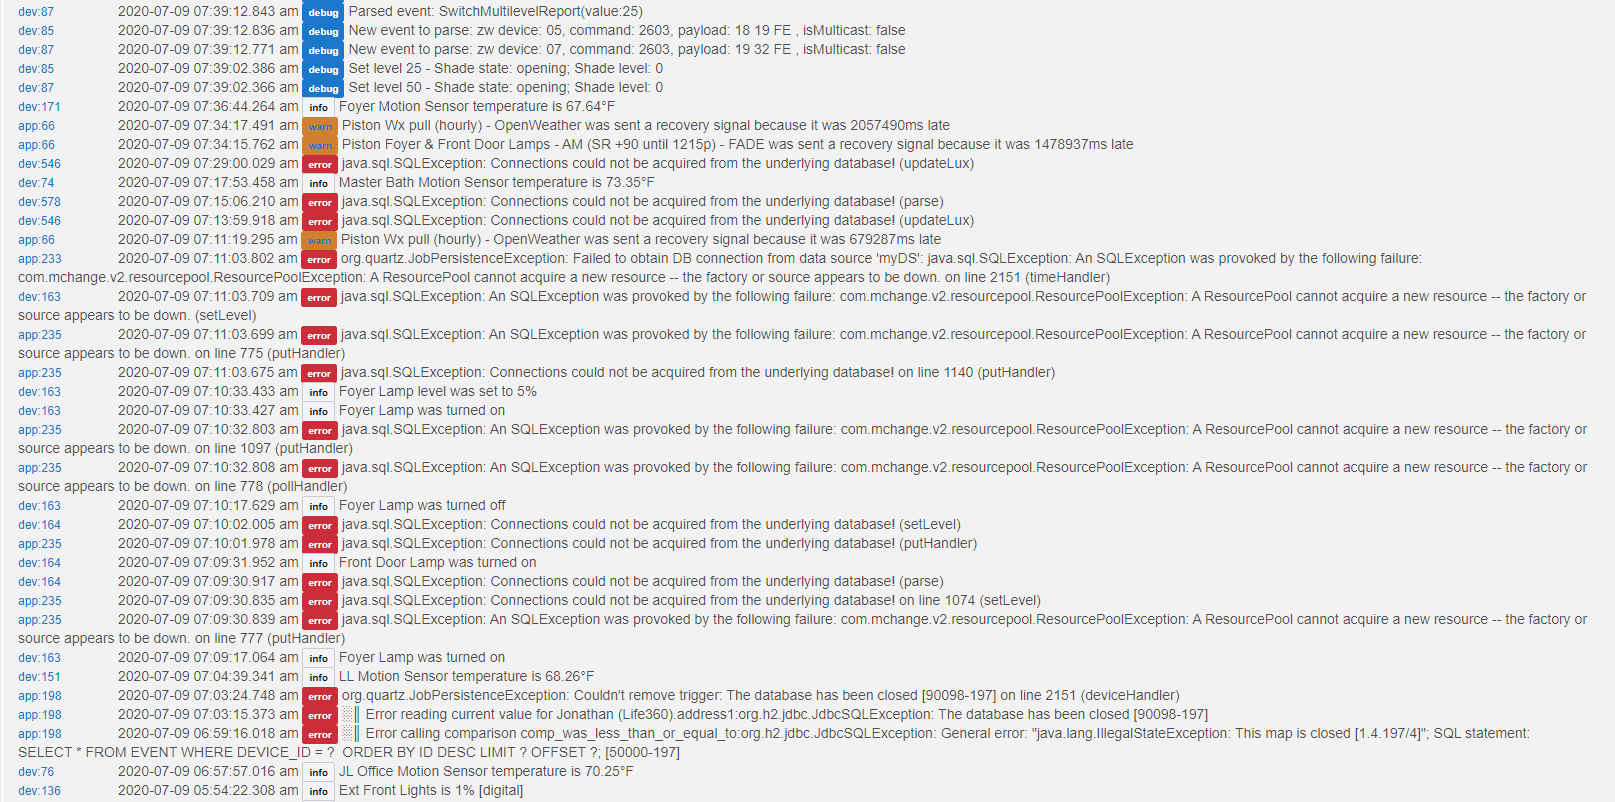
This seems to be the initial error that starts the chain reaction: app:1982020-07-09 07:03:24.748 am errororg.quartz.JobPersistenceException: Couldn't remove trigger: The database has been closed [90098-197] on line 2151 (deviceHandler)
app:1982020-07-09 07:03:15.373 am error░║ Error reading current value for Jonathan (Life360).address1:org.h2.jdbc.JdbcSQLException: The database has been closed [90098-197]
app:1982020-07-09 06:59:16.018 am error░║ Error calling comparison comp_was_less_than_or_equal_to:org.h2.jdbc.JdbcSQLException: General error: "java.lang.IllegalStateException: This map is closed [1.4.197/4]"; SQL statement: SELECT * FROM EVENT WHERE DEVICE_ID = ? ORDER BY ID DESC LIMIT ? OFFSET ?; [50000-197]
I really doubt it is my Life360 app crashing your hub as a lot of people use this, including me without issue. That error is saying that 'The Database is Closed'. Which is causing Life360 to throw an error.
To be safe, uninstall Life360 completely and see how it goes.
On a side note, you did mention a keyword that always signals a red flag, webCore. I know it's come a long way but ...
Thanks @bptworld, I'm not saying it is your app causing this error. It's just the first error in the chain; so I figured I'd ask you if you had any ideas. So with the "The Database is Closed" message, is that referring to the Hub database then? If so I'm assuming that your app doesn't have any control over that?
I agree with @bptworld. I use life360 with no issues. I loved webcore too, but perhaps you might disable the app and see if the errors continue? If you submit a support ticket, they will ask you to disable all 3rd party integrations one at a time to try to isolate the problem. On a side note, did you try a soft reset to eliminate database corruption to be the issue? What other devices do you have connected? What other 3rd party apps do you have runing? Are you polling power? If something is really chatty on your hub, you'll lock it up and crash it if it's too much to handle. try disable text logging on devices to cut down on the traffic. Kill the polling on the power plugs if you are doing that. There are so many things that can contribute to this.
[EDIT]
As a side note, you probably won't see much of a response from support on this until you perform some of the troubleshooting steps I listed above. LIKE disabling 3rd party integrations to eliminate that avenue.
Thanks for your reply @april.brandt. I will start disabling 3rd party apps and see if the errors continue. I have successfully Soft Reset and restored with a backup a few times now; I was hoping that would solve the issue, but unfortunately it has not. I was hoping that deciphering the error message would give me a better starting point as to where to look for the problem; I assumed it might have something to do with Life360 because that's where the error was thrown. Additionally, I've got multiple pistons that rely on the Life360 app, so disabling it will be a very time consuming thing because I must also pull the references to it from all of code in the pistons too. I'll start plugging away... speaking of plugs -- no power plug polling going on. One last thing-- Unfortunately, this isn't an error that is thrown immediately... it usually takes a few days, so that also adds to the difficulty of trying to track it down
this is indicative of something being very chatty or something using a lot of resources in your hub. I joined HE about 3 years ago, so in the beginning when the big WebCoRE toss up happened. It was so, so stressful. At that point, I started migrating my rules over to RuleMachine 2.0
Now, we're into Rule Machine 4.0. Although I have pulled my rules over to node red on a rasberry pi with some success, I was a WebCoRE fan and I gained that functionality back with node red. I still have all of my rules in Rule Machine ICE. And I used them last week when my pi crashed, but I don't get the lock ups and slow downs any more. I can't say for sure that it's your issue, but if you want to check that avenue, I and others are willing to help you create some rules in rule machine to help to facilitate being able to add those checkmarks to that troubleshooting list. Also, I've recently learned that the echo skills are putting some hurt on the hub. You could start there and leave webcore for last. Chatty devices. Any xiaomi's or crees connected? Take a look at your pistons. Are they really complex? Maybe find some that you can do without. Preferably the resource intensive ones until the beast pops it's ugly head up.
Also, let's look at the strength of your mesh. I have locks that gave me grief. You can experience the same issues if your mesh is struggling to communicate with other devices. It seems to slow everything down and mask itself as a rule or chatty device. Do you have any locks in your mesh or things that seem to fall off or struggle to update in your dashboards? This is something to pay attention to. They'll communicate at first and then start struggling. Most common are locks. Is there any radio or network interference. Two hubs on the same channel? Have you checked these things? You can't change the channels in smartthings, but most people leave them hooked up for other integrations. Make sure that they're not talking over your hub.
Ok .. I have a ton of possibilities running through my noggin. So, where do YOU want to start with this?
I wish there was a resource monitor within Hubitat that would allow for monitoring CPU and memory utilization, etc... I'm going to start removing most of the "description logging" that I have on right now-- and there's a bunch of that going on... so that might be hogging a ton of resources. It's a double-edged sword though- I like knowing what's happening on the Hub, but of course, I don't want to overwhelm the hub either... I don't have any door locks and the strength of the mesh should be good. I'll check on the overlapping of the channels though- good idea! So when you mentioned using Node Red on a Pi, what software are you running your rules on? It's not webcore-right? I've only seen Node Red for Home Assistant.
P.S. - no xiaomi's or crees or Alexa connected to my network. I do have Google connected and I will get a timeout error thrown from time to time on that though. But it seems to correct itself quickly afterwards.
Yes, I have a rasberry pi running node red and connected to hubitat through Maker API. I'm certainly not the expert on Node Red and Rule machine runs just fine and I had great success with it. I just prefer the challenges and to tinker, so I moved into node red and fell in love again. You can watch the flows run. There's an extensive thread here if you search node red. The benefit of using it is that you're pulling the processing away from the hub and leaving the hub to do other things more efficiently. That way your more complex automation rules are processing elsewhere.
Just a note.
You will a lot of people on here running webCoRE, myself being one, with no issues.
If you do have a lot of logging running as you seem to suggest above, I would stop that first and see if things improve.
As a run of thumb, I only have logging running on newly installed devices or apps just in case there are issues and I can see whats happening.
I then turn it off.
It might be a good starting point.
Good luck........
I definitely agree with this and that's why I brought up other things to troubleshoot first. There are lots of people using WebCoRE with great success. But, also @bobbles, I know your skillset. So the long list of troubleshooting definitely moved WebCoRE closer to the bottom of the troubleshooting list, but can't be immediately eliminated. For now.
Yep, I love webCoRE! I'm going to turn off all device logging and see if that makes a difference. I started noticing this slowdown after I modified many of the light pistons to include "Fade level to X% in X minutes" versus "Set Level to X%" - I then noticed a good bit more logging of the these lighting levels. That may be the root issue.
I find in currently releases, recompiling larger programs can hasten some hub slow downs.
I usually schedule a restart or reboot after recompilation of larger programs - this is reloading the code and hitting save, or using package manager.
I hear in the new HE releases (in beta now) that this is improving.
I don't think flash command would cause this unless the device in question has a problem. But that said it is hard to see data to root cause some of this.
If you are running the latest webcore, you can PM me and we can look at some additional data that while won't provide all the data, can expand/narrow possible theories...