Hey Alexd51, my post isn't very well formatted and I added "Current_Consumption" and "Current_ACT_Consumption" as a custom attribute. Current ACT is the first attribute minus the solar production. I just created a github to share the modified full driver code. Hope that helps!
Here is a link to the full modified driver (Hopefully I did that right)...
So just so I don't screw up. Disable or delete the old driver and install your driver?
Just got my system online. Company screwed up and didn't install the CT for power used or power sent back to the grid. Waiting for them to arrive and they come by and install.
Yeah, this would replace the existing driver. Production should be able to be tracked via the inverters and reported by the driver but consumption/power export requires the current CTs installed around each phase of the main wires and the functionality enabled through the installer portal... The enlighten app has some pretty cool graphs once this functionality is enabled for consumption/power export, but I use hubitat for seeing instantaneous consumption and alerts when meter goes backward...
Hello sir. Finally got my CT's installed. Consumption is showing.
How do you monitor "seeing instantaneous consumption and alerts when meter goes backward"?
Ok, so I have the device and app installed and have been able to see the power consumption number etc.
The next thing I need is based on a problem... I have a breaker that has tripped twice on the system causing half of my array to stop working (I.e. reporting).
Anyone figured out how to have Hubitat monitor the system for errors and notify you when something is wrong?
My hope is that I can get an alert to check the system/app to see the problem.
By the way, I really appreciate all the help you guys have already given me with what you have already posted!
So I have an Enphase system for 1 year now. Since day one I have had a panel that underperforms (producing ~65%) compared to all it's neighbor panels.
We have watched for shading and there appears to be nothing interfering.
My installer and I have verified all the inverters are installed in the correct order with the app. So we are troubleshooting the correct panel/inverter.
We replaced the panel and the inverter but the production is still low.
Does anyone know if it is possible to monitor the instantaneous watts for a specific panel via the API?
Is it possible there is a bad wire harness that only impacts the one panel?
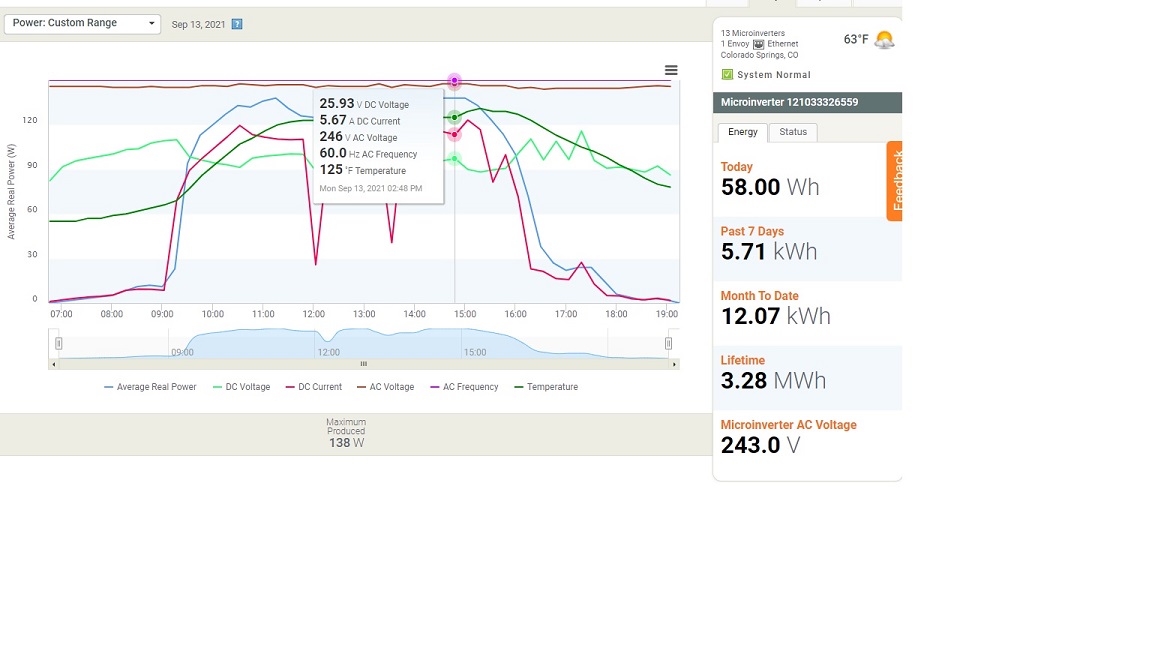
Not instantaneous but if you have installer privs on the enphase web site (your installer should have these privs) then you can get a graph of the inverters performance. This is yesterdays performance graph of a currently failing M190. It cant provide more then 138 watts (common M190 failure). But you can see a DC current and voltage, and AC voltage and power output. Not sure if this will help.
I just had Enphase solar + batteries installed. Download the driver + app and configured according to the instructions.
After a couple days of anxious waiting, I did not get a chart. Looking at the apps log, I see this:
app:3742021-12-30 10:02:18.414 am errorjava.lang.NullPointerException: Cannot get property 'value' on null object on line 910 (method runAutomationEval)
====================================
The driver log showed:
2021-12-30 09:48:05.202 am errorjava.lang.NullPointerException: Cannot invoke method div() on null object on line 238 (method dataCallback)
====================================
I can access the Envoy page from the browser and see the data
Any help is appreciated
Thanks
Andrew
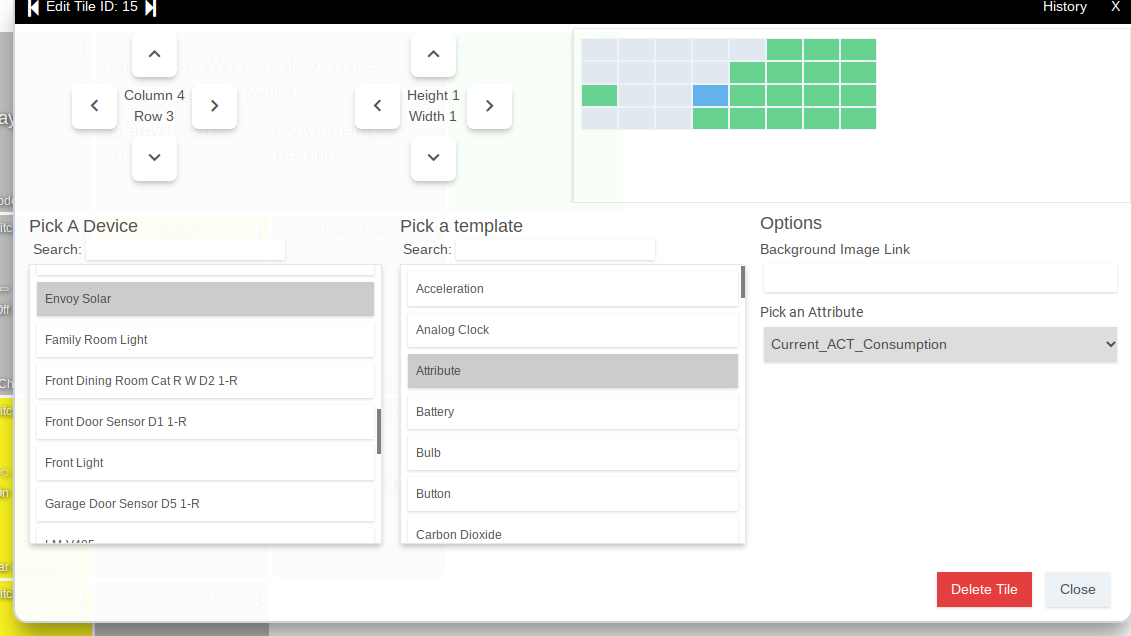
I am finally getting around to trying out this driver. I imported the code from "scott1620 · GitHub" (Is this the correct one to use?) and I got it working right away:
My only question now is what are these attributes? I looked through this thread but it was mostly people arguing about the financial incentives of solar.
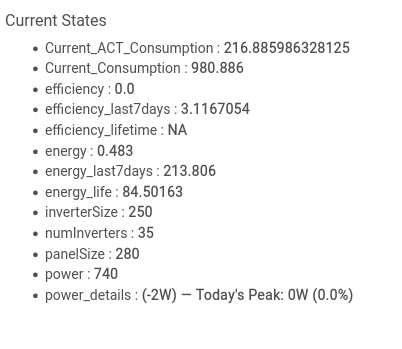
For example: I see "Current ACT Consumption" and "Consumption": I don't have a consumption meter installed on my system so where are these numbers coming from and what do they mean?
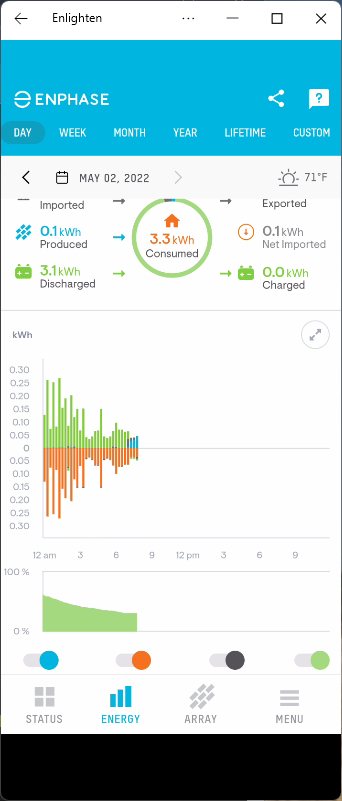
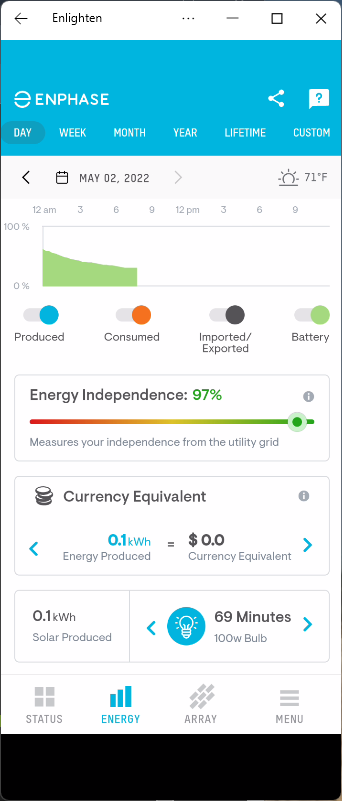
The values come from the Enphase Application. See pictures below. Also, you can see videos explaining the app (and values) at: Enphase App - Bing video
Well first they can't come from the "App" because this driver connects to my local Envoy, not the enlighten cloud service. I have 3 Envoy's and the Enlighten cloud service combines data from all three to display in the App.
I have the app and have been using it for many years. Neither of these consumption numbers show up in the app for me. Presumably because, like I said, I don't have a consumption meter. So without a consumption meter I'm not understanding how these numbers are being derived?
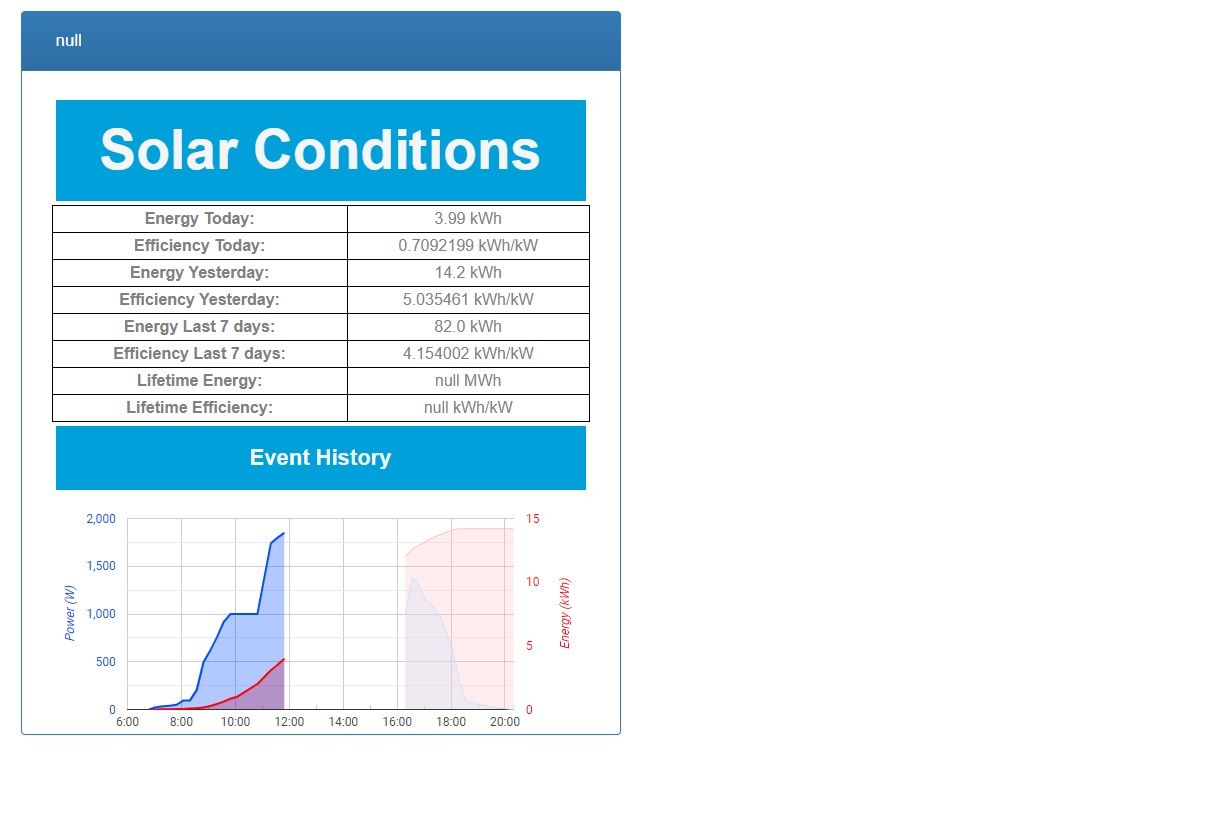
There is also no "efficiency" number in the app. What could that possibly refer to? My efficiency over the last 7 days was 3.12? Lifetime efficiency is "NA"? I looked at the code and I see where this number is being calculated but I'm not sure what information it's trying to portray.
It's also odd that "energy_last7days" is larger than "energy_life". I suspect one is kWh and one is MWh. Not sure if those are expected to be different units.
I'm also curious about the "powerTable" and "energyTable" variables. Looking at the code these seem to be for graphing. And in the thread I see people have posted graphs. How does one set up these graphs?
As you can see: None of these details would be found in your YouTube video about the app.
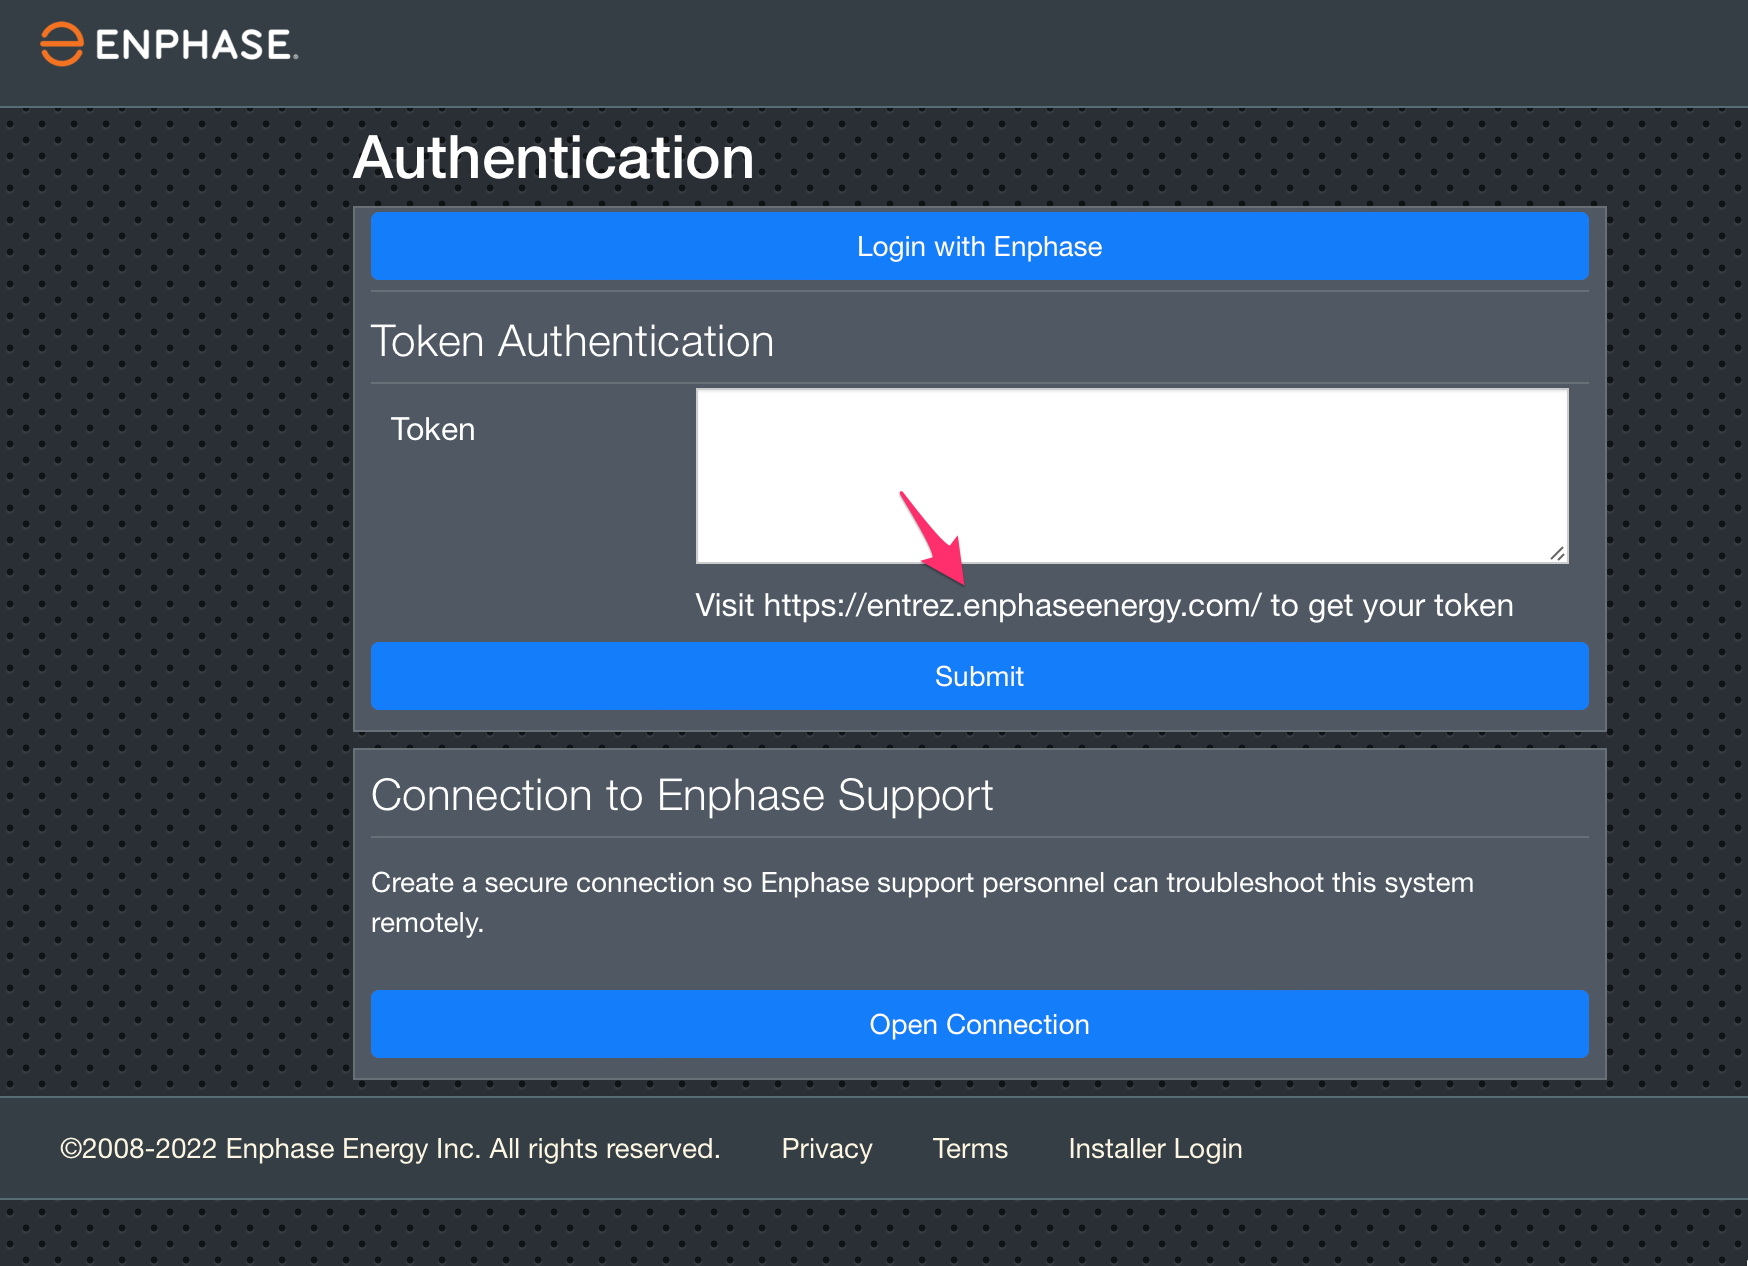
This doesn't seem to work for me because I believe that with the new Envoy systems you cannot access your local device json endpoints without obtaining a token by login into https://entrez.enphaseenergy.com
I am not sure how long lived that token is or how to refresh it (other than going through the UI).
Once I log in, I can obtain a token and can hit the JSON endpoint. I am guessing that other gateways do it differently since you can hit the local endpoint without auth. Any chance someone has solved this issue?
Can someone help, for some reason my Installation Date in "Devices" is showing up as -1. I tried updating the code and it still not populating it. So basically when I look at my Solar Graph App, it shows Null Lifetime and Efficiency.
I am in the process of upgrading the Legacy Envoy to a Envoy-S. So, I thought I would upgrade the Hubitat driver and App. Now my current legacy envoy does not support JSON so it falls back to the HTML code. But after installing the newest driver it appears to be capped at 1000 watts.
I deleted the old App and driver code to install the new.
Once I dropped back to the old driver the power level went to normal.
Since this driver didn't work with my Envoy-S meters due to the new token based authentication method introduces with the new firmware, I have created a simple driver just to pull production data from the Envoy.
Is it possible to pull energy USAGE from the envoy using this? I have the drivers working fine to show me production, but i'd like to have the house usage nice and bold on a dashboard.