Elevated and Severe Hub Loads with v2.3.4

Has the @support_team taken a look at the engineering logs for you?

1 Like

Not since .133 iirc.

I'm now seeing them on my Secondary Hub. That said, it doesn't seem to be causing any noticeable issues as yet.

The weird thing I've just noticed, is on my secondary hub, there's nothing in the logs. On my Primary hub, they show up in the "Location Events" section.

I might be missing something - I am trying to understand what is going on with my Hub performance. Same thing here...no apparent app hugging the CPU. Rebooting would generally remove the "Load elevated" message.

Question - Where do I get this CPU/MEMORY tool / graphic to try to diagnose ? Many people uses different method on this thread... a bit puzzled !

You can get the info using Hub Information Driver V3, then create a virtual device and assign that driver to it. I just have a few dashboard tiles displaying certain attributes but some export the data to influx db and Grafana (I almost sound like I know what I’m talking about :joy:)

2 Likes

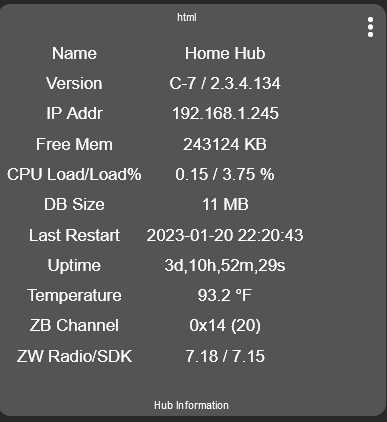
Yeah, for me graphing is the next frontier, but even I could come up with this using [RELEASE] Hub Information Driver v3 .

image

There are many ways to do this so it becomes a matter of preference. My dashboards are created using Home Assistant which requires additional hardware. If you’re just starting out I would stick with devices and integrations that are native to HE.

1 Like

I am new to HE, so I will use this driver - It installed properly, and comprehensive with the little guide included. Just wonder how to get to that Dashboard Tile though :thinking:

Even I did it. It's a snap. Reading the directions link on the device driver helps. Ultimately, on the dashboard, you create a tile with 'html' as a attribute. You have to enable the two relevant toggles on the device page -html and html template...something like that. Don't forget to save preferences like I did. And it just pops into your tile!

edit; It sounds like you already added a virtual device "Device" and changed the driver to Hub Information.

That is the part I was missing -

seems to have only one toggle switch now for HTML attribute generation.

I see it in the dashboard now. Not very familiar with this multi attribute in a tile - I'll need to dig how to do this rather than having one tile per attribute, but If I go in the template I see all the information avalaible from the driver... just need to figure out how to "pretty" display it now :slight_smile:
Thanks

Yeah, you're right, one toggle.

You make sure the device is listed in the dashboard app.
You create a tile, choose the device, pick 'attribute', pick 'html', and voila

You've gotta do some resizing of the tile of course, since it has so much info!

Can also use Dashboard CSS to change style elements, add backgrounds, etc.

1 Like

HUM - must be missing something...... AGAIN ! :roll_eyes:

I'd say you should be good to go.

I'm guessing you've exceeded the displayable attribute limit of 1024 characters.

image

That looks like the default template and should be way under 1024

Bizarre - Same tile - in the dashboard builder - I select CPUpct, it shows value. If I select Attribute HTML the tile displays select attribute...


Are you using the V3 Driver or the original?