I have setup InfluxDB Logger to a Influxdb running on a Raspberry Pi. I've then created a dashboard (see below) within Grafana to display my Energy consumption and Air Source Heat Pump activity.
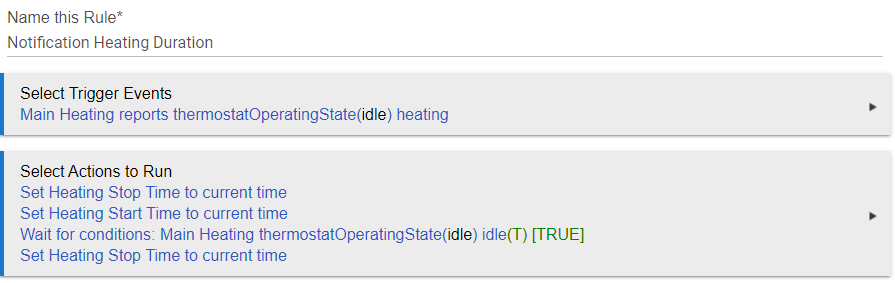
My thermostat is set up to request heat when the house temp drops 0.5C below the thermostat set temp. I would like to display the historical time that the heating system takes to return the home temp back to it's set temp.
My problems:
1/ I can't see an obvious device that can store a time duration (so that Influxdb Logger can export to my database),
2/ Nor can I see an obvious action that can set a variable to the difference between two times.
The first one is the hardest . Take a look at @bptworld's app though as he does a thorough job at analyzing a problem and providing solutions. Can't remember if puts a duration value where you can grab it for Grafana, but if not he might be wiling to add it.


 . Take a look at


