Apps: Click on the Dashboard you want to delete.. scroll down, click the big red Remove button.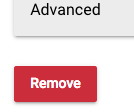
Is anyone else having issues with local dashboards not loading when Hub Login Security is on?
I get this error message:
The web page at https://XX.XX.XX.XX/apps/api/33/dashboard/741?access_token=XXXXXXXX-XXXX-XXXX-XXXX-XXXXXXXXXXXX might be temporarily down or it may have moved permanently to a new web address.
Cloud dashboards work OK. Local also works fine if I disable Hub Login Security.
Please provide your hub version, browser and OS.
Does this also happen on other browsers?
Does this also happen with http instead of https for the local dashboard?
I think its an issue with https - I've got a chrome plugin that forces the use of https when available. If I switch this off and force http it works fine.
Hub ver 2.1.0.123, viewing on Chrome macOS
On Safari using https it won't load the dashboard.
http works fine in all browsers.
Yes, Safari blocks unsigned / self signed certs. Can't do anything at this time to fix that.
Yes, same thing happens with chrome. Looks like the dashboard is embedded in an iframe (or something) from the hub web ui.
Of course allowing users to upload certs would of course fix this ![]()
Yes, the /dashboard url is in an iframe, but you can access directly from the dashboards app and that works just fine over https.
I'll echo the request to have independent font size changes. Though, this might be possible with custom CSS (I'm aware there's a bug where this isn't quite working?)
I have long names unfortunately (working on shortening them...), but regardless, sometimes I want the text at different sizes. E.g., I have a dashboard full of sensors for a completely battery health overview. Frankly, I don't even want the icon. I just need percentage and title/device name. THe name can be a slightly smaller font to accommodate my long names while I want the percentage text larger to quickly see.
@patrick just now noticed this, haven't seen it before and as far as I know nothing changed on my end?
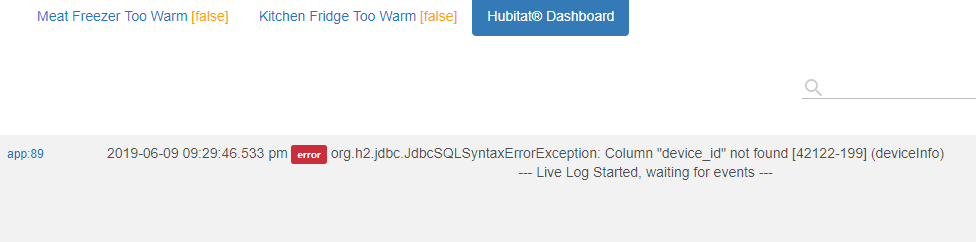
What did you do that throws that error? Exit the app? Load a dashboard? Need a bit more information so I can attempt to reproduce. Does it happen all the time?
Any additional information on steps to reproduce would greatly be appreciated.
That's what is confusing....It's never been thrown before, I literally haven't made any changes (not even turning on any devices) since about 8 hours ago and this was thrown 17 minutes ago, and that only was creating some new rule machine rules. My dashboard stays open in a browser 24/7, along with all 3 of my hubs pages.
Did you delete a device that was on a dashboard by chance?
Nope, nothing .....I've selected the open browser page to view (only) the statuses of devices. That's it. Haven't even clicked on any devices
Is there any way to have a tile do a popup when you click on it?
I really like the way the HSM tile or the Mode tile shows a status and when you click on it, you get a list of commands. I would like to implement something like that on a custom driver.

