I have a virtual switch that toggles on and off when my water softener cycles. I'm at a loss as to how to display the interval between the two most recent on off cycles on the Hubitat regular dashboard. Looking to display the interval in days.
Where is the interval stored? If it is already an attribute in a device, use the Attribute Tile.
If you need to "put" it somewhere, put it in a hub variable connector and use a Variable Tile.
If you need to calculate the days between, I would use Webcore.
That's what I'm trying to generate and display. I have a virtual switch that turns on and the resets each time a water softener cycles. I'm trying to figure out how to display the time between cycles in days. How long is it between times the switch turns on? No history is required. Only the most recent interval is of interest.
Set a hub string variable. Click Create under "Connector" column to make it a connector.
Add the connector device that was created to the dashboard device list.
Create the Webcore Piston:
Add your virtual switch to the devices in Webcore settings
The piston just needs a local datetime variable to capture the off time, then it calculates the duration when it turns back on.
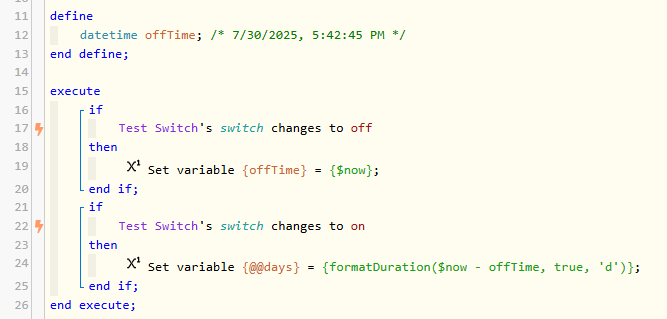
@@days is the hub variable you created, it will be in the global variable list in Webcore automatically.
Create a Variable String tile on the dashboard, and choose the connector device. It will now display the days.
Can you do this in Rule Machine? I don't know, I don't use RM enough to know how it would be done there. Webcore is good to use with time stuff.
Edit: If you have never used Webcore, it is a built-in app you install. Open the app to add devices to use with it.
Go to the dashboard from the app (or just any web browser). You will have to enter a code to give the browser permission. You get that code from "Register a browser" in the app.
From the dashboard, create a new piston. click the space under define to add a variable, choose date & time and give it a name of offTime.
Click "add a new statement" after execute. Choose "Add an If". Choose "Add a condition". Choose your virtual switch from the dropdown by Physical Device(s). Select "switch". Any Interaction, comparison is "changes to" and then compare to value "off"
Click to add a new statement under "then". Choose Location, "Add a Task", then choose "set variable" from the dropdown. Choose the offTime variable you made from the dropdown. For value, change the dropdown to "Expression". In the empty box, type $now. Then save.
Repeat for the the switch changes to on block. In that one, choose the @@global variable you created, and type in the expression -> formatDuration($now - offTime, true, 'd')
Click Save - Then save the piston with Save on the upper right.
Love this community. Thanks for taking the time to walk me through this. I have a bunch of webCoRE graphs on my dashboard so I've got the training wheels managed. This will be a useful adventure ![]() It will be a few days before I can spend some time with this. I'll let you know how it goes.
It will be a few days before I can spend some time with this. I'll let you know how it goes.
Cool. I was going to wait and see if you said something about never using Webcore before, but since there seems to be so few people here that use it, I thought I would just post the details assuming you had not.
I got forced into webCoRE when Hubigraphs died. I really like my dashboard graphs. These and several more.
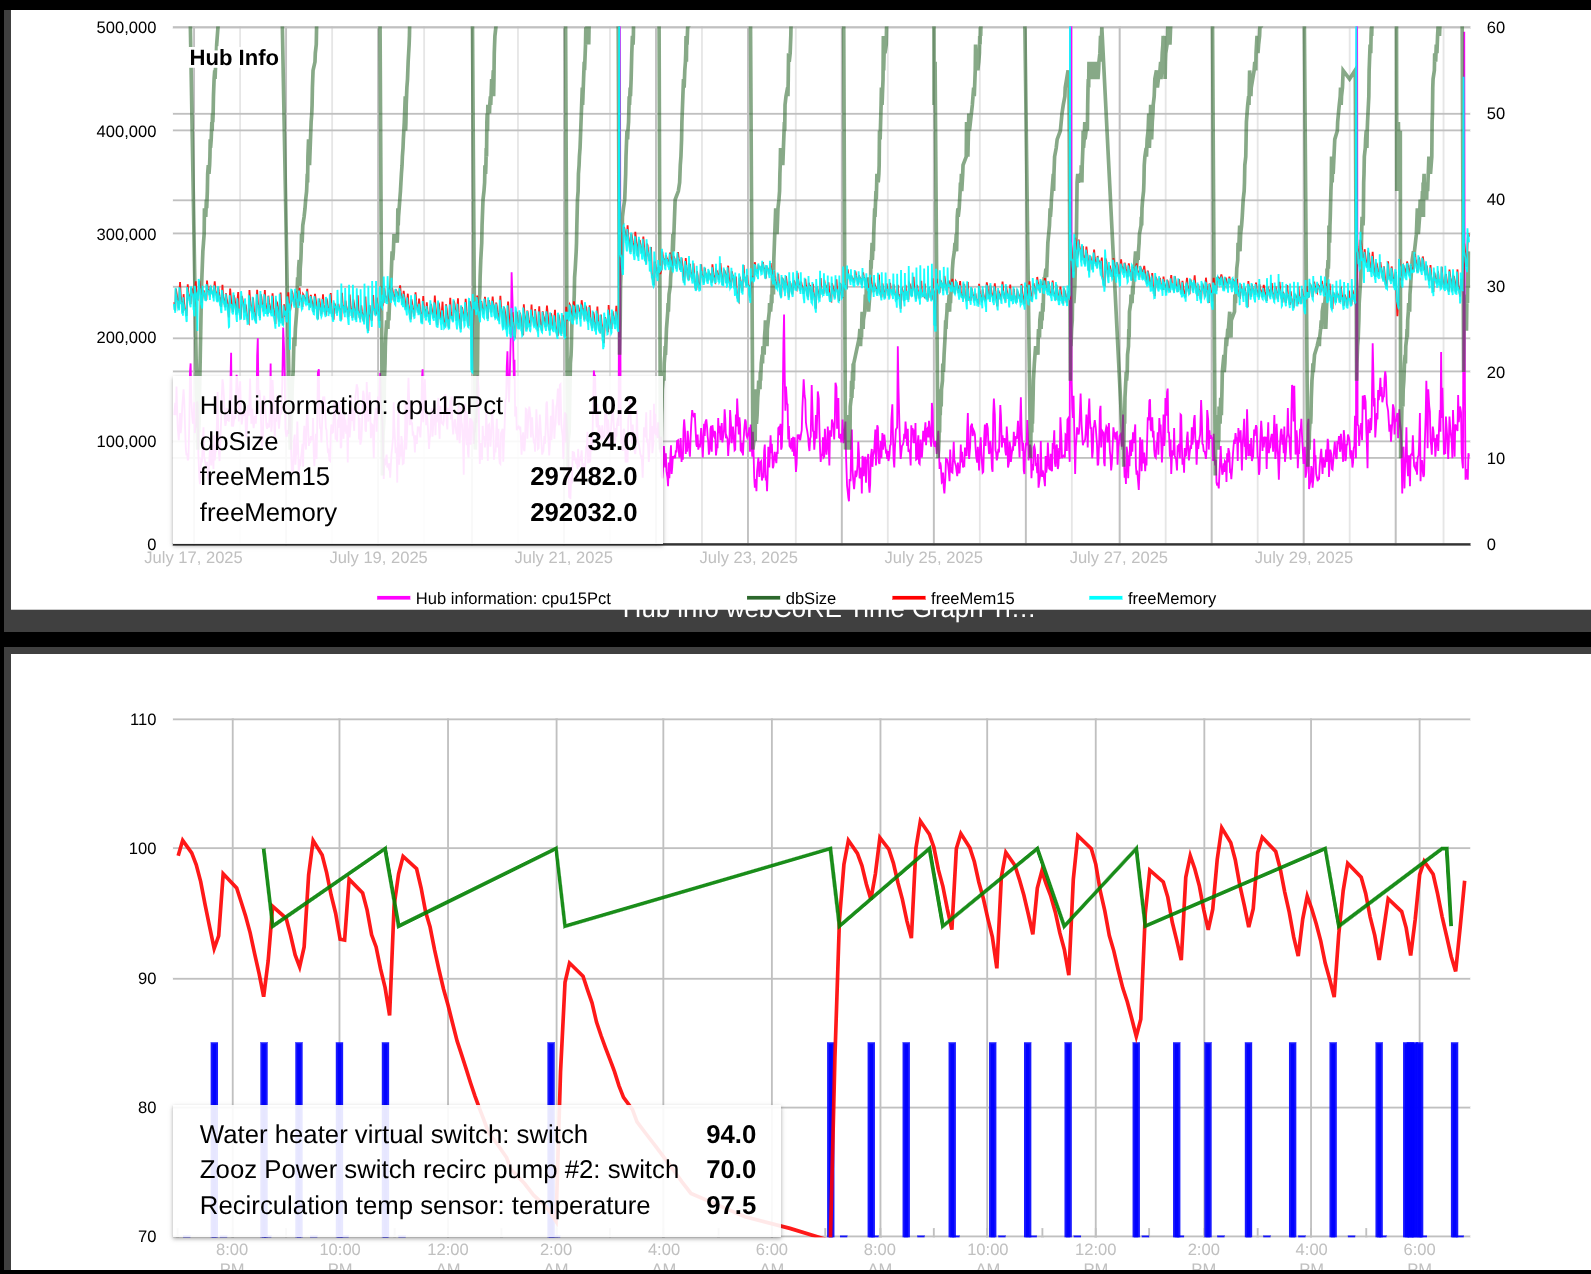
I used to use those graphs when I was using Webcore on SmartThings. Then I saw a SmartThings forum post about how to send data directly to Google sheets. It is a bit convoluted, with scripts installed in Sheets to add data and clean up data, but that is what I have been using for charts ever since.
I posted it all in this forum once when someone asked about sending data to Google Sheets, but because you have to just leave the workbook open to everyone to edit to avoid having to do Google authentication, I didn't get much love for that method.
I've had that open Sheet workbook now for about seven years, and nobody has ever found it or messed with it. I have a tabs in it with many sheets, and each sheet makes a chart. Then you can click on the chart and publish it, and then put the charts on dashboards with the URL.
@chrisbvt
Thank you!!!
I'm trying to use your Google Sheets method - that is actually my post to which you linked. I just can't get it to work. If you would not mind going over to the linked post and let me know what I did wrong I would greatly appreciate that!!
1 Like
Sure! If you can give me a summary of what you have done so far, and what part of it (the driver code or the Sheets scripts I shared) seems to be broken or where you are stuck, it would give me something to focus on.
1 Like
This is the post where I describe exactly what I did, and exactly what I entered in the script, etc.
Ah, yes, I totally remember reading your post now. It wasn't directly to me, so I see I never got back to that thread. I just replied there since we are way off the topic now about displaying a time interval on a dashboard tile!

