Hi Guys, this is my first message on this particular post.
I started getting Lockups about a week or two ago, and I´ve already read all messages in this list, and a couple of days ago I even rolled back to 2.3.5.101, with no luck.
My hub locks up without any particular reason.
I´ve a Unifi USG with lots of Unifi AP´s.
My hub has been working great for years!, but now It won´t stay on for more than one day, maybe just a few hours every time it locks up.
Some info: I have a few Cloud Dashboards that have been working great for years, so I check all my stuff from my office, and that is the way I notice when those Cloud dashboards start throwing a "no response from hub" message, or something like that.
I have a Domotz subscription so I can login into my LAN at home, and I even have a Unifi USP Plug, which is a dongle for resetting "routers" from the UI at Unifi, so I use this to reset my HE Hub every time it locksup, and I can do that remotely.
I do have Hub Protect plan active.
I´m starting to suspect that this might be a Hw problem.
Hard resets can cause database corruption (as can any power loss). To get the database in a good state restore from a backup. Then if you are still having problems post more information including kinds of devices you use, a picture of your Z-Wave details page, and if you use any resource intensive apps like database logging, Echo Speaks, etc.
I´m just noticing (remotely) that my Cloud Dashboards DO NOT WORK (No response from hub), but If I access the hub remotely, at least at this moment via Domotz, it is not frozen, it responds.
I can see the Log file running.
Ideas?
Edit: After REBOOTING, it went back to normal, with Cloud Dashboards working again, but I don´t know how long it will stand working normally
Based on details provided thus far, this sounds more like a network issue than a hardware issue. If you were dealing with a hardware problem, your hub wouldn't be accessible locally.
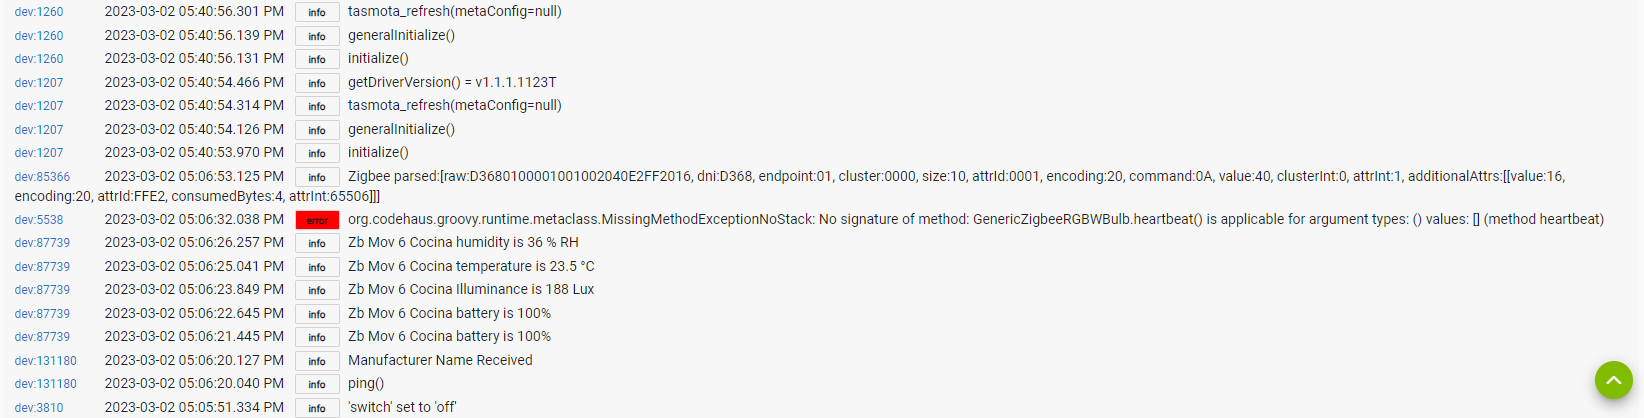
Device 5538 with the error, looks like that is possibly a child device with the wrong driver set. Looks like some external source is trying to call heartbeat on it but that drver does not have it.
I also see tasmota in the logs, how many wifi devices do you have and how are they integrated?
This specific device is a RGB ceiling Zigbee light, and couldn’t find a driver that doesn’t throw this error, but has been working this way for about a year or two without any problems.
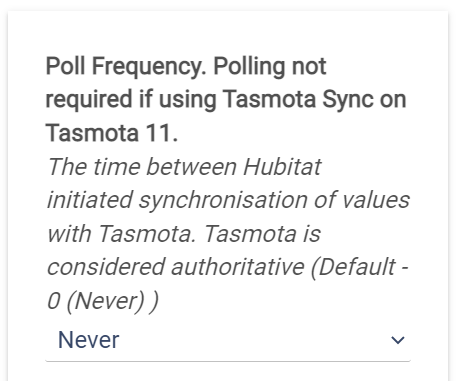
I am thinking it is probably the number of Wi-Fi devices causing issues. Those drivers are usually more stressing on the hub as well. I know the Tuya cloud driver is one of them do the encoding it has to do on every message. Do the tasmota devices have to be polled?
Checks the logs and the device and apps stats tabs, it should sort by the heaviest stuff by default. See if anything there looks suspect.
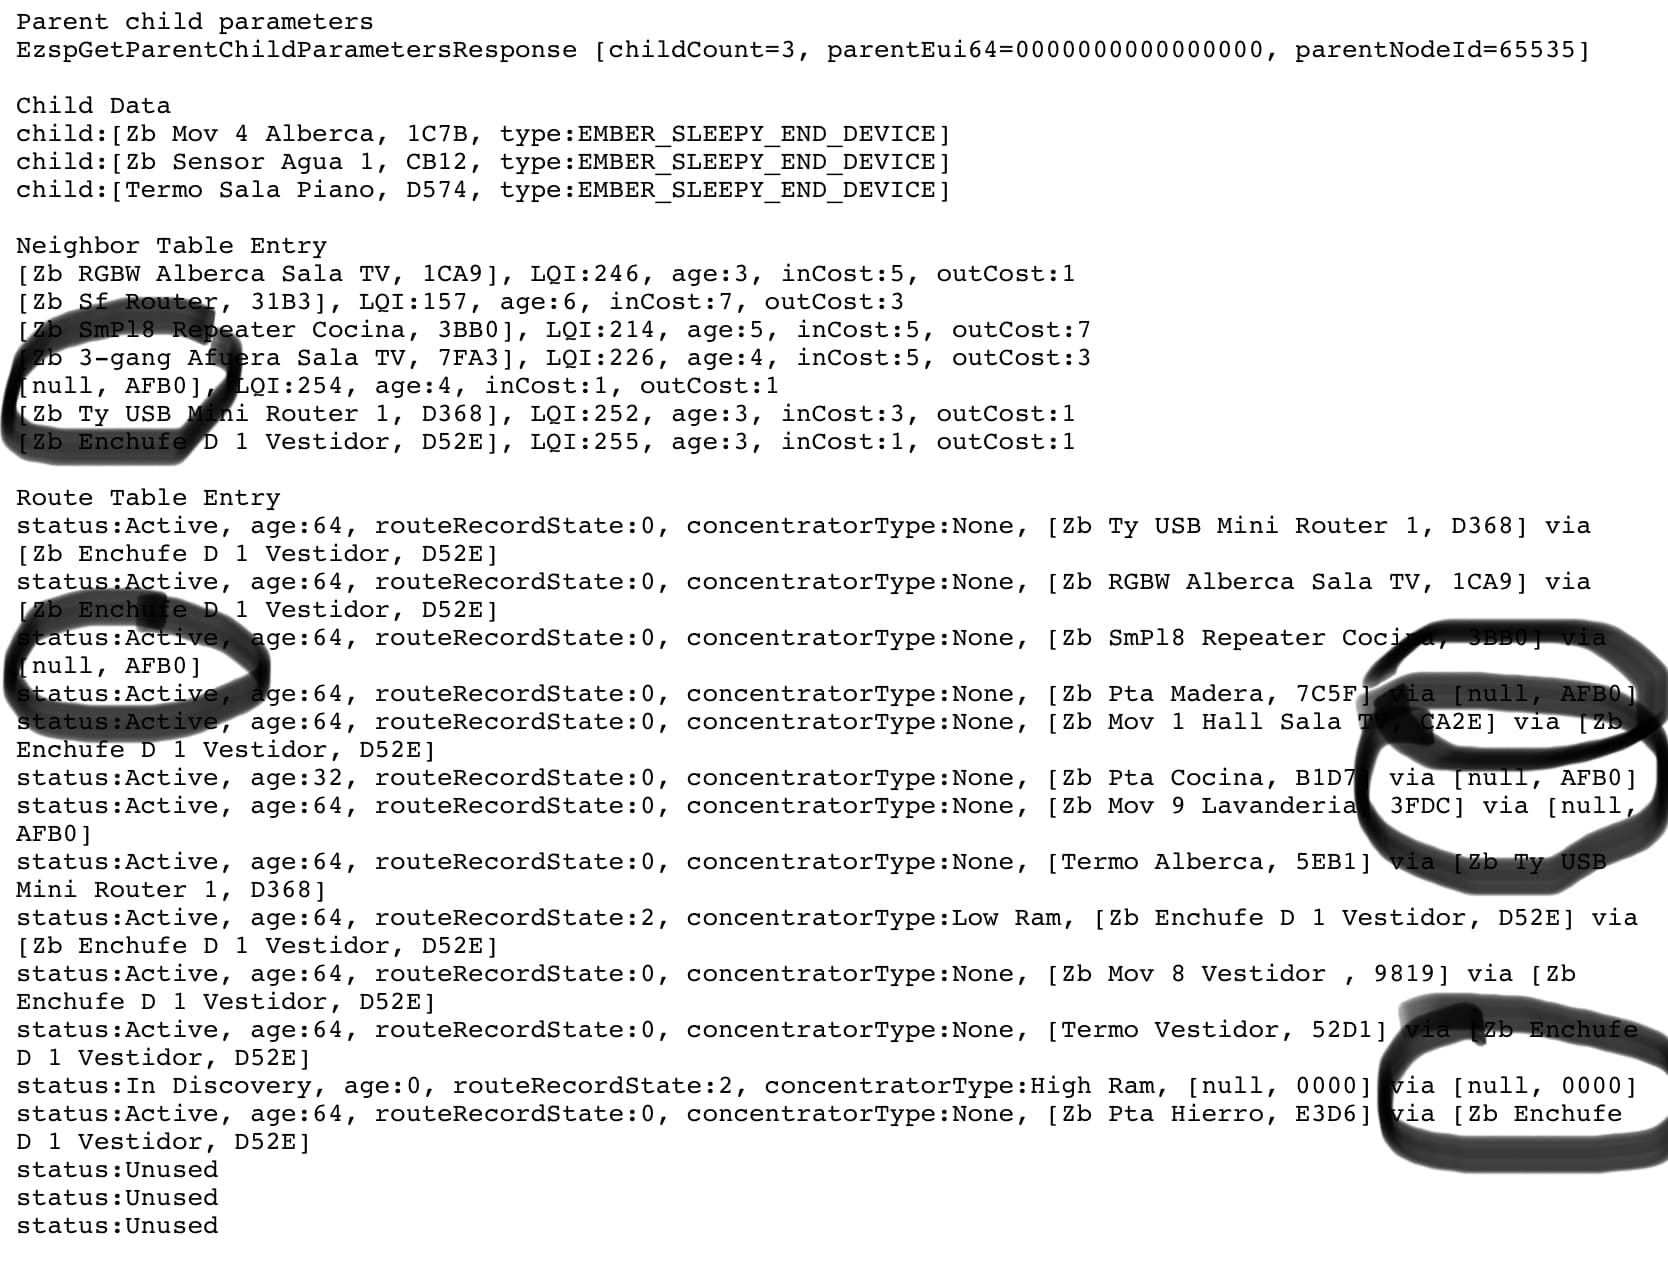
The null Zigbee device, I think that would be something you have connected but the "device" entry for it has been deleted. Isn't that name shown there the name you give it in the devices list? It appears that it is being used a repeater quite a bit. If you figure out what it is and reset/re-pair it, I think the device entry will be created again.
I´ve been erasing a few apps I downloaded and installed lately, thinking that maybe one of them has something to do with the problem, and I´ve been reveiwing all my Zigbee devices, and re-pairing some suspicious devices, and even disabling a couple of them, but still I keep getting lockups from the Cloud Dashboards (Not a dead hub, as sometimes happens).
Is there a way to reset Cloud Dashboards, and not Reboot the HE Hub?
My network is working properly.
My HE Hub is at home, and I access my home LAN remotely via Domotz, with no problems, so, when I have Cloud Dashboards locked or not responding, I access my home LAN via Domotz and then I can see if the Hub is working, or is also locked.
If it is not down, but only Cloud Dashboards are unresponsive, then I REBOOT the hub, but if it is dead, then I RESET it via an Unifi USP Plug. I am well aware of the risks of resetting a hub, but when it is dead, there is no other way, particularly if you are away from home.
My theory is that If I can access my Home LAN remotely, and everything works ok except my HE Hub, then the LAN is not to blame, but something else.
What else should I do?
Edit, Text added:
I´m even considering turning off (disabling) Zigbee for a day or so, and see if it keeps locking-up.
Does it sound logical?
I am not saying your LAN is the problem, I am suggesting it is number of Wifi devices you have integrated to HE. Two totally separate things. The Wifi devices, especially some user created integrations, take the most toll on the hubs resources. I highly doubt it is the Zigbee stuff.
I will re-state my questions/suggestions from above
Do the tasmota devices have to be polled?
Checks the logs and the device and apps stats tabs, it should sort by the heaviest stuff by default.
If not sure of what you are looking at, post screenshots.
Ok that's good for Tasmota I think. I knew there was a newerish driver that did not need to poll, so was not sure if you were using that or not. If any devices are causing trouble we will see it in the device state.
Screenshots look like it was right after a reboot, the stats reset when you reboot.
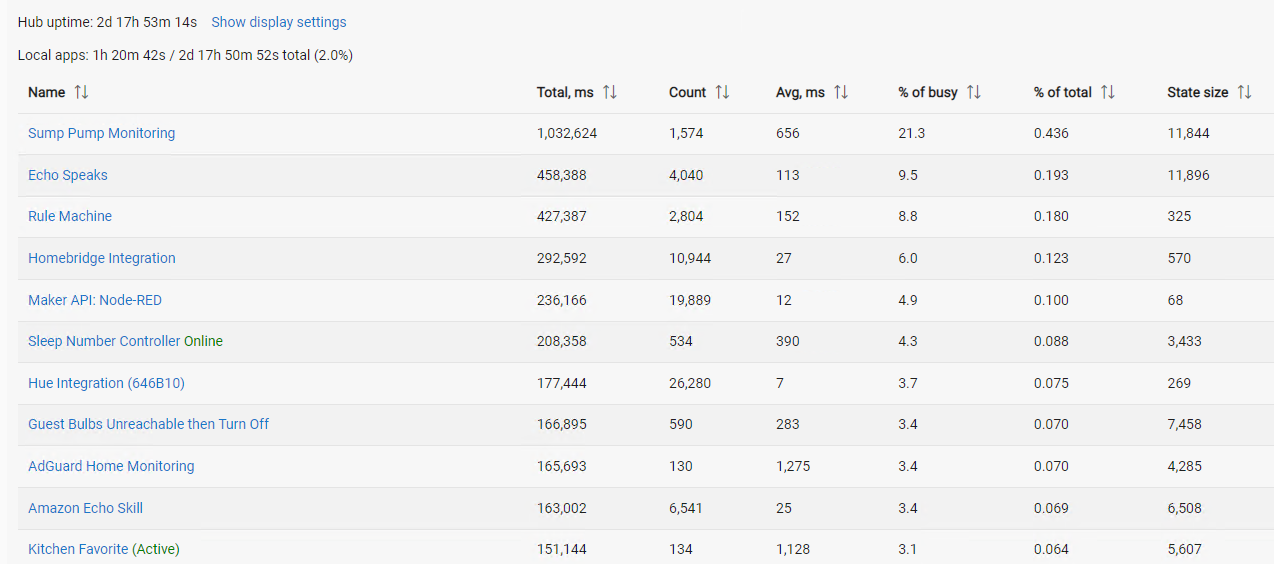
In a hour or two check it again, turn on ALL the checkboxes at the top and capture the entire width of the screen.
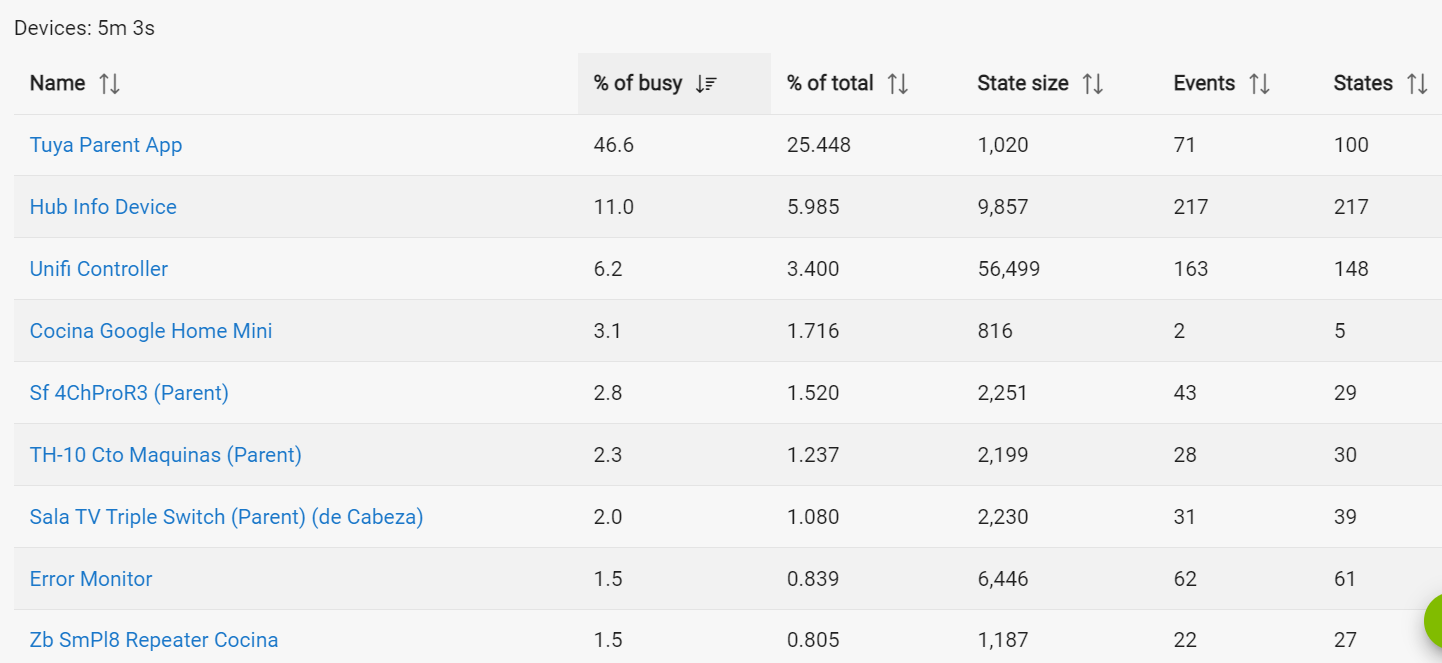
The percent of total is one of the more useful columns here, it basically shows of all the time the CPU has been up, what % of that time has it been doing stuff for X app or driver.
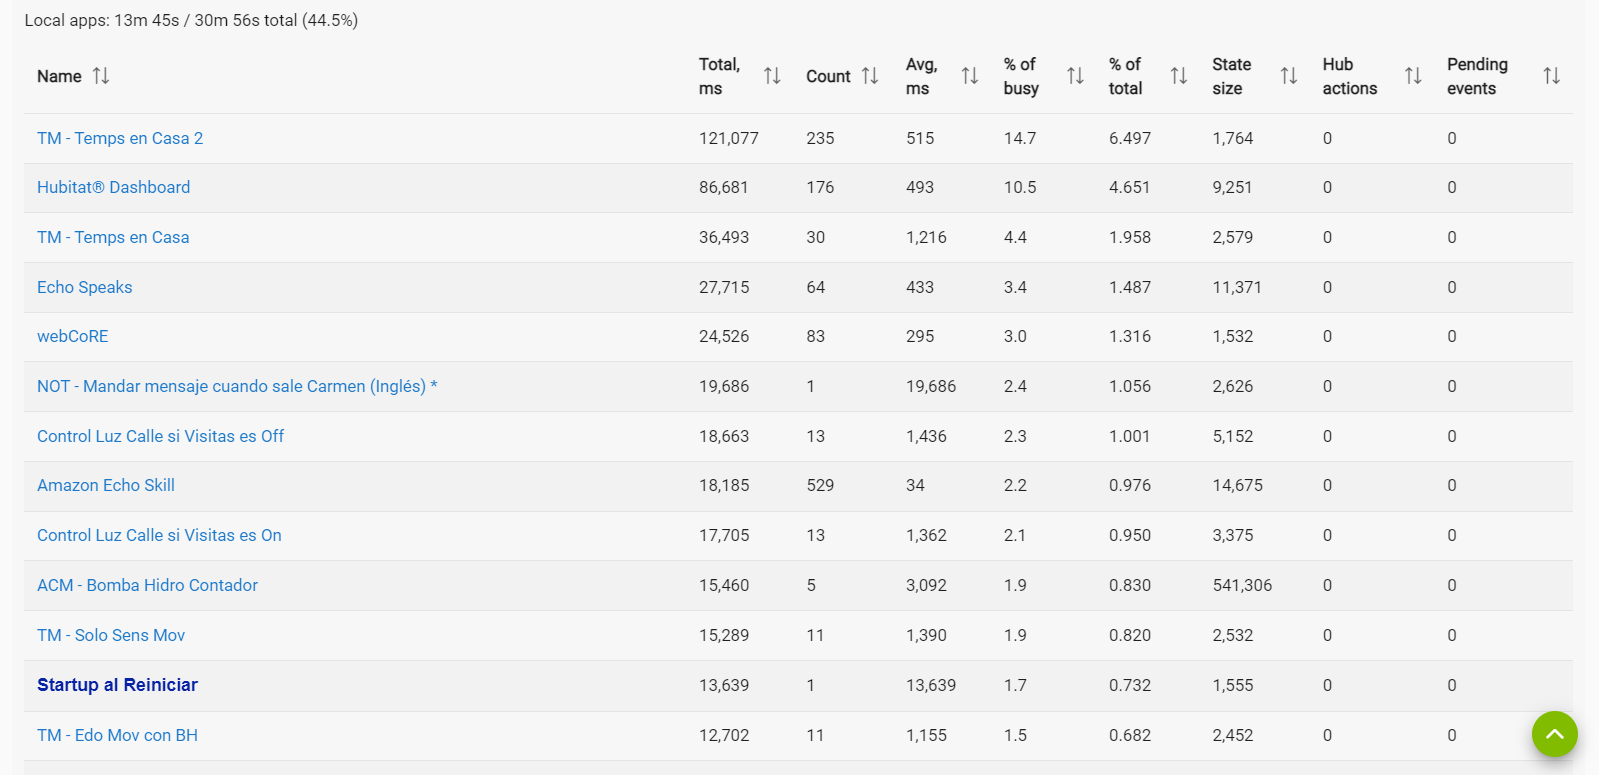
Do you have a dashboard running and refreshing somewhere ALL the time? That dashboard use seems excessive.
Also, what are the two "TM" apps doing?
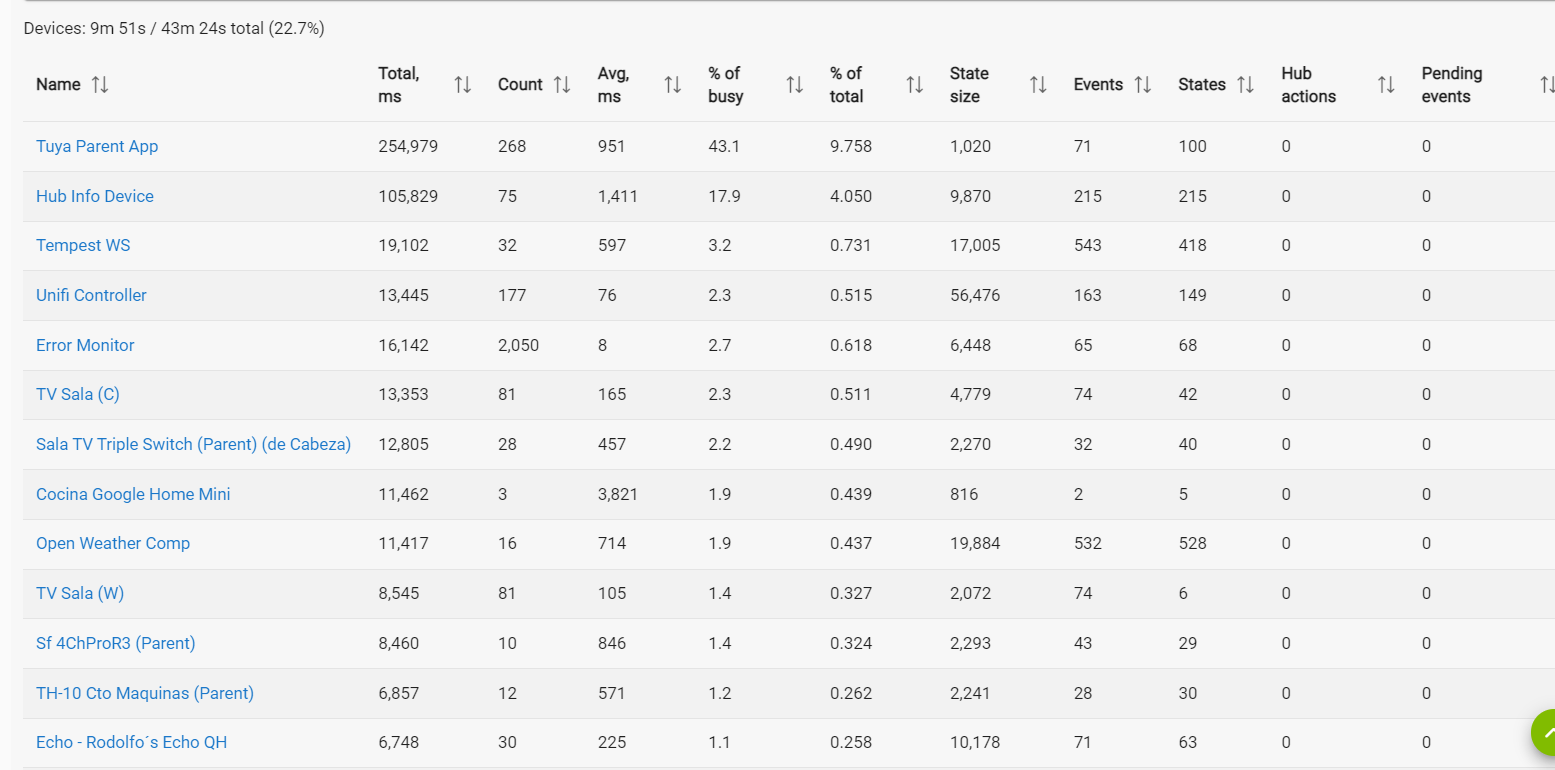
For Devices, the Tuya parent app which I assume is the cloud API is no surprise there, it is resource intensive due to encoding/decoding. The Hub Info seems like a lot, have you updated to the v3 driver where you can set different polling rates?
I would try disabling some of these top apps and drivers temporarily to see if it helps, it is shown how to do it in this article at the bottom: Apps Page | Hubitat Documentation
This will just "Pause" them and once you uncheck the box they will work again. So, it is great for troubleshooting.
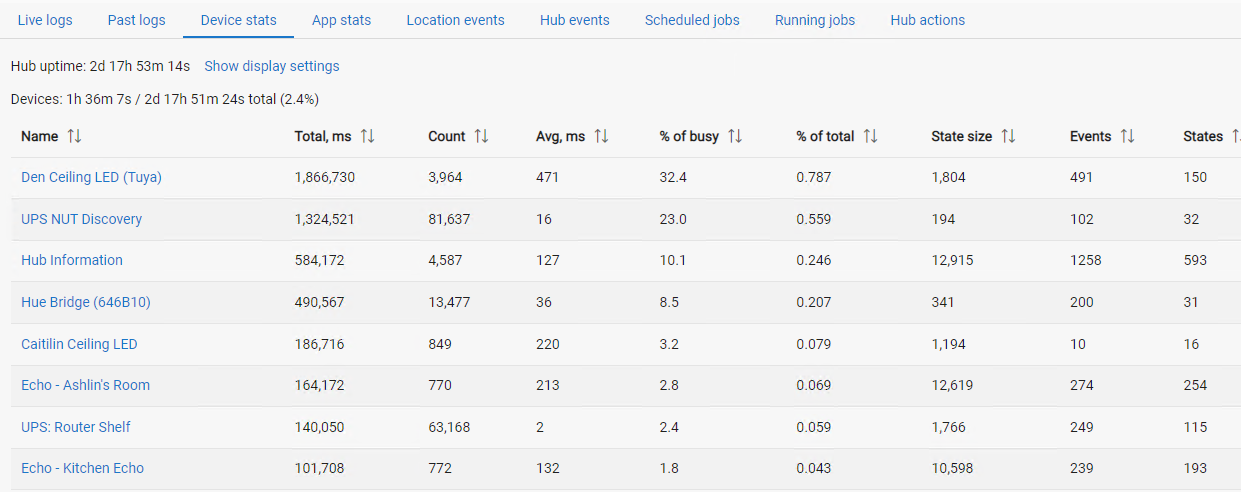
Here is a comparison, notice all of my % of total are less than 1
I use three dashboards open all the time, but they don’t refresh unless the specific dashboard is on screen, which is unlikely. It’s not that I have them for hours onscreen.
The TM apps are Tile Master from BPTWorld, and one shows temperature from 7 devices, and the other one shows humidity from those 7 devices plus one more.
About Hub Info I believe I’m on 2.7.22, but I just adjusted a polling rate option to 360 secs, from 300 secs.
I just learned something new today with this method for pausing apps. (Thanks!)
Will start playing with this option to see if hub doesn’t freeze again.
The good news is that it hasn’t frozen for the last 7 hours, which is strange, and now I’m ready to go to bed, so I will see tomorrow morning if it’s still ok.