Can you graph status points like occupancy, room status, open close?
Thank you
Grafana "State Timeline" works well for this type of stuff.
Is this in Hubitat Package Manager?
No, grafana is a graphing software suite that would have to run on another server, Hubitat can’t run it.
But there are other graphing solutions that can be run on the hub.
1 Like
It is not in HPM, but the InfluxDB Logger tool is. Then you would need to get cloud accounts for InfluxDB and HPM. That is ofcourse if you choose to go down that route. Last i checked the free options should be sufficient as long as you aren't doing anything to crazy. You could also get a Raspberry Pi and load it both Grafana and InfluxDB on it for a fairly cheap price. It doesn't take much to run them.
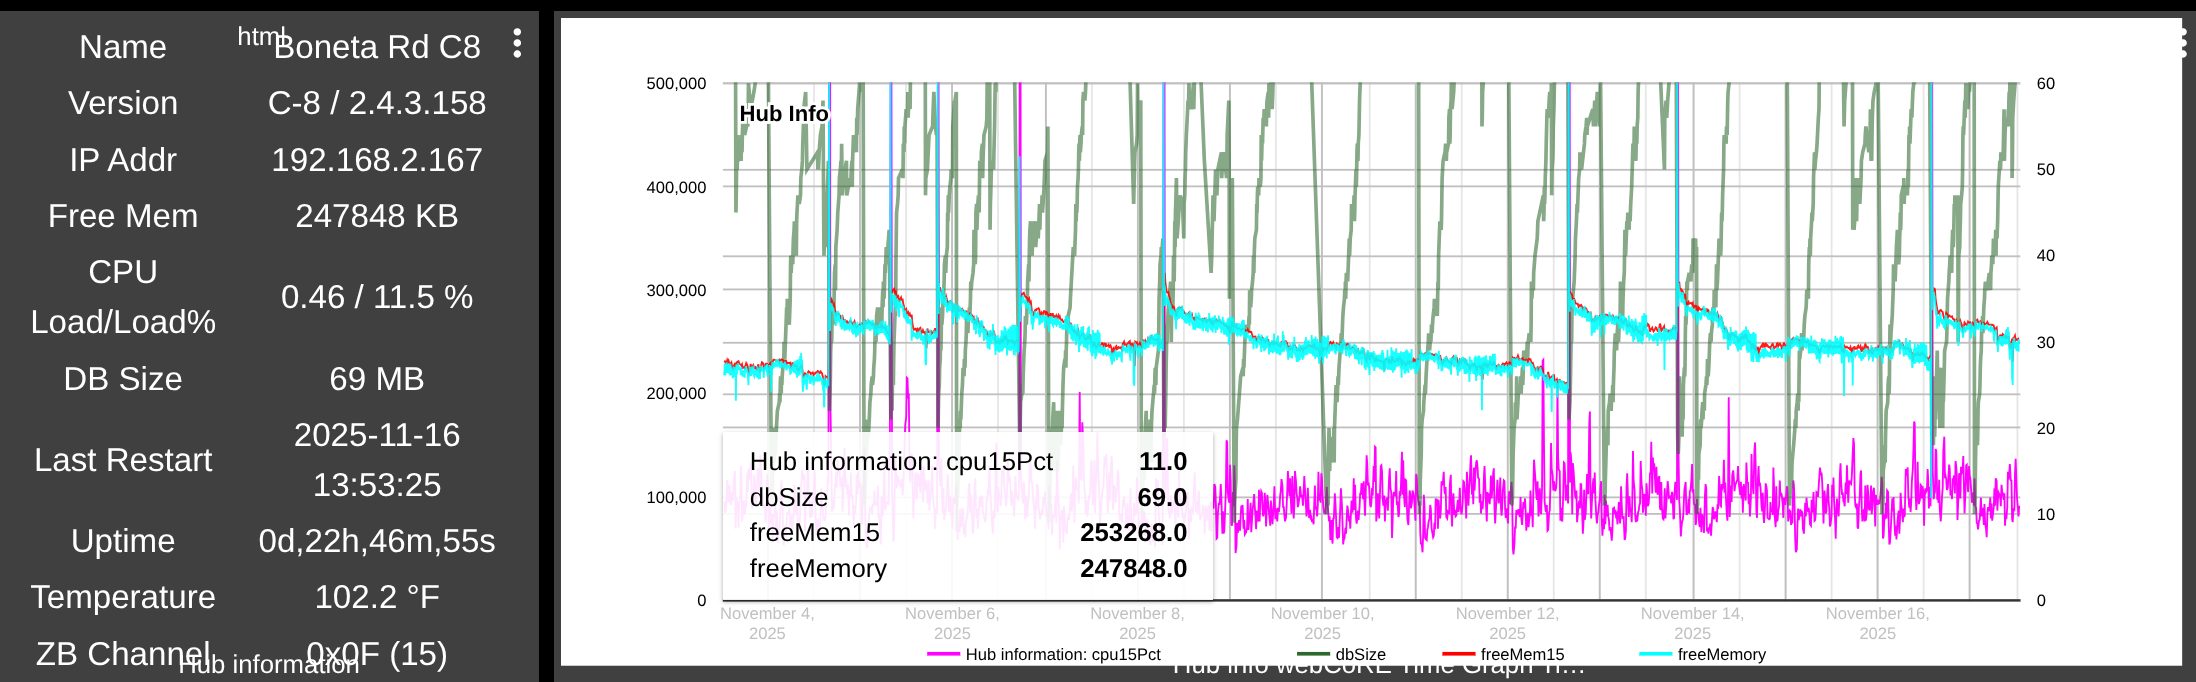
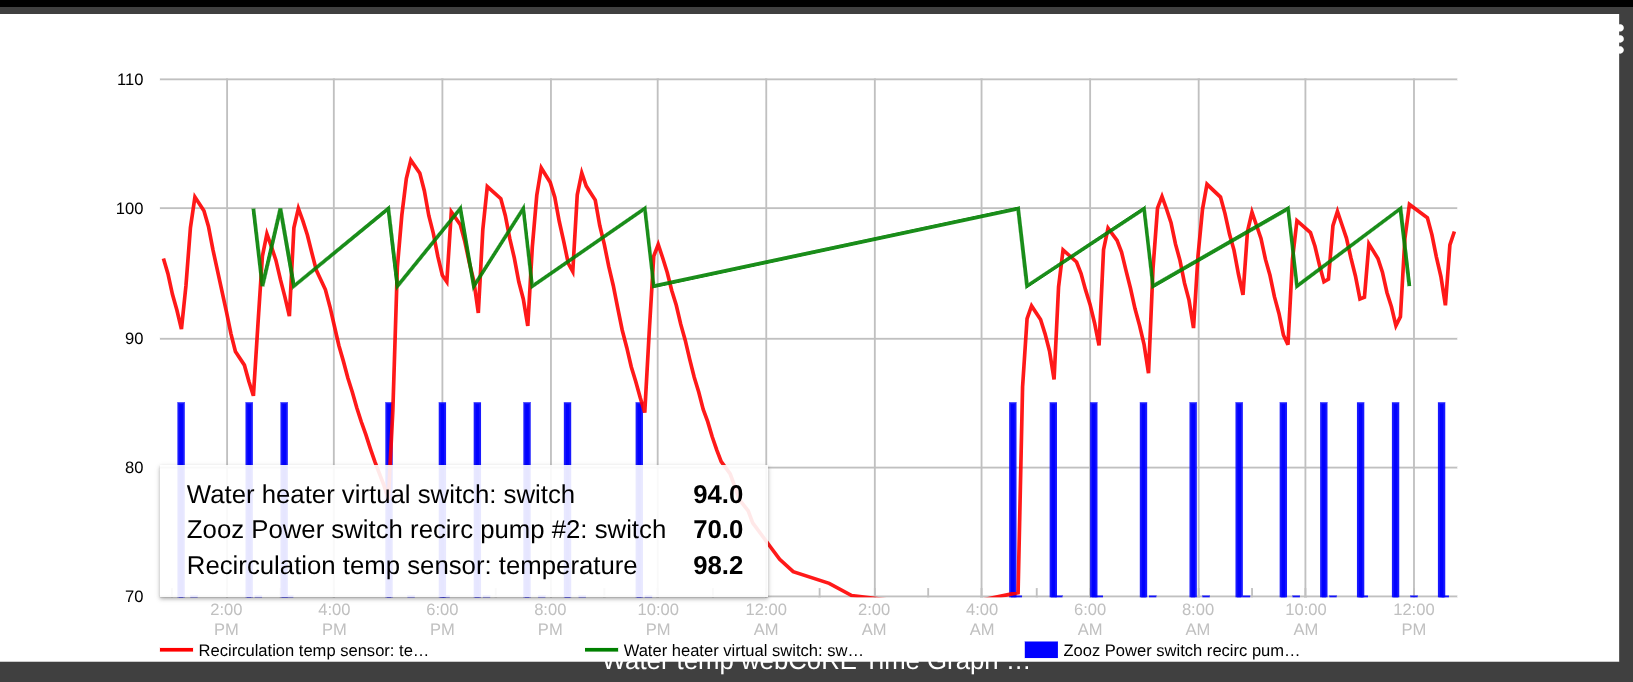
Webcore built in the functionality from Hubigraphs I believe so it is fairly versatile as well. Then you also have the recently added Dashboard tiles that do Graphs as well. That said i don't think they will do the presense detection like you are asking. I know grafana does it as i have a few that perform that task already.
Incase you are interested. Using HE with with InfluxDB, Grafana, with InfluxDB Logger
Where can I find instruction for webCore?
Thank you
Start by enabling the webCoRE app in the Hubitat apps. Select graphs. Some info on webCoRE here. [Wiki] webCoRE Documentation Digest
and here: webCoRE | Hubitat Documentation

