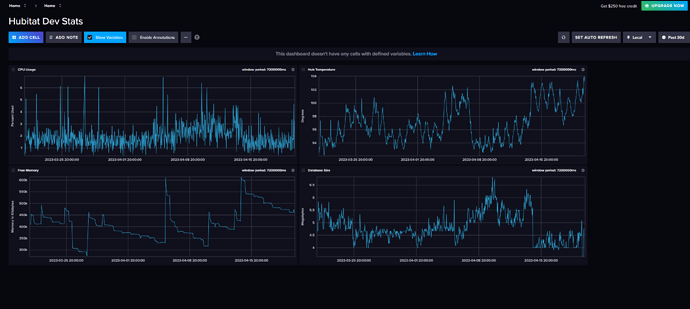
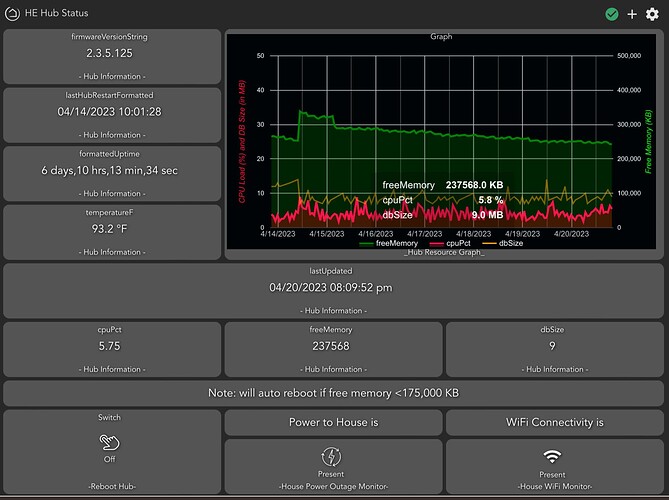
Technically you don't even have to have Grafana. InfluxDB2.x integrates a visualization tool with it. Here is a quick dashboard I put together for my dev hub which outputs to the cloud. It includes CPU, DB size, Temp, and Free Mem.
Here is the template for that dashboard if you want to import it to get started with those stats.
[{"apiVersion":"influxdata.com/v2alpha1","kind":"Dashboard","metadata":{"name":"spectacular-lichterman-da0001"},"spec":{"charts":[{"axes":[{"base":"10","name":"x","scale":"linear"},{"base":"10","label":"Percent Used","name":"y","scale":"linear"}],"colorMapping":{"value-cpuPct-1-Hub Dev-HubitatDev-HubitatDev-%-mean-":"#31C0F6"},"colorizeRows":true,"colors":[{"id":"uMorniw-cfNfEtY1ZuWOx","name":"Nineteen Eighty Four","type":"scale","hex":"#31C0F6"},{"id":"lfJn4JAYuz_FjHsWuP0i2","name":"Nineteen Eighty Four","type":"scale","hex":"#A500A5"},{"id":"xJp_mMX-Xc5TvRkZLx6qr","name":"Nineteen Eighty Four","type":"scale","hex":"#FF7E27"}],"geom":"line","height":4,"hoverDimension":"auto","kind":"Xy","legendColorizeRows":true,"legendOpacity":1,"legendOrientationThreshold":100000000,"name":"CPU Usage","opacity":1,"orientationThreshold":100000000,"position":"overlaid","queries":[{"query":"from(bucket: \"Hubitat\")\n |> range(start: v.timeRangeStart, stop: v.timeRangeStop)\n |> filter(fn: (r) => r[\"_measurement\"] == \"cpuPct\")\n |> filter(fn: (r) => r[\"_field\"] == \"value\")\n |> aggregateWindow(every: v.windowPeriod, fn: mean, createEmpty: false)\n |> yield(name: \"mean\")"}],"staticLegend":{"colorizeRows":true,"opacity":1,"orientationThreshold":100000000,"widthRatio":1},"width":5,"widthRatio":1,"xCol":"_time","yCol":"_value"},{"axes":[{"base":"10","name":"x","scale":"linear"},{"base":"10","label":"Memory in Kilobytes","name":"y","scale":"linear"}],"colorMapping":{"value-freeMemory-1-Hub Dev-HubitatDev-HubitatDev-KB-mean-":"#31C0F6"},"colorizeRows":true,"colors":[{"id":"uMorniw-cfNfEtY1ZuWOx","name":"Nineteen Eighty Four","type":"scale","hex":"#31C0F6"},{"id":"lfJn4JAYuz_FjHsWuP0i2","name":"Nineteen Eighty Four","type":"scale","hex":"#A500A5"},{"id":"xJp_mMX-Xc5TvRkZLx6qr","name":"Nineteen Eighty Four","type":"scale","hex":"#FF7E27"}],"geom":"line","height":4,"hoverDimension":"auto","kind":"Xy","legendColorizeRows":true,"legendOpacity":1,"legendOrientationThreshold":100000000,"name":"Free Memory","opacity":1,"orientationThreshold":100000000,"position":"overlaid","queries":[{"query":"from(bucket: \"Hubitat\")\n |> range(start: v.timeRangeStart, stop: v.timeRangeStop)\n |> filter(fn: (r) => r[\"_measurement\"] == \"freeMemory\")\n |> filter(fn: (r) => r[\"_field\"] == \"value\")\n |> aggregateWindow(every: v.windowPeriod, fn: mean, createEmpty: false)\n |> yield(name: \"mean\")"}],"staticLegend":{"colorizeRows":true,"opacity":1,"orientationThreshold":100000000,"widthRatio":1},"width":5,"widthRatio":1,"xCol":"_time","yCol":"_value","yPos":4},{"axes":[{"base":"10","name":"x","scale":"linear"},{"base":"10","label":"Degrees","name":"y","scale":"linear"}],"colorMapping":{"value-temperature-1-Hub Dev-HubitatDev-HubitatDev-°F-mean-":"#31C0F6"},"colorizeRows":true,"colors":[{"id":"uMorniw-cfNfEtY1ZuWOx","name":"Nineteen Eighty Four","type":"scale","hex":"#31C0F6"},{"id":"lfJn4JAYuz_FjHsWuP0i2","name":"Nineteen Eighty Four","type":"scale","hex":"#A500A5"},{"id":"xJp_mMX-Xc5TvRkZLx6qr","name":"Nineteen Eighty Four","type":"scale","hex":"#FF7E27"}],"geom":"line","height":4,"hoverDimension":"auto","kind":"Xy","legendColorizeRows":true,"legendOpacity":1,"legendOrientationThreshold":100000000,"name":"Hub Temperature","opacity":1,"orientationThreshold":100000000,"position":"overlaid","queries":[{"query":"from(bucket: \"Hubitat\")\n |> range(start: v.timeRangeStart, stop: v.timeRangeStop)\n |> filter(fn: (r) => r[\"_measurement\"] == \"temperature\")\n |> filter(fn: (r) => r[\"_field\"] == \"value\")\n |> filter(fn: (r) => r[\"deviceId\"] == \"1\")\n |> aggregateWindow(every: v.windowPeriod, fn: mean, createEmpty: false)\n |> yield(name: \"mean\")"}],"staticLegend":{"colorizeRows":true,"opacity":1,"orientationThreshold":100000000,"widthRatio":1},"width":5,"widthRatio":1,"xCol":"_time","xPos":5,"yCol":"_value"},{"axes":[{"base":"10","name":"x","scale":"linear"},{"base":"10","label":"Megabytes","name":"y","scale":"linear"}],"colorMapping":{"value-dbSize-1-Hub Dev-HubitatDev-HubitatDev-MB-mean-":"#31C0F6"},"colorizeRows":true,"colors":[{"id":"uMorniw-cfNfEtY1ZuWOx","name":"Nineteen Eighty Four","type":"scale","hex":"#31C0F6"},{"id":"lfJn4JAYuz_FjHsWuP0i2","name":"Nineteen Eighty Four","type":"scale","hex":"#A500A5"},{"id":"xJp_mMX-Xc5TvRkZLx6qr","name":"Nineteen Eighty Four","type":"scale","hex":"#FF7E27"}],"geom":"line","height":4,"hoverDimension":"auto","kind":"Xy","legendColorizeRows":true,"legendOpacity":1,"legendOrientationThreshold":100000000,"name":"Database Size","opacity":1,"orientationThreshold":100000000,"position":"overlaid","queries":[{"query":"from(bucket: \"Hubitat\")\n |> range(start: v.timeRangeStart, stop: v.timeRangeStop)\n |> filter(fn: (r) => r[\"_measurement\"] == \"dbSize\")\n |> filter(fn: (r) => r[\"_field\"] == \"value\")\n |> aggregateWindow(every: v.windowPeriod, fn: mean, createEmpty: false)\n |> yield(name: \"mean\")"}],"staticLegend":{"colorizeRows":true,"opacity":1,"orientationThreshold":100000000,"widthRatio":1},"width":5,"widthRatio":1,"xCol":"_time","xPos":5,"yCol":"_value","yPos":4}],"name":"Hubitat Dev Stats"}}]


