I;'ve had trouble with files being created initially sometimes too. I recommend just uploading blank files with the desired name and it should be fine after that.
The next question is how do I set it up with the built-in dashboard? What template do I use to display the chart?
Read this topic starting at post 24....
If I use quick chart then how do I View the chart?
Maybe this will help from one of the posts above? A virtual device is automatically created from the app, then you add the 'chart' attribute from the virtual device to the dashboard. You do this for each chart separately.
Just want to say i love this app - so much simpler and cleaner than Hubigraph. Thank you and keep it coming!
This app is great and a simple way to graph some data.
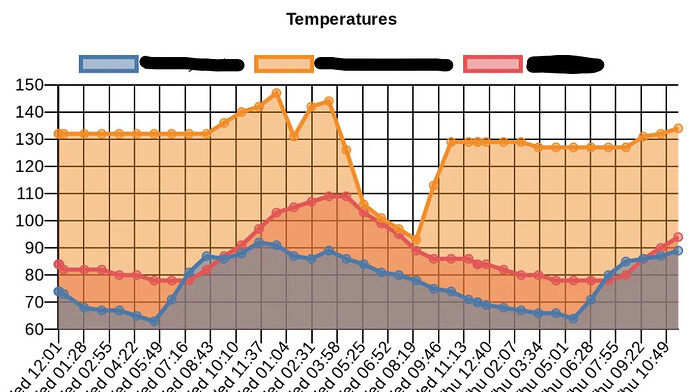
One issue I'm having is automatically updating the chart. Have tried setting the "When to Update" field with multiple timeframes and Device Attribute Value, but chart never updates unless I Manually Triger a Chart.
Same situation pulling from a Data Collector file or devices directly as data source.
Any ideas?
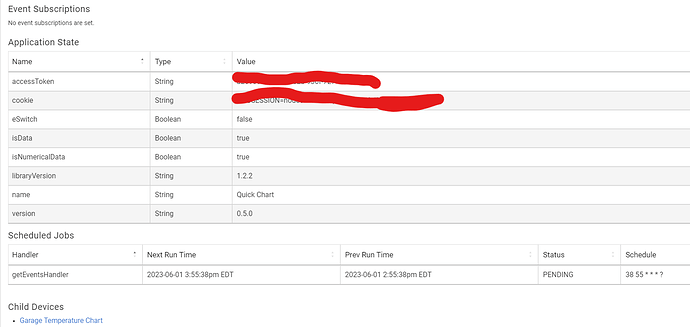
Can you show a screenshot of your settings, as well as a shot of what the bottom of the configuration page of the chart app looks like? To see if you are getting subscriptions to events or timeframes?
You shoudl see scheduled jobs like in this pic, for updates based on time, or you should see event subscriptions for updates based on attribute values
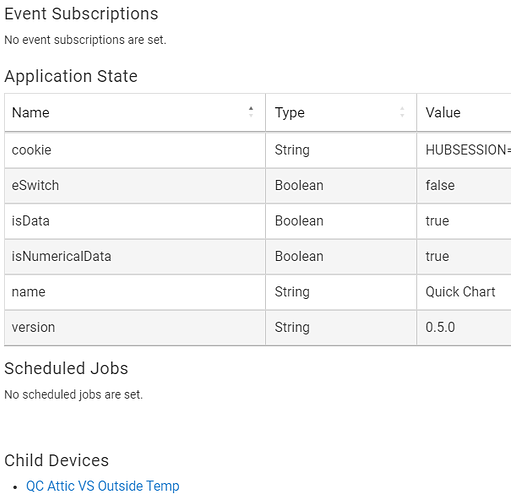
Not sure why the above app doesn't show child device either. It is defined in app.
Another Quick Chart that is having same issue:
Another note, data collector app is updating as expected..
Will need a screenshot of your settings and then a log output with debug logging on to help troubleshoot.
Took a look at the logs. Noticed an Oauth error. Went ahead and enabled oauth on QC Child app although not sure how related, but that did the trick. After re-saving the child app, I noticed event subscriptions and it did successfully run on time.
Thanks for your help!
By "doing local rendering" do you mean it would work even if the hub has no internet connection?
If so, it would be awesome if you could work with JustinL to get that working!
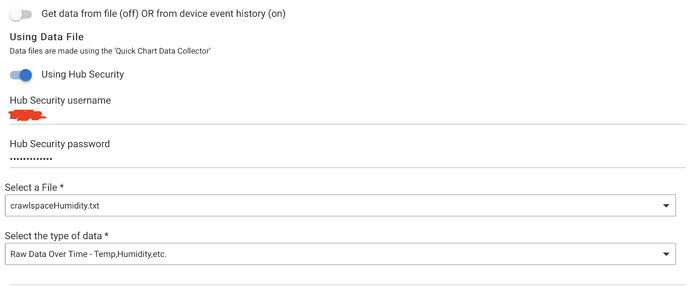
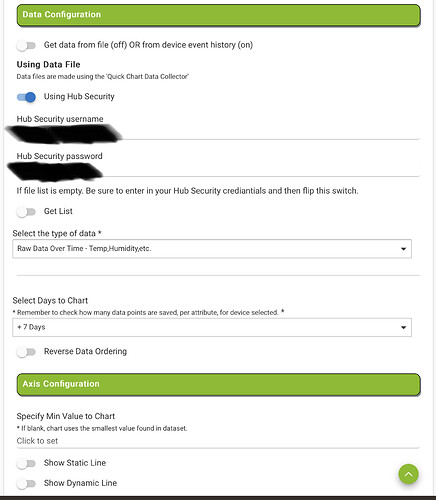
Hello, I’ve been using the app for some time and like it. Recently, I decided to use the data collector rather than the event list for my graphes. I setup a data collector, and the appropriate file was created on the hub directory. However, I’m not able to select the file when creating a new chart. When I click on the get file option, nothing happen. I have entered my hub credential. Does anybody has an idea on what’s happening here? Thanks!
I can try to help, but going to need more info to debug. Perhaps a screenshot showing your selections, as well as any debug log.
It's supposed to look like this:
Let me know how to collect any pertinent log. Thanks!
From the first post in this thread:
When reporting problems...
- Turn on debug and screenshot the issue happening in the log. One line or just the error doesn't cut it. I need a log.
- Post the screenshot of the log with an explanation of the problem.
