I genuinely appreciate the help that everyone is providing to track this down. I have now tested on multiple platforms and browsers, and can report some results. Looks like a browser issue, as @tony.fleisher suspects.
Responding to questions and requests out of order:
No. HTTP.
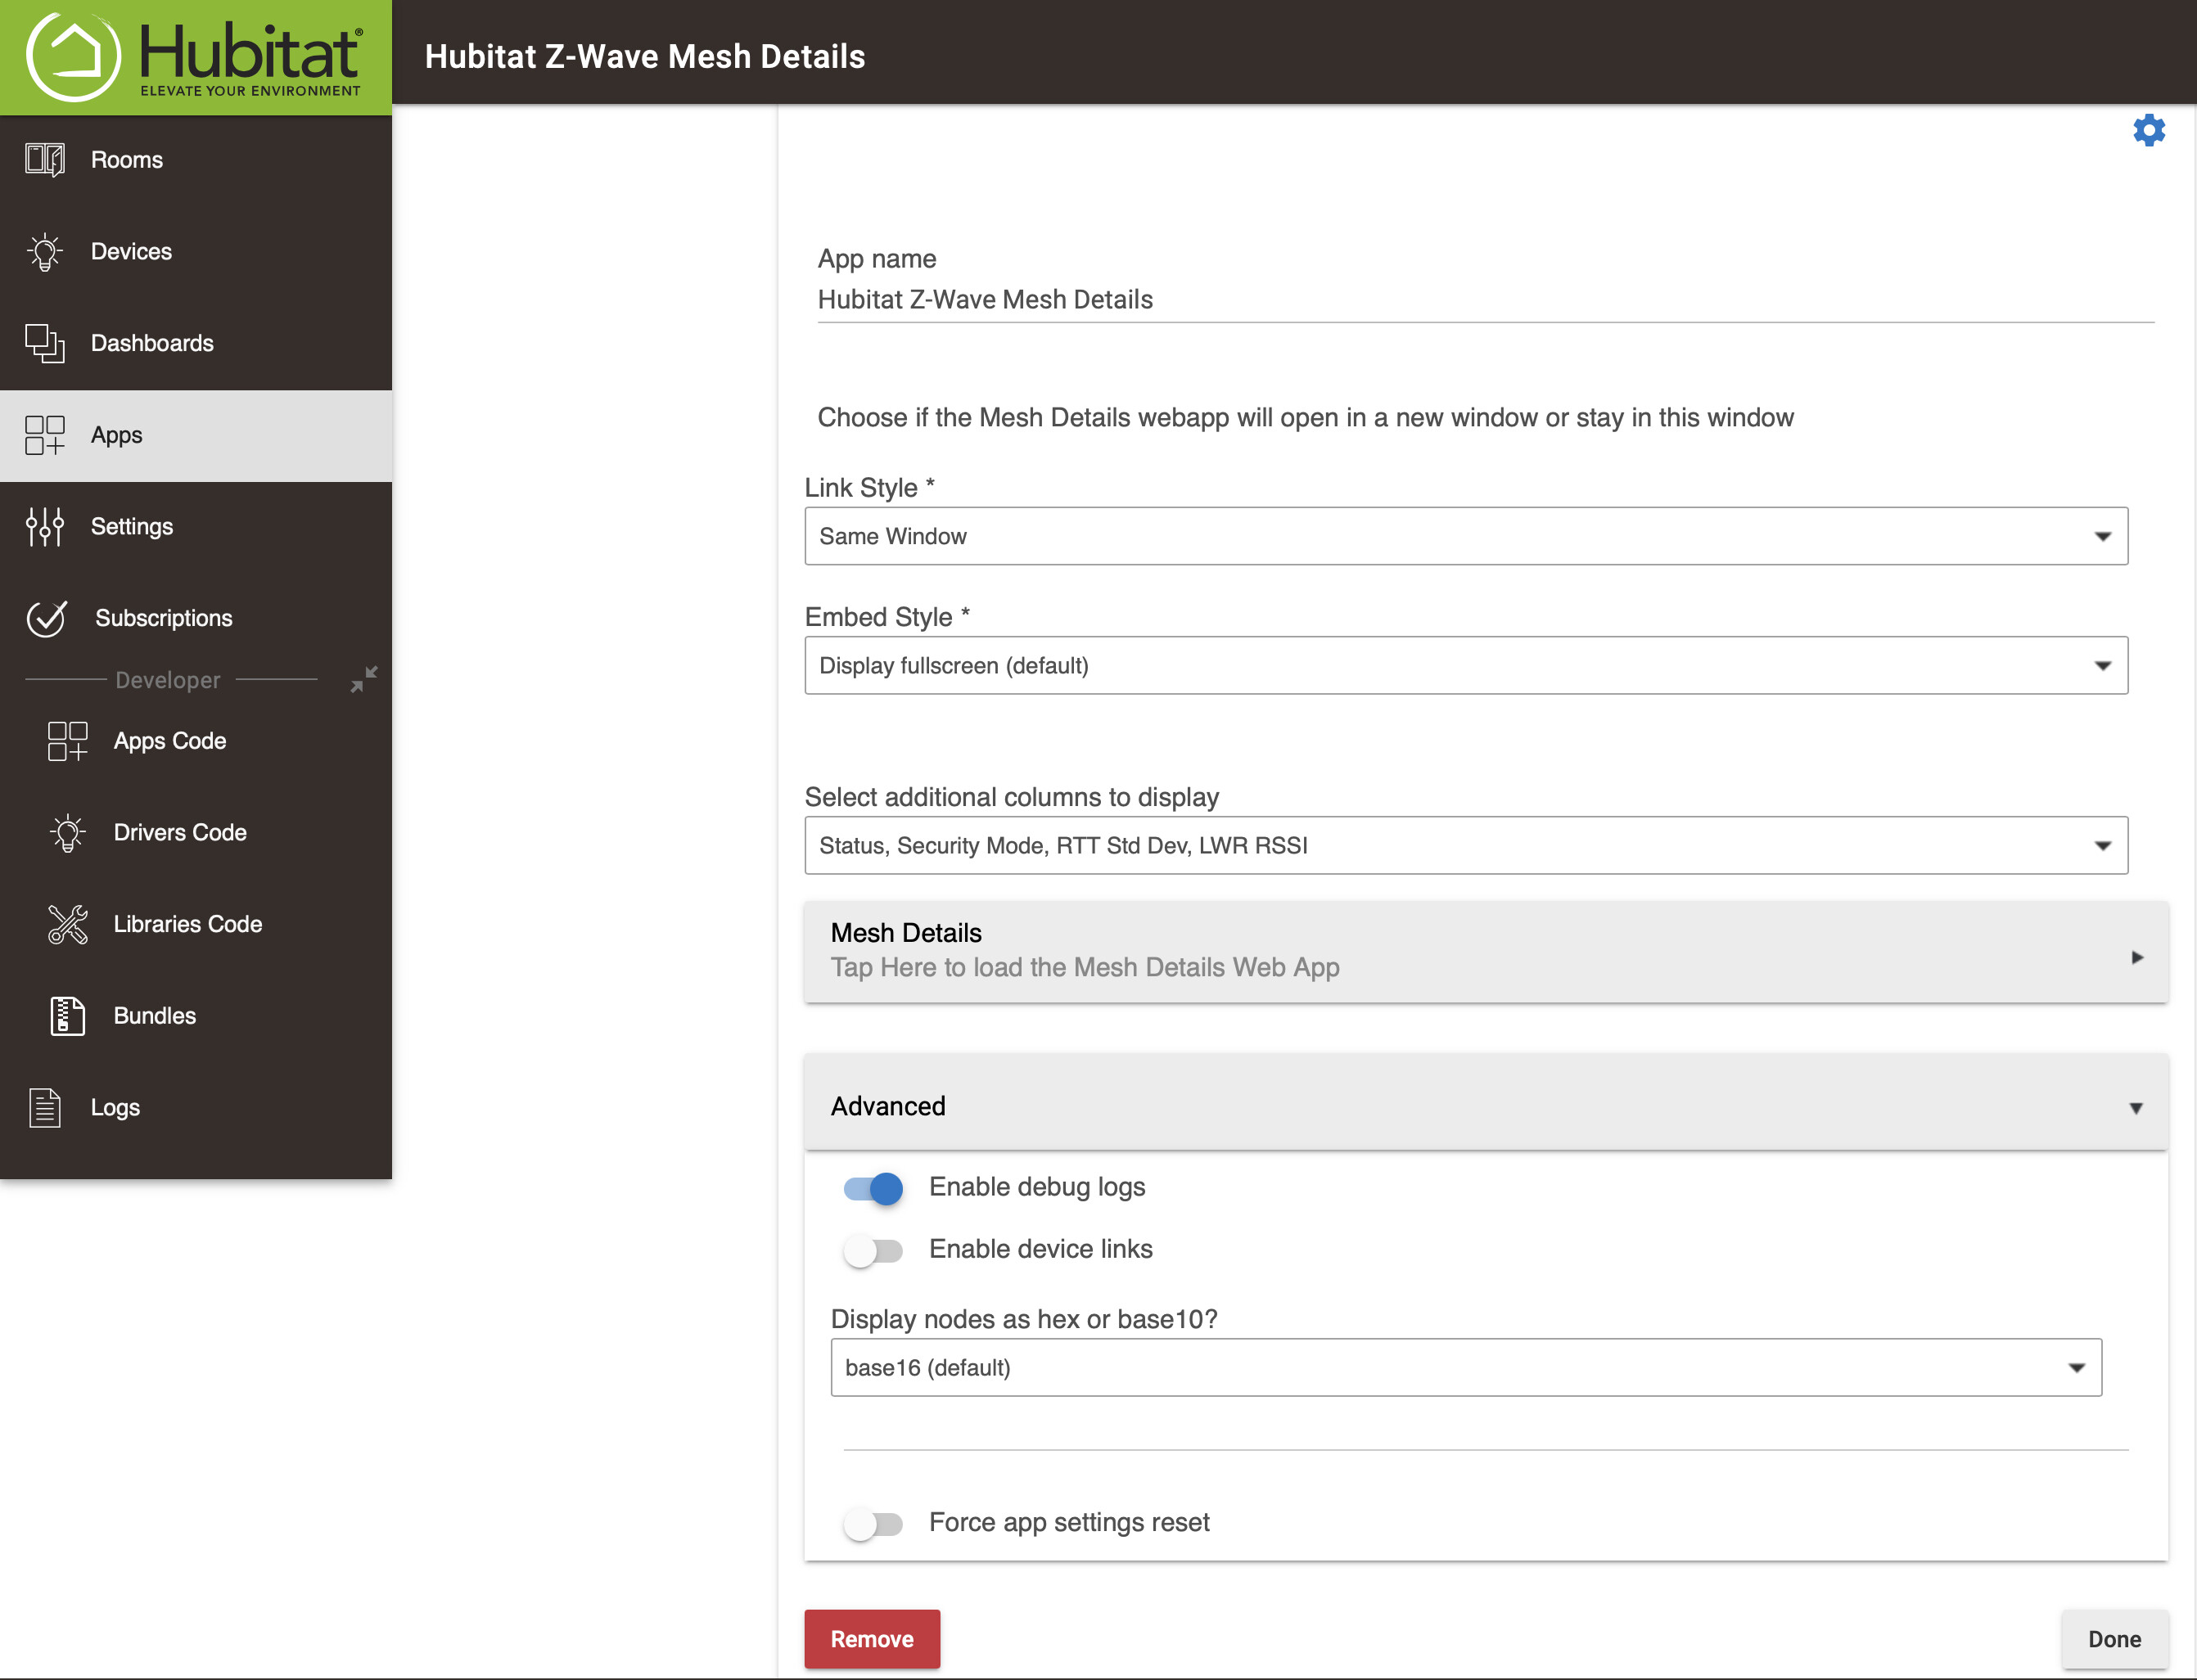
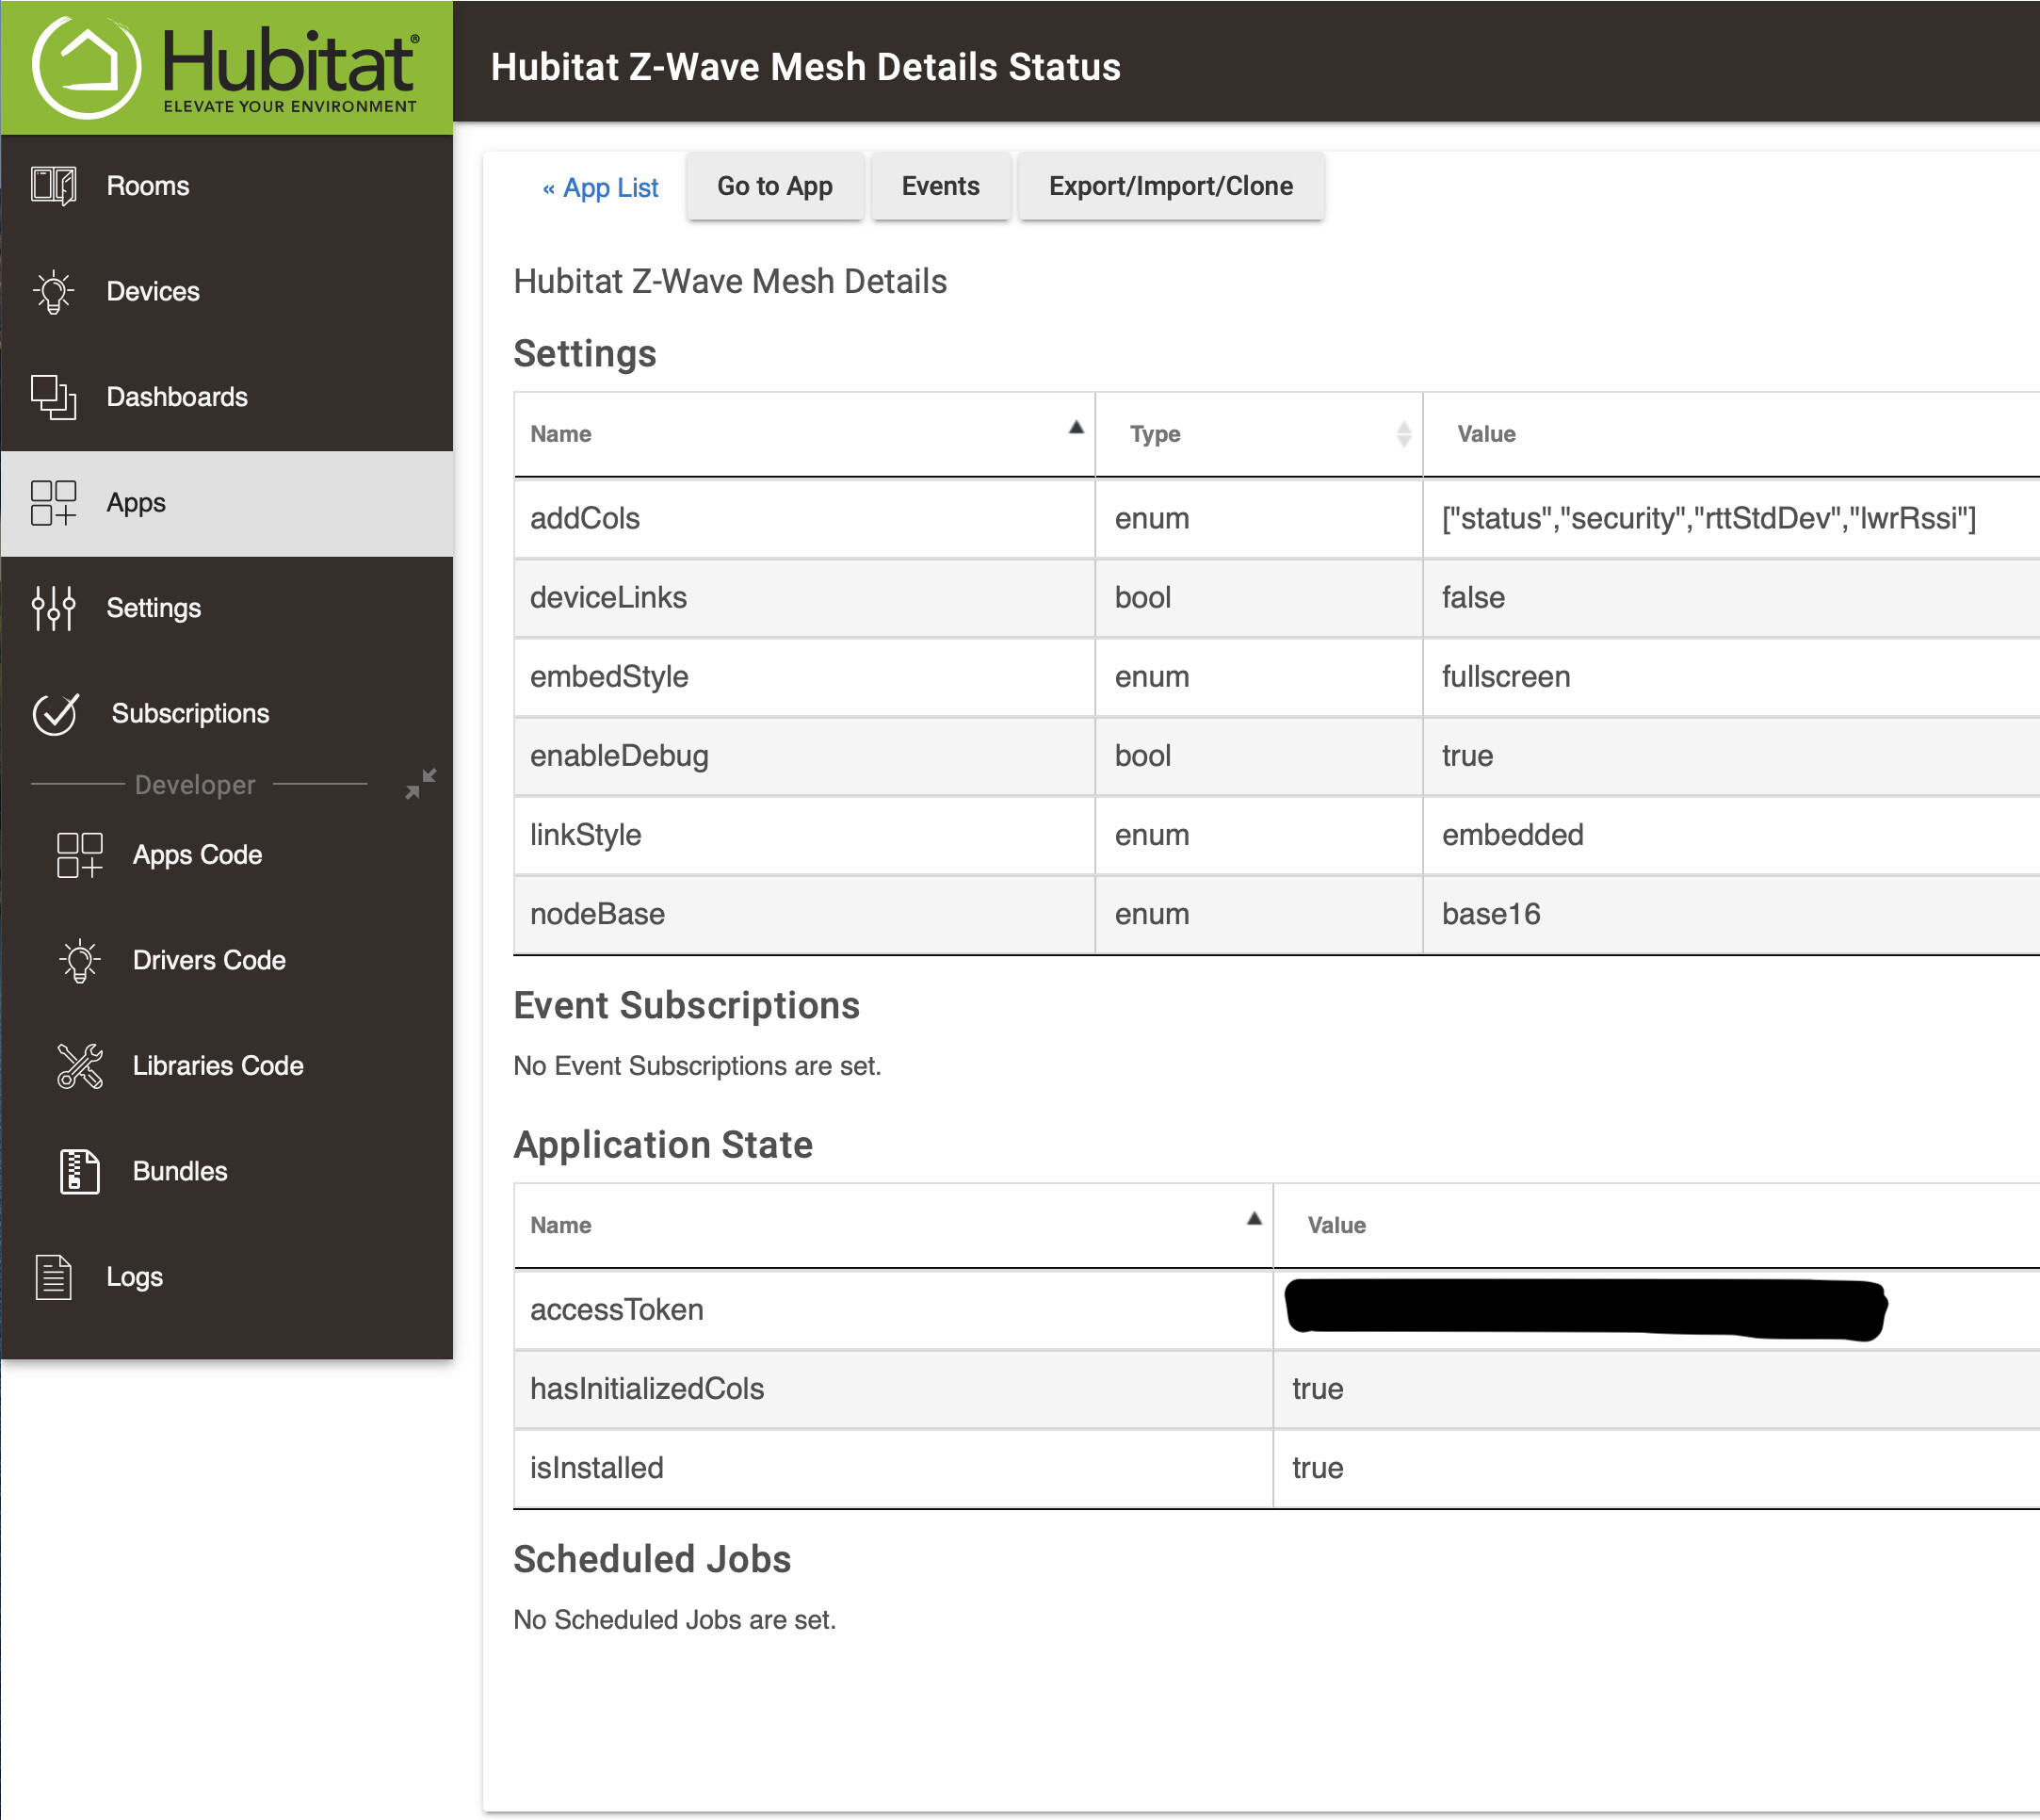
Sure, but I don't think that provides interesting information. Here is the configuration (default) and the Status page:
Mesh Details config screenshot
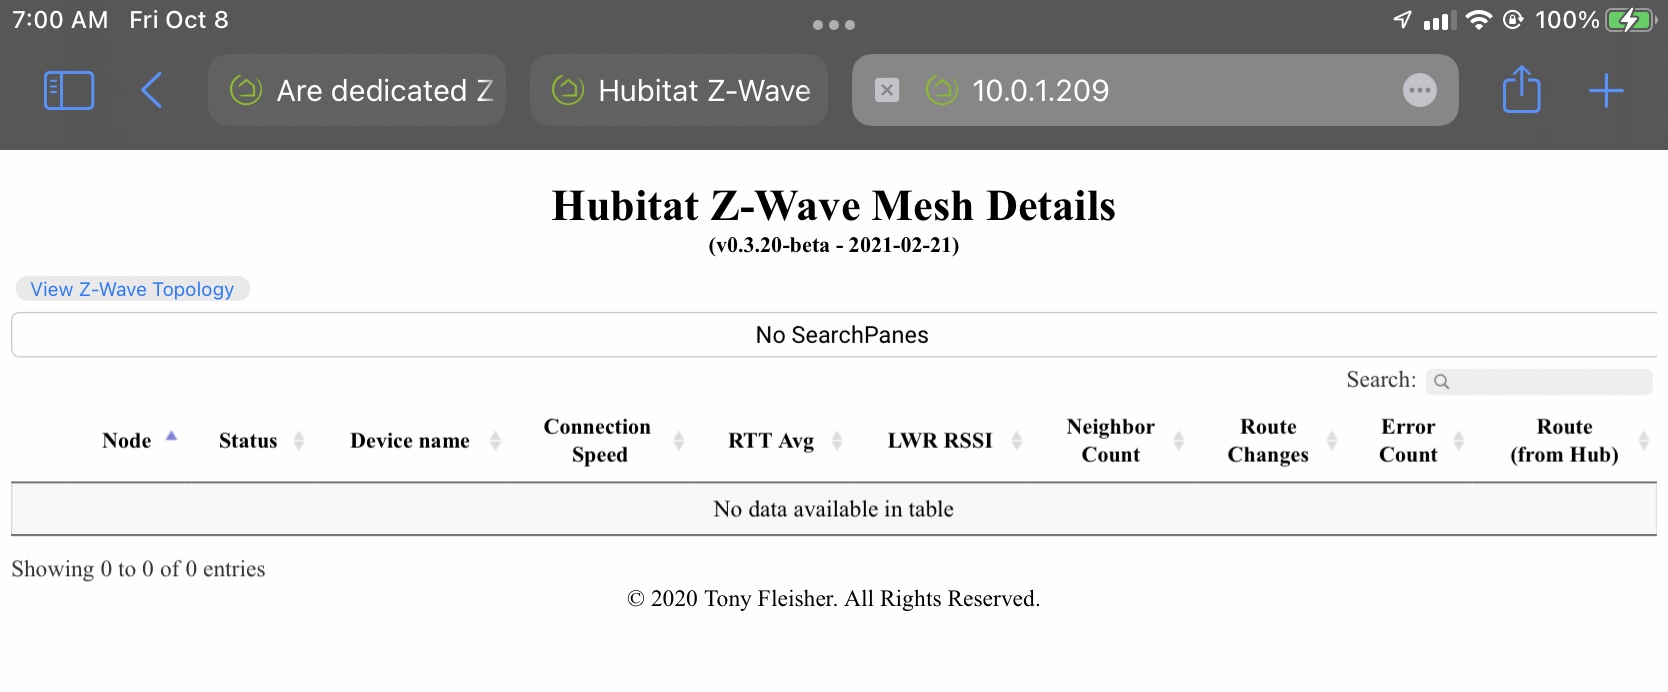
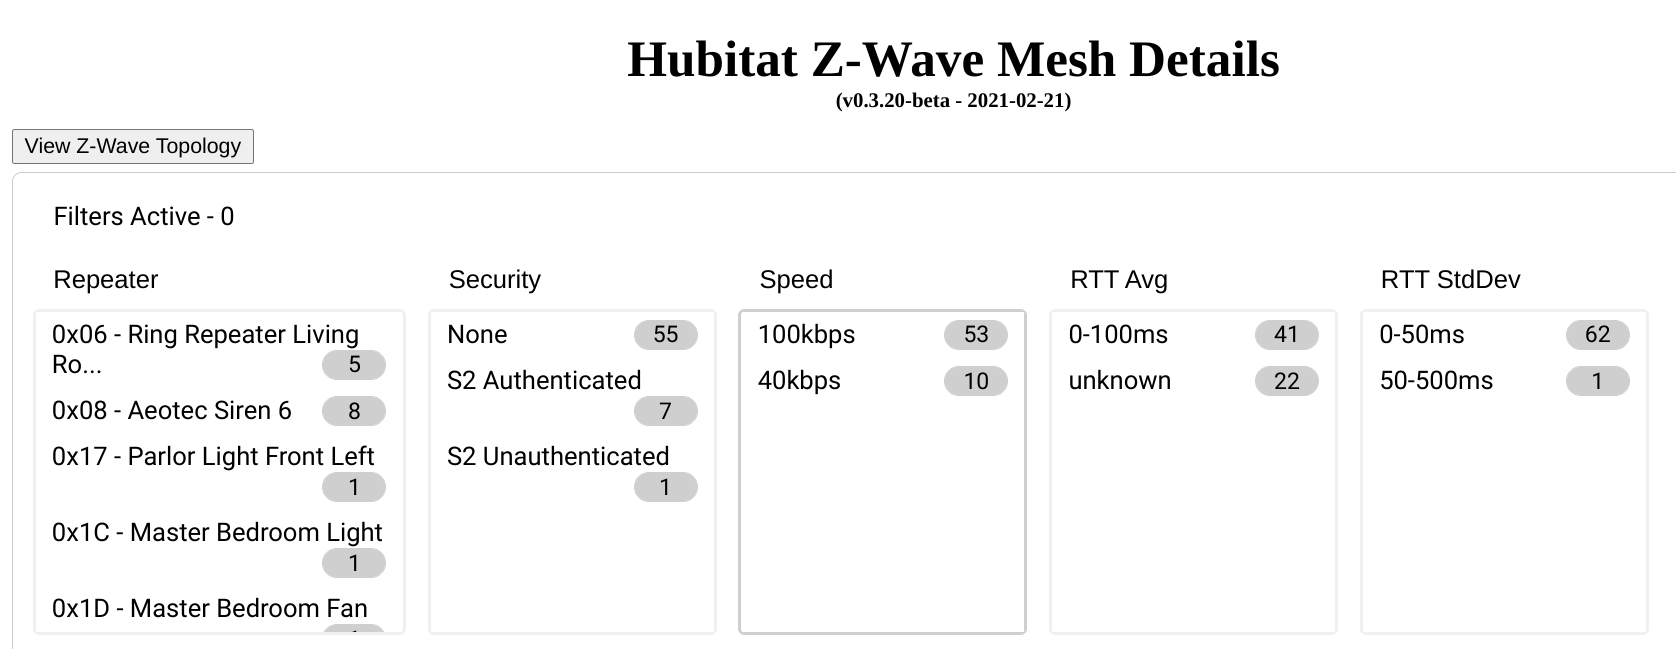
Mesh Details Status screenshot
Now for the testing results. Previously, all of my testing above was on my iPad, where I saw the issues.
Again, in all cases, Hubitat C-7 with 2.2.9.130 (saw identical results on 2.2.9.128 & 2.2.9.129). No Hubitat beta versions were ever installed. The Z-Wave Radio/SDK were updated to 7.14/7.15 with 2.2.9.x. Very vanilla system.
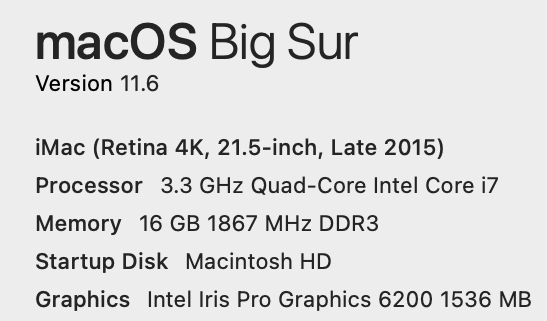
On the iMac (very vanilla system, no jailbreaks, etc., and almost no extensions):
iMac config details
On the iMac, tested with:
Firefox: 93.0 (64 bit)
Chrome: 94.0.4606.81 (Official Build) (x86_64)
Safari: 15.0 (16612.1.29.41.4, 16612)
I could not reproduce the failure with any of these browsers on the iMac.
Moving to the iPad:
512 GB iPadPro 10.5 inch with iPad OS 15.0.2. Everything is very vanilla, no extensions, jailbreaks,
Safari: can reproduce failure as discussed above about 4 out of 5 times. Because I can't figure out how to get a browser console log on Safari on iOS (even poking through all the Settings > Safari > Advanced settings), I connected the iPad to the iMac using a USB cable to use the Web Inspector through the Safari Develop menu on the iMac.
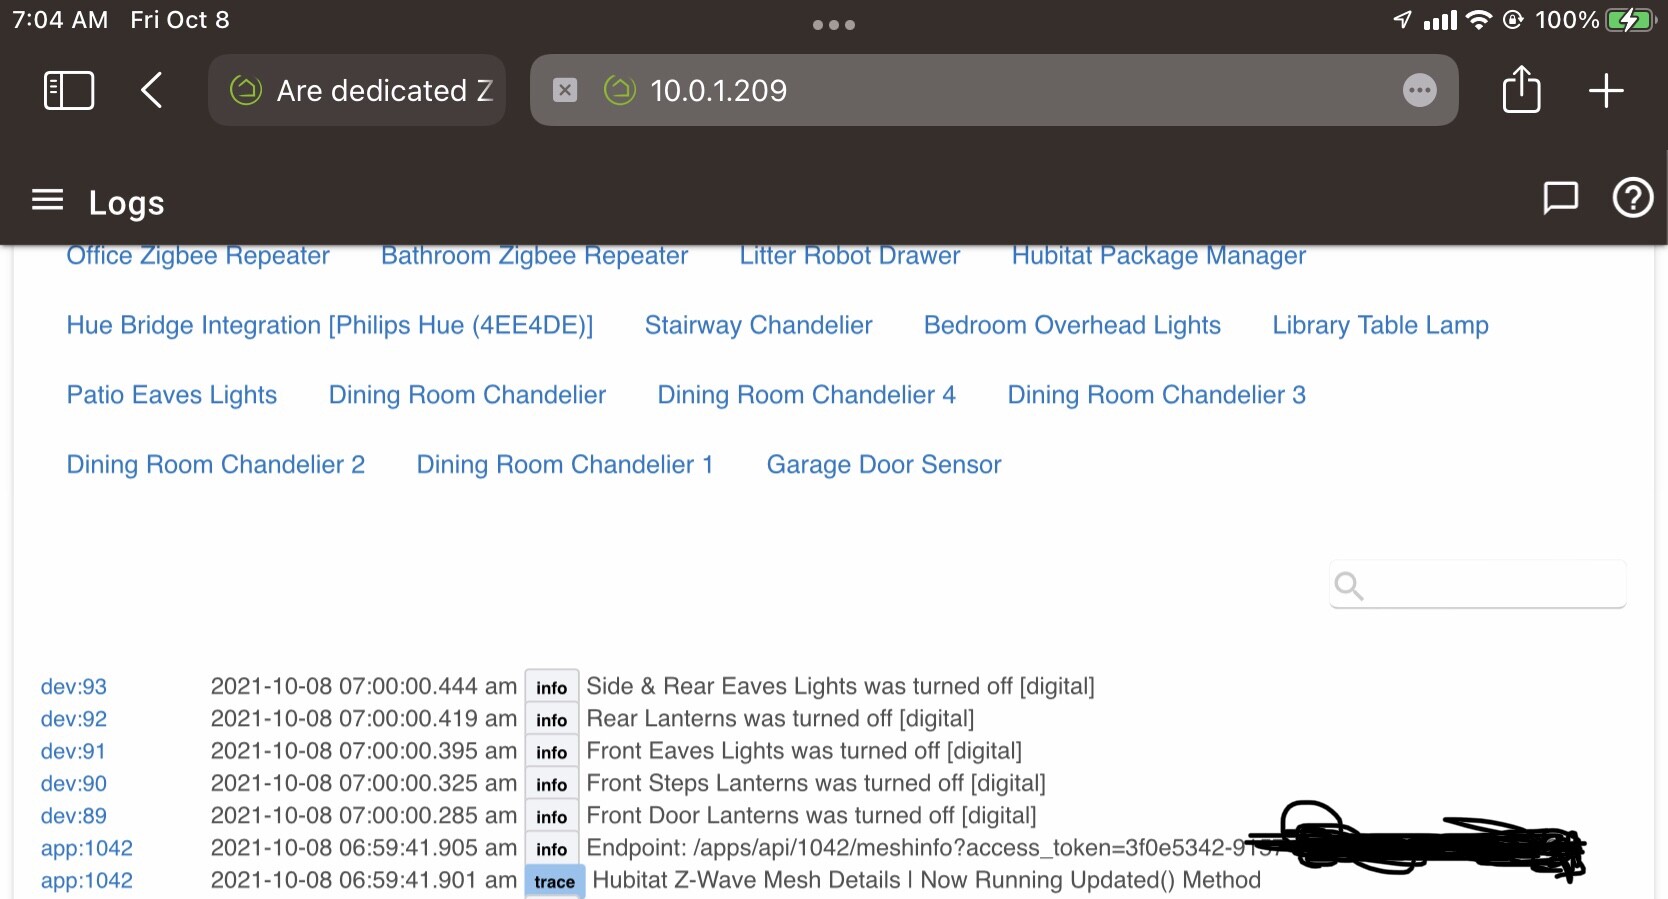
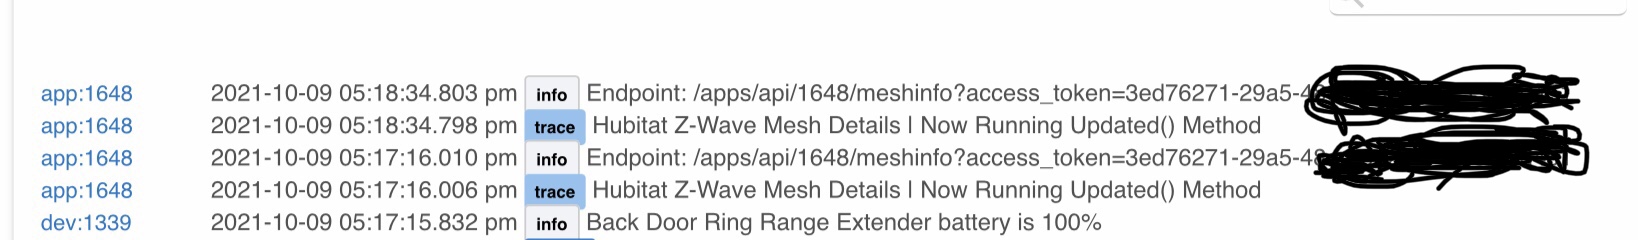
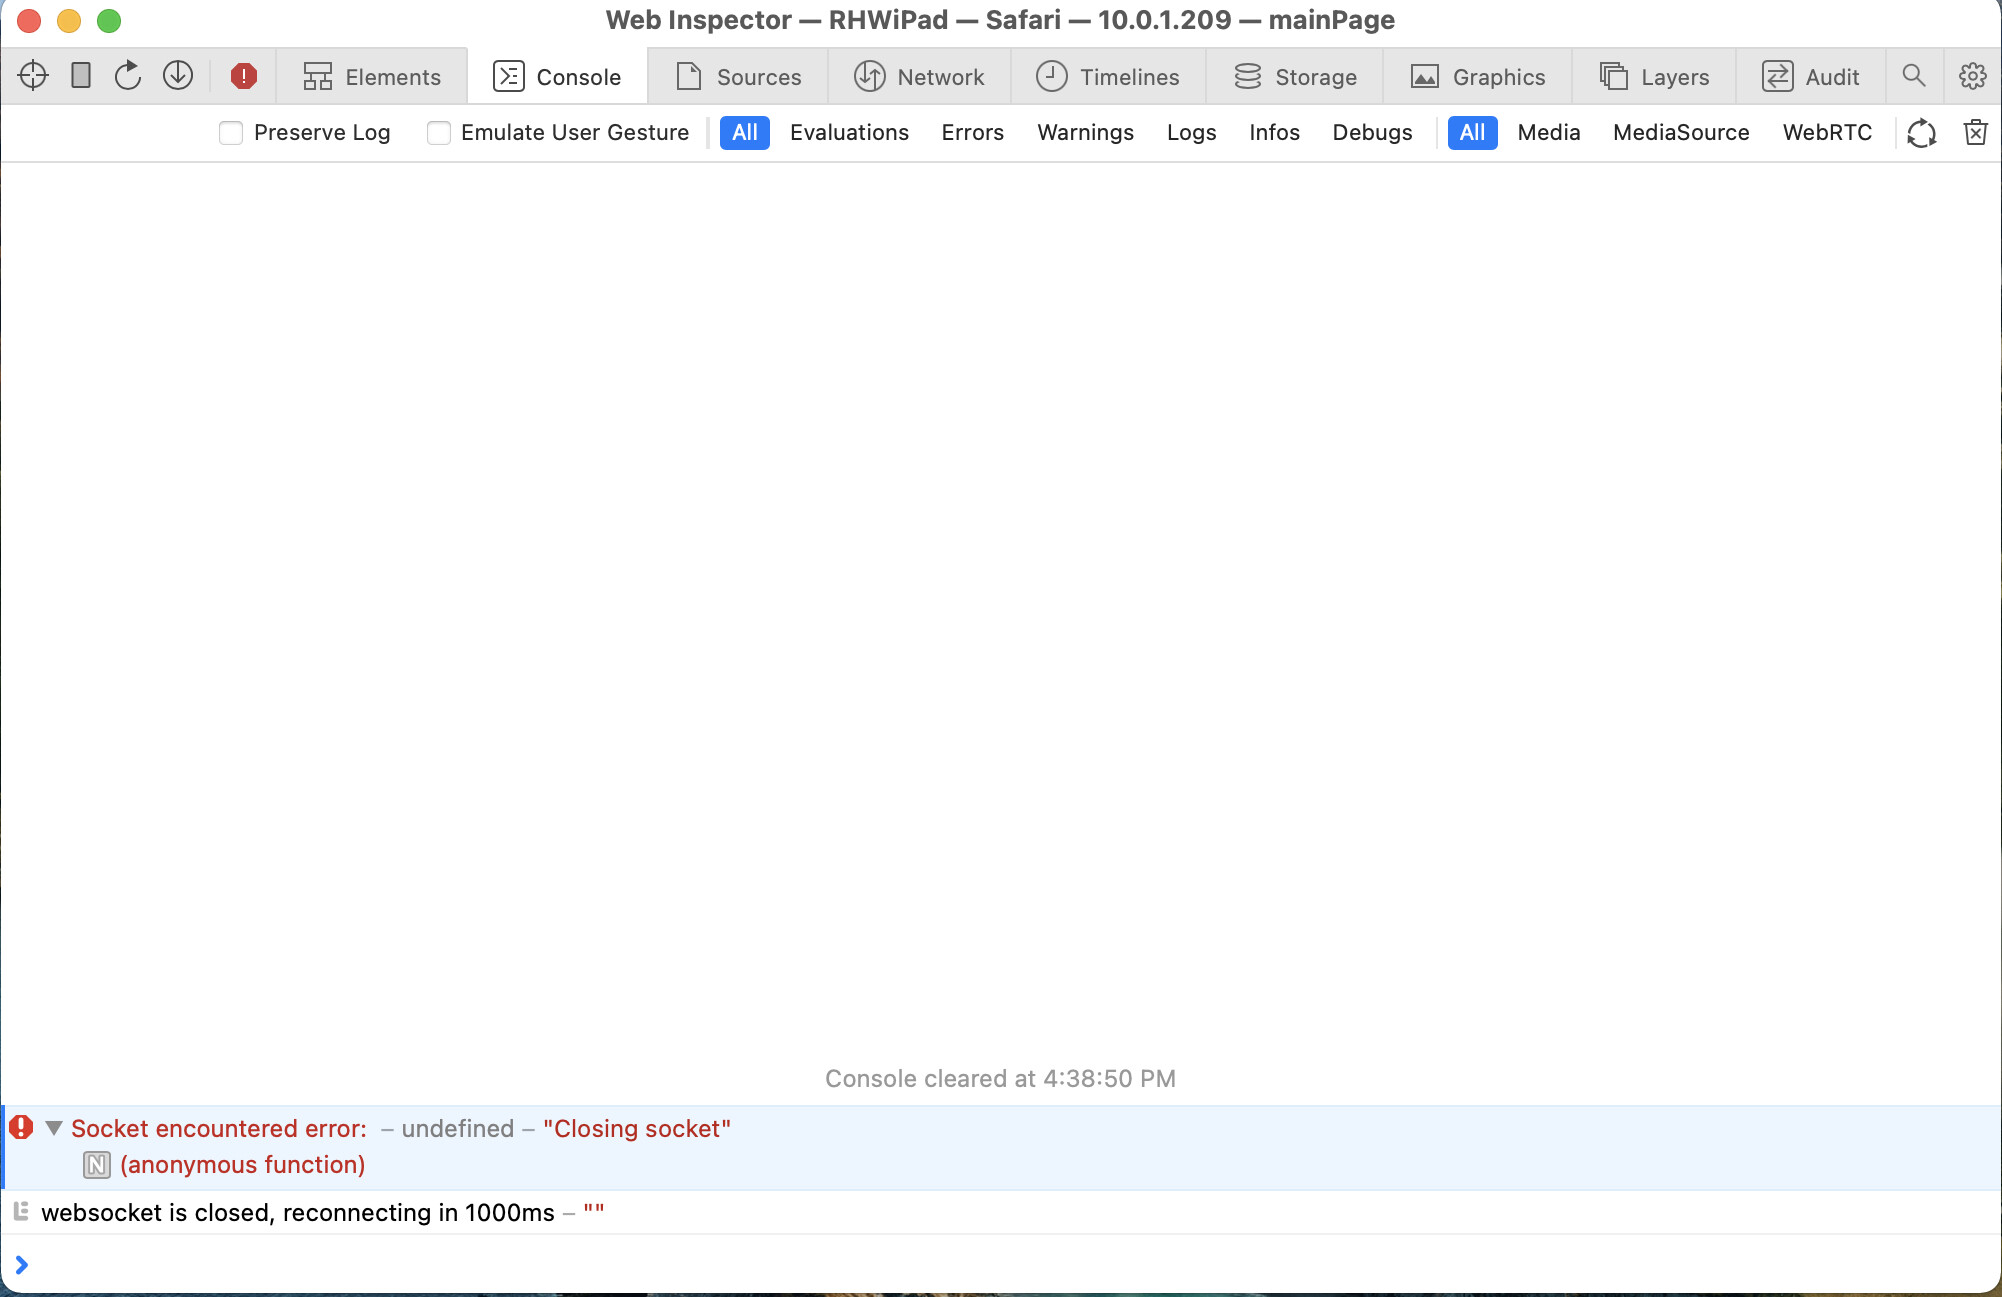
The only error that occurs on the console occurs when the Mesh Details display window is closed and returns back to the Mesh Details app's starting page, and the console then clears when the Done button is pressed, and the results are the same regardless of whether the Mesh Details display window fails to show the mesh details (see screenshots above for failure mode), or when the Mesh Details window is correct. Here is the console when the Mesh Details window is closed and returns to the Mesh Details app's initial page:
iPad Safari console
I believe this is normal because the socket is being closed to the iMac inspector when the window is being closed. Again, this error occurs whenever the Mesh Details window is closed, regardless of whether in failure mode or with a successful display. No other errors appear. The console clears when Mesh Details Done button is pressed on the Mesh Details app's initial page.
I have no idea what iOS Safari version this is; it's whatever comes standard with iOS 15.0, 15.0.1, and 15.0.2 (same results with all recent iOS updates).
Moving to Chrome (version 94.0.4606.76) on iPad OS 15.0.2 (which is really the same as Safari on iOS because it's based on WebKit): Same results as Safari on iOS, fails about 4 out of 5 times. I have no idea how to get the console logs on Chrome on iPadOS.
Moving to Firefox (version 38.1) on iPad OS 15.0.2 (which is really the same as Safari on iOS because it's based on WebKit): Same results as Safari on iOS, fails about 4 out of 5 times. I have no idea how to get the console logs on Firefox on iPadOS.
I then repeated the iPad tests on iPhone, same results as on the iPad.
Anyway, it's clearly a browser issue, perhaps the Z-Wave SDK is a red herring unless it introduced a timing issue, because the common factor seems to be the iOS and iPad OS 15.0.x update. If I need to use Mesh Details on the iPad, I will just launch Mesh Details a few times until I get a successful display. Otherwise, I will just use it on the iMac browser.
Thanks everyone for your suggestions and help. Tony (@tony.fleisher) your program is great.