Am I the only one who can't get dashboards to work properly?

Several months into my migration from Wink to Hubitat, and I find myself frustrated with the whole Dashboard experience. While other users put their fancy Dashboards on display to share what they can do with them, I still cannot get a single Dashboard with consistently working buttons.

The problem doesn't seem to be Z-wave connectivity. I will literally send a command with the dashboard only to see the button in the hourglass stuck in the "sending....." status. The command does not get executed. Then when I tell Alexa to execute the exact same command, the command goes through immediately. And the identical button in Dashboard is still stuck with "Sending....."

Other times the problems is that the Dashboard buttons don't reflect the actual status of the device. For example, the device will be off and Dashboard will say they are on.

Yet again, the commands will go through via Dashboard but the screen will still say "Sending....."

I'm using Dashboards through a Safari browser on my various iPads. Sometimes I think the browser is the problem, and when I refresh it, the previously stuck buttons will be unstuck, but give the wrong status for the device.

Is there something I'm missing here? I was ready to spend time building these dashboards to replace Wink's automatically-constructed GUI, but after all this trouble and effort, the Dashboards I have just seem useless. And it's not that they are always useless - many times the buttons will work, and then suddenly they just stop working.
I forgot to add... the problem seems to happen even when I use the Dashboards via the Hubitat App. There doesn't seem to be any one device type it happens to, but most of my devices are either Switches, Color Bulbs, or Fans.

Are you using the local URL direct to the dashboard? I've noticed similar issues (tiles showing incorrect status) when using the direct LAN URL. Clicking the green check mark at the top sometimes refreshes the tiles and fixes the issue. I never have issues when bringing up the dashboards via the menu in the hubitat web interface. I use chrome across all my devices.

Works mostly fine for me on Chrome on Android. Sometimes needs a reconnect using the green tick as per above comment.

Suggest log a support ticket if you can't even get a simple dashboard to work reliably. Also make sure the device is definitely responding first on the device page.

1 Like

That isn't normal. They should work for you like they do for most everyone else.

So are there some specific brand/model devices that have this dashboard issue, or is it every/any device or device type? Zwave, Zigbee, and so on.

That usually happens if a device isn't talking to the hub (mesh problems), you have a wrong driver, or an issue with just a bad device.

So I would give us a list of what devices don't work correctly, and see if there is something we can work through.

Hey everyone. Thanks for the responses. I appreciate it. Here are my follow up answers.

It doesn't appear to be a specific brand/model of device that has the Dashboard issue. I have Leviton light switches, Philips Hue Lightstrips, Leviton Smart Plugs, Lutron Dimmers, etc, and as far as I can tell the problem occurs with a variety of devices.

It doesn't even appear to be a few specific devices. In fact, it isn't even necessarily the same problem devices. A given device can work just fine and then, after pressing it on/off a few times, it will hang on sending a command.

I don't think it's a bad device problem in most cases because Alexa will still be able to send a command through Hubitat to control the device even when the Dashboard chokes.

I have at least 70-80 Z-wave and Zigbee devices so I'll try to take this a few problem devices at a time. For example, I'm in the Study Room, I have my Study Room dashboard loaded up on my iPad via the Hubitat App. Right away I can see that the Switch for Study Room Fan Lights is returning wrong information - it says the switch is on when in fact I know it isn't. When I send the Off command via the dashboard, it chokes on the "Sending...." with hourglass icon. But when I tell Alexa, "Turn on Study Room Fan Lights" the lights respond RIGHT AWAY. Meanwhile, the Dashboard icon STILL has the "Sending...." with hourglass.... but when I press it, the Study Room Fan Lights turn off.... So the button is functional but displaying wrong information.

This particular switch named Study Room Fan Lights is a Leviton DZ15S-1BZ Decora Smart Switch with Z-Wave Technology. Most of my Z-wave devices are this, but again, the problem does not occur exclusively with this device.

Elsewhere on the dashboard I have another Switch for Study Room Hall Lights. This button correctly shows those lights to be off. When I press the dashboard button for Study Room Hall Lights, those lights turn on immediately but... the dashboard button is again stuck saying the "sending....." Despite this, I can press the button and turn the lights off again, but when I try to turn them on, no go. However, Alexa can turn them on when issued a voice command... so again, I think the Z-wave mesh isn't the issue here. Again, this is also a Leviton DZ15s.

it sounds like you may have too many temp/multi sensors or switches with power reporting sending reports too often and every so often overloading the hub..

1 Like

I concur, you might want to look at your logs or turn on logging on the devices to confirm that (or email Support asking if there is a better way to determine that), and if so, consider;

  1. Reducing the reporting on some of your devices. E.g. for a multi-sensor I have that was spamming my device, I changed the reporting from real-time to every 10minutes as I don't need to know the humidity, temp, etc in realtime (and it will still send an update inbetween if there is a temp swing) while the motion sensor aspect of it will still work.

  2. Consider a 2nd hub to offshore some devices and use Hub Connect or the new Hub mesh to sync states.

1 Like

OK. I actually don't have any temperature sensors or other sensors at this point. I did go into "Study Room Fan Lights" and "Study Room Hall Lights" in the devices menu and selected the option to "Enable debug logging." Is that what you were referring to? If so, where would I next go to see the logs?

OK, scratch that, I found the Logs part. Here is what happened when I tried to turn "Off" the Study Room Fan Lights, which the Dashboard button reported was "On" even though it was already Off:

dev:512020-12-15 08:49:37.492 pm debugparse description: zw device: 27, command: 8201, payload: , isMulticast: false

Does this make sense to anyone?

The above statement, by the way, was what displayed when I clicked on the Study Room Fan Lights channel above, just to be clear.

And what driver (Device Type) is this using? This is found on the device settings page, about halfway down.

Edit: does that same page at the bottom show firmware information?

It says next to Type: "Generic Z-wave Smart Switch"

No, I don't see any mention of firmware information. I don't think these switches have firmware?

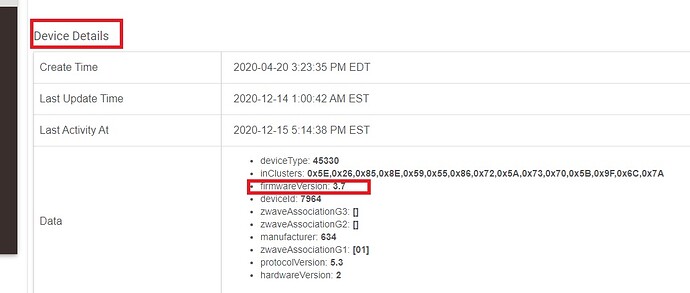
All zwave devices have firmware, otherwise they couldn't work. Usually it is shown here (this isn't the same switch):

OR by temporarily changing the driver to Device, save. Open logs in a new tab. Back on the device's setting page, click "Get Info" button. The output is displayed in the logs.

Either way, if you search you will see LOTS of complaints about the Leviton, and a firmware update fixes them from what most people seem to be saying. I am not sure what the latest firmware is, but I would call Leviton once you have the old firmware version, and see if there is an update.

The other thing I saw in a few threads by searching was a possible driver issue. You might try one of the other Zwave switch drivers, maybe the Zwave CentralScene Switch driver would work better? There is also at least one community driver floating around here that might help, but I am not familiar enough with these to know if one of these drivers might work better than another.

This is what I found. I don't think this is what you are looking for:

Nope, that isn't showing the firmware. Try the other way with changing the driver to "Device".

I changed the device type to "Device," saved, open the logs in a separate page, went back to the device settings and clicked "get info." This is what I got under logs:

I'm completely unfamiliar with the process of updating firmware on my Leviton devices, of which I have at least 4 different kinds. In my naivete I guess I assumed that the smart hub would tell me what to do when I needed to do it.

Hmm, that isn't showing firmware version either. Weird. But moving on for the moment I guess.

There are two parts to this. You need a firmware file. That usually comes from the manufacturer, but you can sometimes find it online with some careful searching.

Then you need a firmware updater. The C7 has one built in, or there is a community based app for older hubs.

The process in theory is fairly straightforward, you fire up the app, tell it where to apply the firmware update, and that is that.

This isn't an automated process, I susptect most people would not want this happening automatically. Normally this device update is a rare thing to do. You might do just one update on a device, if you even ever have to do this.

So did you try another driver and see if that made any difference here? That is the easiest and quickest thing to try and see if you note any improvement.

So I did some research regarding the firmware updating thing. It looks like I would have to buy a USB Z-wave stick, which usually runs around $50, install some compatible Mac Software, exclude the devices I want to update (I have lots), update the firmware and then pair with Hubitat.

This would be extremely inconvenient.

Regarding the other option - trying another driver, I don't see an obvious choice. Currently the Leviton switches are using "Generic Z-wave switch." Are there any other specific suggests to try for the Leviton Z-wave switches? I saw a few Leviton drivers but none of them seemed to be for this switch.