Hi hope someone can give me an idea of what's going on..
About 2 hours ago, all of sudden my zwave switches stopped responding to hubitat's command to turn on or off, this includes inovelli red/black series dimmer/switch, GE quick fit switch, GE motion dimmer, as well as Yale lock.
ZWave motion sensor seems to work, and if I manually turn on or off the switch, the status is reported correctly. The Yale locks are completely dead..
I tried to reboot and shutdown the hub, repair zwave network, ,etc, nothing helps.
Yes, I waited for about a minute.
No everything started to work by itslef...
This is the 2ne time in a week that leave devices stopped working.
First time I got a lot of zwave network busy message in the logs.
This time I don't see much of time, instead turning on and off just didn't work. When I repaired the network, got a lot of node unreachable error.
Is there anything I can do to further understand this? Really don't want to go through this again.
The busy messages are usually caused by mesh issues. Check settings, zwave details and look under the clusters column for any devices that are blank there. If so then you need to remove those, factory reset the device and re-pair it. When you remove it you may end up with it stuck in limbo hit refresh and try to remove again. If it still wont go away let it sit overnight and see if the nightly maintenance will clear it. If it's still there then pickup a zwave secondary controller like the nortel or uzb and use pc controller to remove it.
Yes I do have c7 hub, and I do not have any ghost device. I had one about a month back and removed it by the USB stick and PC controller.
What's weird is that it was working fine until last week things became a little unstable.
At least for today's incident, I did not have leave busy error. zwave motion sensor worked fine, zwave switch can report on/off state if turned on/off physically, but will not turn on/off via hub. I don't see any command sent in the log..
Rebooting fixes the issues though? Power up your PC Controller software and launch IMA Network. Run Network Health and give it some time to gather all the device info. It takes about a minute or two per device so give it plenty of time to go through each one. See if you have any red bars in there.
Rebooting doesn't reset the Z-Wave radio but pulling the power does if you leave it out for long enough. A minute or two is usually good enough for the zwave side. Leave it out for 20 minutes or so for the zigbee side.
Hi @lewis.heidrick, I ran the provided stata on my hub where I'm experiencing almost the same scenario like @tonni83.
I have 50+ Z-wave devices and about 50+ webCore pistons.
Please help.
Thanks in Advance
Here is the result:
Device Stats enabled: true
Device stats start time: 1604085707399
Device stats total run time: 1120819
device id 61 runcount 201 total runtime 3259 average run time 16.2139303483
device id 101 runcount 158 total runtime 2496 average run time 15.7974683544
device id 3 runcount 62 total runtime 63576 average run time 1025.4193548387
device id 226 runcount 132 total runtime 1065 average run time 8.0681818182
device id 161 runcount 900 total runtime 10313 average run time 11.4588888889
device id 162 runcount 90 total runtime 927 average run time 10.3
device id 194 runcount 2410 total runtime 24270 average run time 10.0705394191
device id 257 runcount 20 total runtime 104 average run time 5.2
device id 33 runcount 44 total runtime 38686 average run time 879.2272727273
device id 195 runcount 822 total runtime 5242 average run time 6.3771289538
device id 4 runcount 22 total runtime 74 average run time 3.3636363636
device id 1 runcount 1 total runtime 4 average run time 4
device id 45 runcount 9 total runtime 53 average run time 5.8888888889
device id 165 runcount 18 total runtime 99 average run time 5.5
device id 163 runcount 3 total runtime 80 average run time 26.6666666667
device id 44 runcount 4 total runtime 49 average run time 12.25
device id 50 runcount 4 total runtime 22 average run time 5.5
device id 53 runcount 4 total runtime 21 average run time 5.25
device id 51 runcount 1 total runtime 3 average run time 3
device id 38 runcount 8 total runtime 38 average run time 4.75
device id 39 runcount 4 total runtime 32 average run time 8
device id 37 runcount 18 total runtime 1838 average run time 102.1111111111
device id 48 runcount 3 total runtime 212 average run time 70.6666666667
device id 49 runcount 3 total runtime 239 average run time 79.6666666667
device id 60 runcount 15 total runtime 122 average run time 8.1333333333
device id 196 runcount 12 total runtime 143 average run time 11.9166666667
App Stats enabled: true
App stats start time: 1604085707403
App stats total run time: 1120820
app id 6 runcount 151 total runtime 43774 average run time 289.8940397351
app id 129 runcount 305 total runtime 11000 average run time 36.0655737705
app id 244 runcount 2 total runtime 385 average run time 192.5
app id 262 runcount 35 total runtime 11817 average run time 337.6285714286
app id 323 runcount 35 total runtime 14916 average run time 426.1714285714
app id 260 runcount 35 total runtime 12858 average run time 367.3714285714
app id 161 runcount 35 total runtime 12628 average run time 360.8
app id 166 runcount 35 total runtime 12357 average run time 353.0571428571
app id 165 runcount 10 total runtime 1089 average run time 108.9
app id 164 runcount 10 total runtime 1832 average run time 183.2
app id 325 runcount 33 total runtime 10574 average run time 320.4242424242
app id 160 runcount 1 total runtime 420 average run time 420
app id 327 runcount 21 total runtime 3403 average run time 162.0476190476
app id 331 runcount 21 total runtime 2653 average run time 126.3333333333
app id 70 runcount 13 total runtime 364 average run time 28
app id 132 runcount 7 total runtime 935 average run time 133.5714285714
app id 157 runcount 4 total runtime 949 average run time 237.25
app id 290 runcount 4 total runtime 557 average run time 139.25
app id 158 runcount 1 total runtime 668 average run time 668
app id 136 runcount 3 total runtime 411 average run time 137
app id 139 runcount 2 total runtime 264 average run time 132
app id 133 runcount 6 total runtime 727 average run time 121.1666666667
app id 145 runcount 1 total runtime 169 average run time 169
app id 137 runcount 1 total runtime 65 average run time 65
app id 3 runcount 68 total runtime 4989 average run time 73.3676470588
app id 247 runcount 7 total runtime 135 average run time 19.2857142857
app id 385 runcount 10 total runtime 228 average run time 22.8
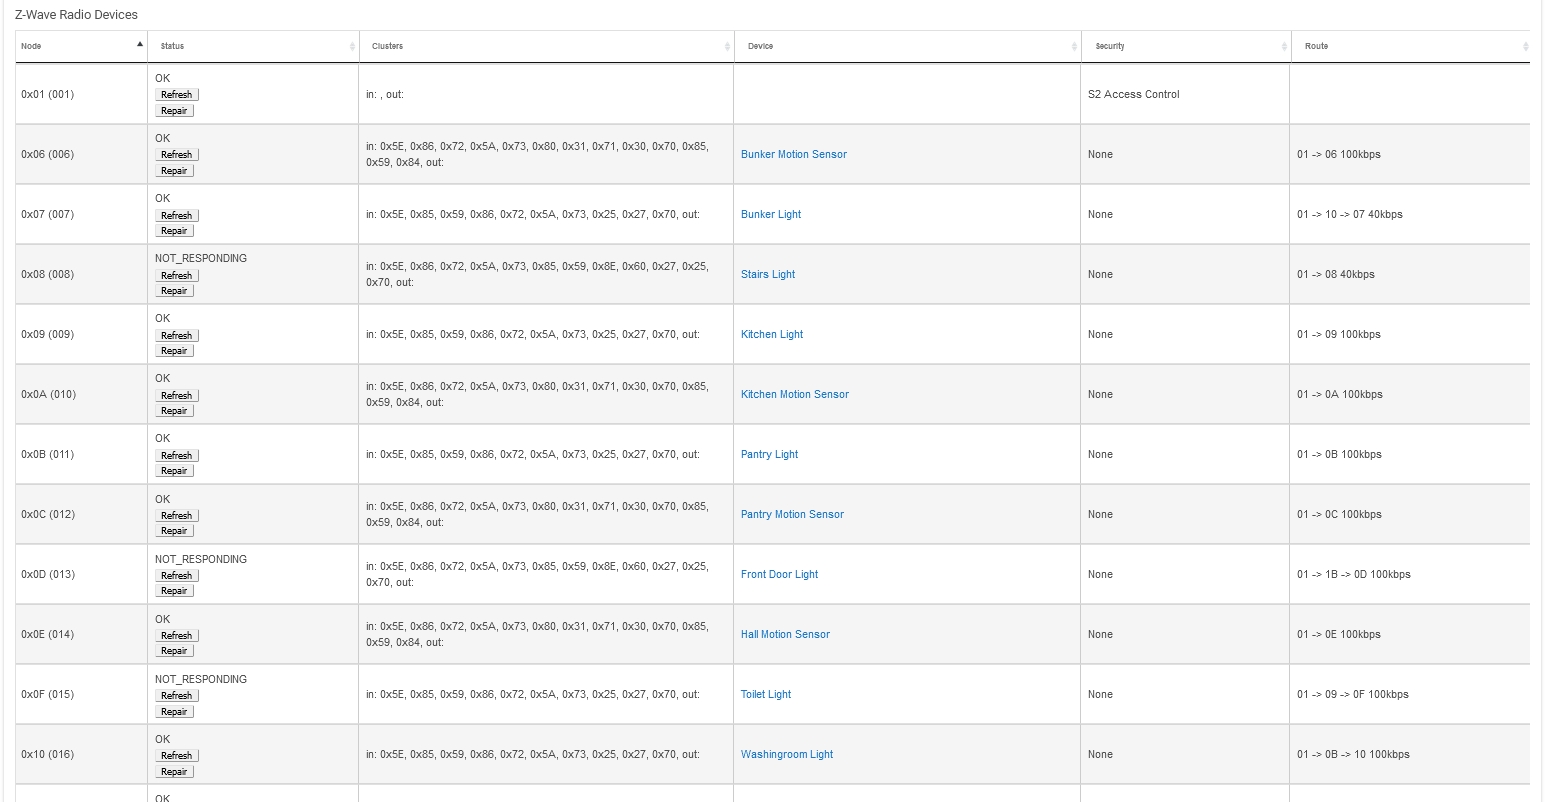
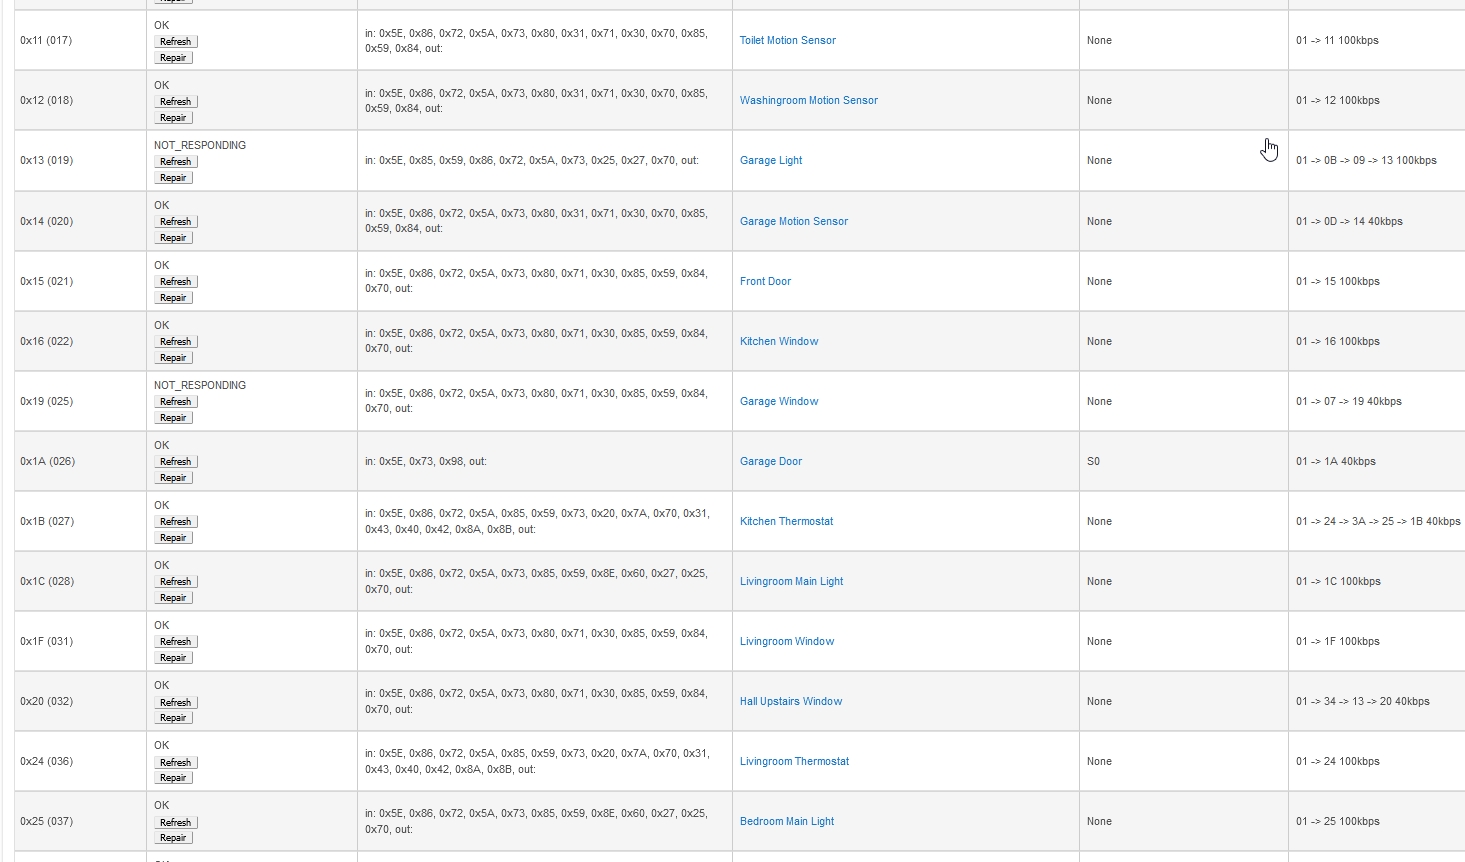
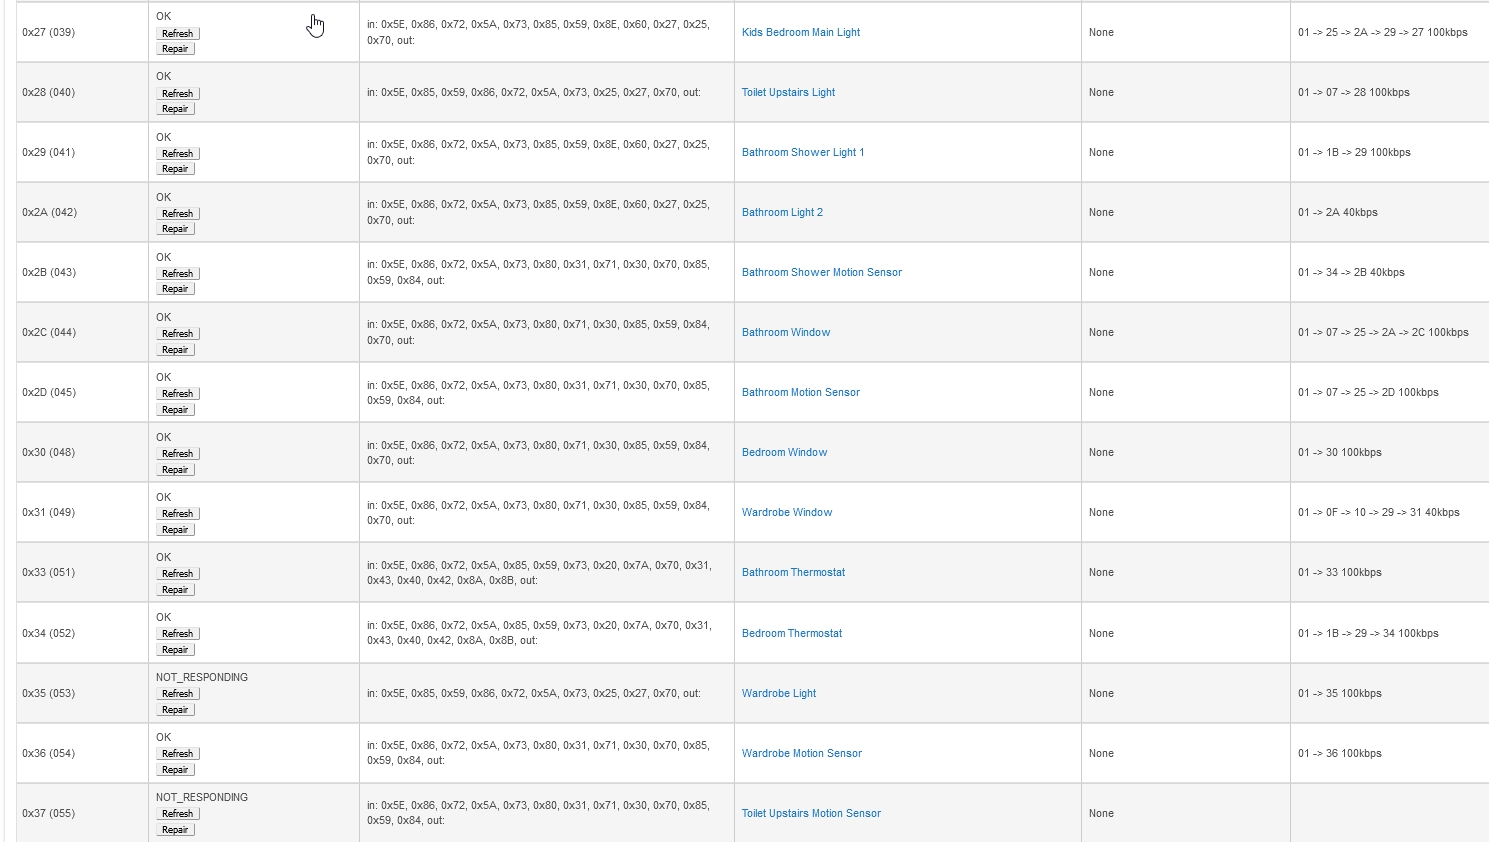
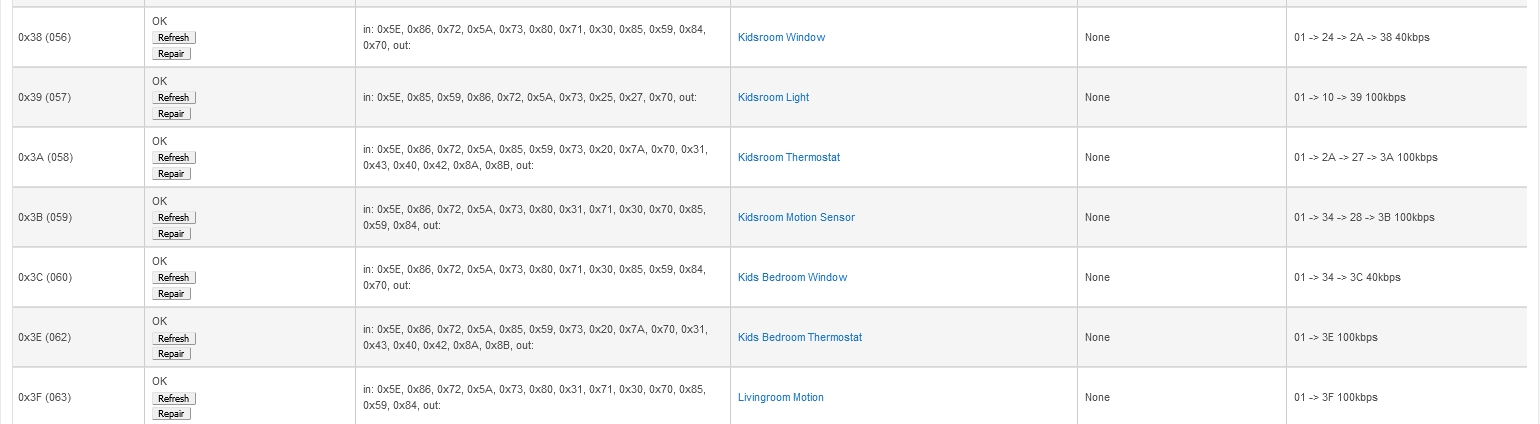
On the NOT battery powered light switches with "Not Responding" status I applied the repair and all of them are in status OK now but currently "Route" tab is empty.
There left 2 devices with "Not Responding" but they are battery powered devices (window sensor and motion sensor).
Watch for more not responding's on powered devices you may need to reinforce those areas. Especially since they are plus devices and should be able to repair themselves normally.