During the day you won't see much difference, but during the nightly cleanup, or during a reboot, the number of events/states should be trimmed to what you've specified.
So "2" means that after cleanup or reboot I should see (2 x attribute=) lines in devices event history? If there is 30 attributes in device it means 60 events right? Should I see it in device event history so that there's no more than 60 lines (one line seems to be one event)
Because I'm 100% sure that after reboot I have way more events that what I set.
I would expect that to be correct, as the activity probably goes similar to:
- Reboot initiated
- At recovery point x, perform log truncation
- Continue recovery actions
- Re-initialize devices
- Other checks and activations
- Open up UI
- Resume normal processing
So by the time you get the system back it's actually been actively communicating with your devices and apps for a couple of minutes and the events/states are accumulating again.
1 Like
Something just doesn't add up..
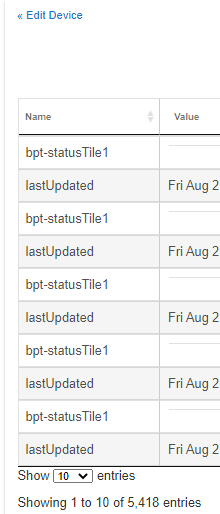
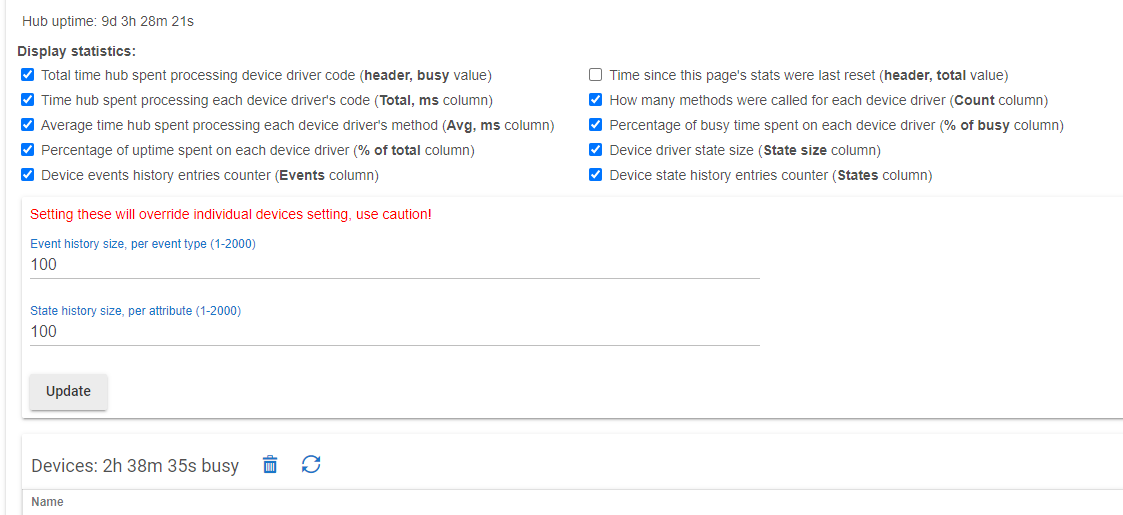
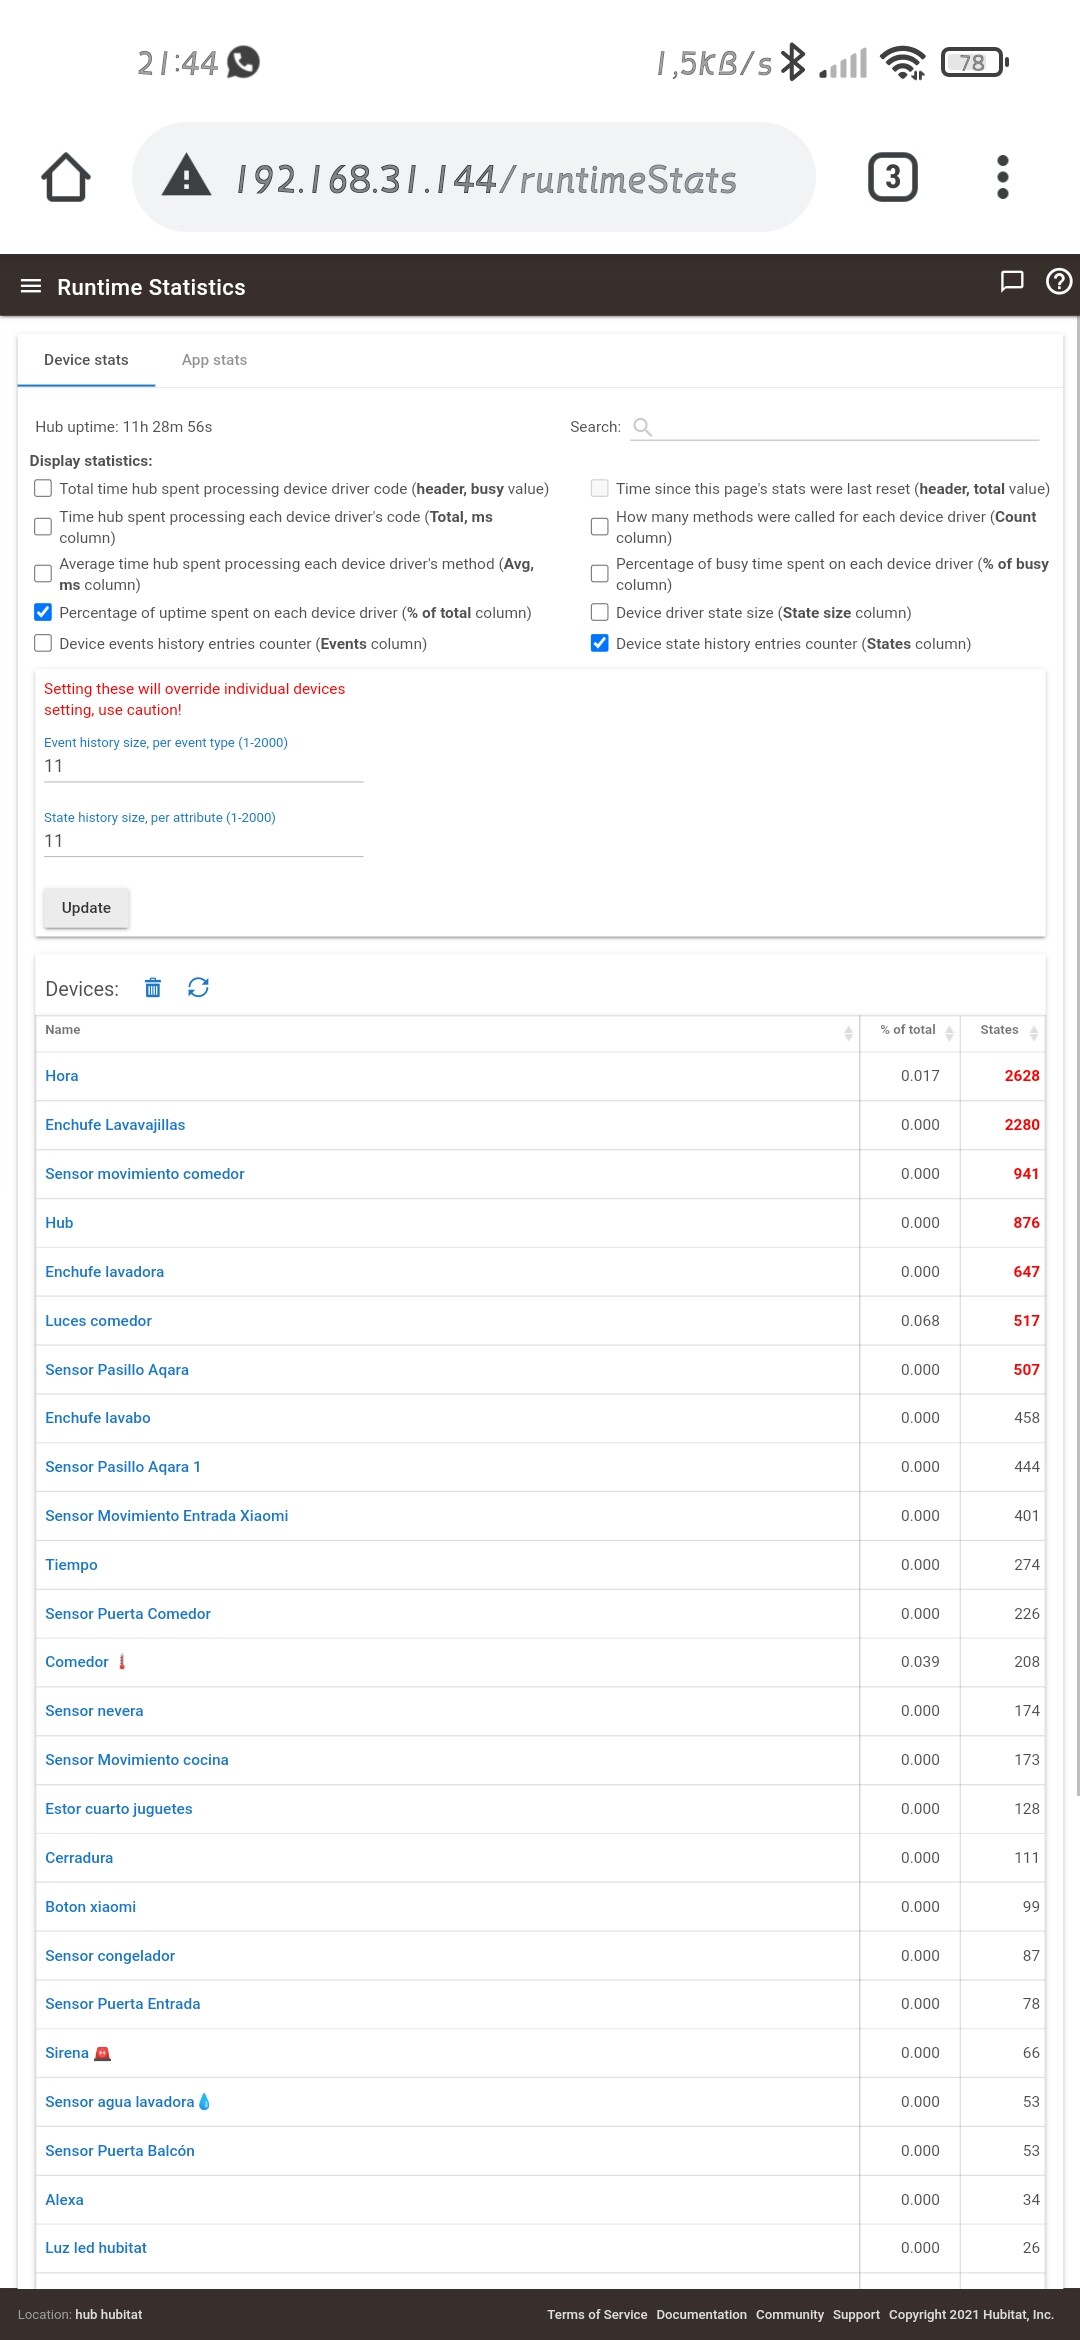
This is what it looks before reboot at 8.28pm (second line device, size 2)
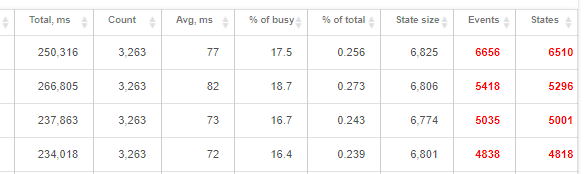
and device event shows that there is 5418 events.
Did a reboot at 8.31pm.. waited couple of minutes..at 8.34pm (still second line)
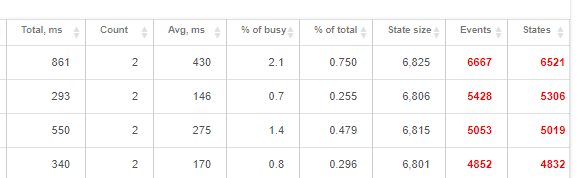
and..
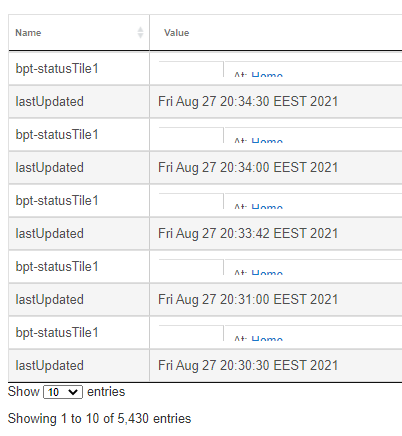
So reboot did not clean state or event history. You are right when you said that it fills log in that 3 minutes but reboot does not clean anything and same thing is happening at daily cleanup what ever the size is. I'm okay by using 11 as a size and it clean it daily and no problem. But if I would like to decrease the amount of state history and event history.. I'm not seeing a way to do that.
It also looks like whatever is updating that status, it seems to be forcing the isState change which is wrong. ie why are those things being updated so much, and why is there not an optimization to realize they are not changing that often?
1 Like
These are life360 presence sensors and I believe everybody who is using @bptworld s app are seeing exact same thing in their event history.
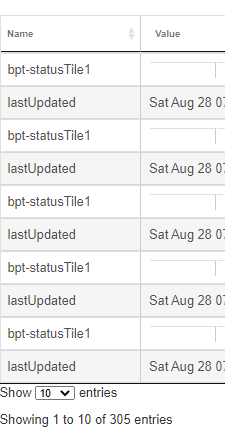
Actually now I noticed that device creates line in every 30sec and that is the reason why it also creates so much events. And..even when nothing really changes in device.
So that is a cause and I'm not sure if there is something that needs to be fixed or optimized on app side but it does not still explain why can't I prevent event and state history size to increase by setting size to smaller.
I just got this alert today:
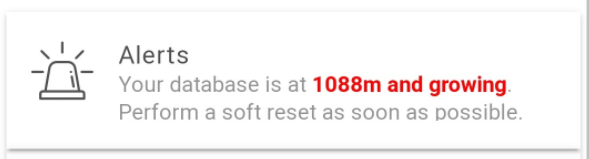
Where do I go in my Hubitat to resolve this?
Currently running version: 2.2.8.156
I would try the soft reset it suggests. Download a local backup (just in case, and so you have something more recent than the last automatic one) from Settings > Backup and Restore. Then:
If you're running 2.2.8, reboot first, it will perform a database compact.
I have figured a root cause, or at least one possible root cause, for this database growth issue.
2.2.9 will have the fix, hopefully do away with this mesage for good.
3 Likes
Could you please run this endpoint: http://your.hubs.ip.here/hub/cleanupDatabase
It will take a while to run. Maybe a long while. Once done, it will show something like "message: DONE" in plain text. Take a look at the number of events/states afterwards, it should come way down.
Also, do these counts come down in the morning and grow in the evening?
Yep every morning counts have come down but usually at the time I wake up they are already marked with red color.
I ran that cleanup manually. It took just couple of minutes.
After that counts were down so it really cleaned them up.
After 5 minutes it looks like this:
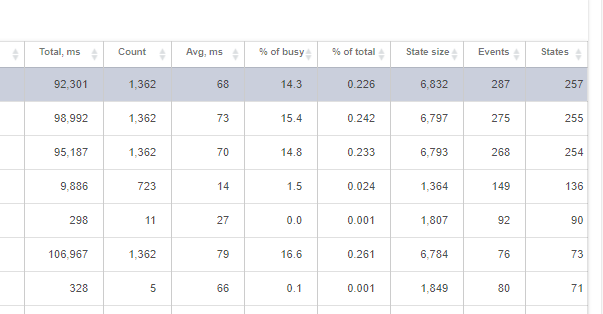
First three devices are presence sensors and line number 6 is the device which size is set to "2". So now it definitely has less event data than those other three devices. They have over 200 entries in event data and as I'm writing this it raised over 300.
So life 360 creates a lot of things to log.
I'm going to look at this at the evening and see how does the runtime stats look.
So the root cause is hourly cleanup isn't running for some reason, but overnight one does. Now I just need to figure out why...
2 Likes
Great!!!!
Hello, this is happening to me, it also asks me for a reset, and looking at these numbers in red, could you tell me what it meant and how could I erase it?
The following helped me trim down my ever growing state values:
- Soft reset
- Restore most recent database
- Reboot
- Ensure all attributes set to 11/11 on event and history
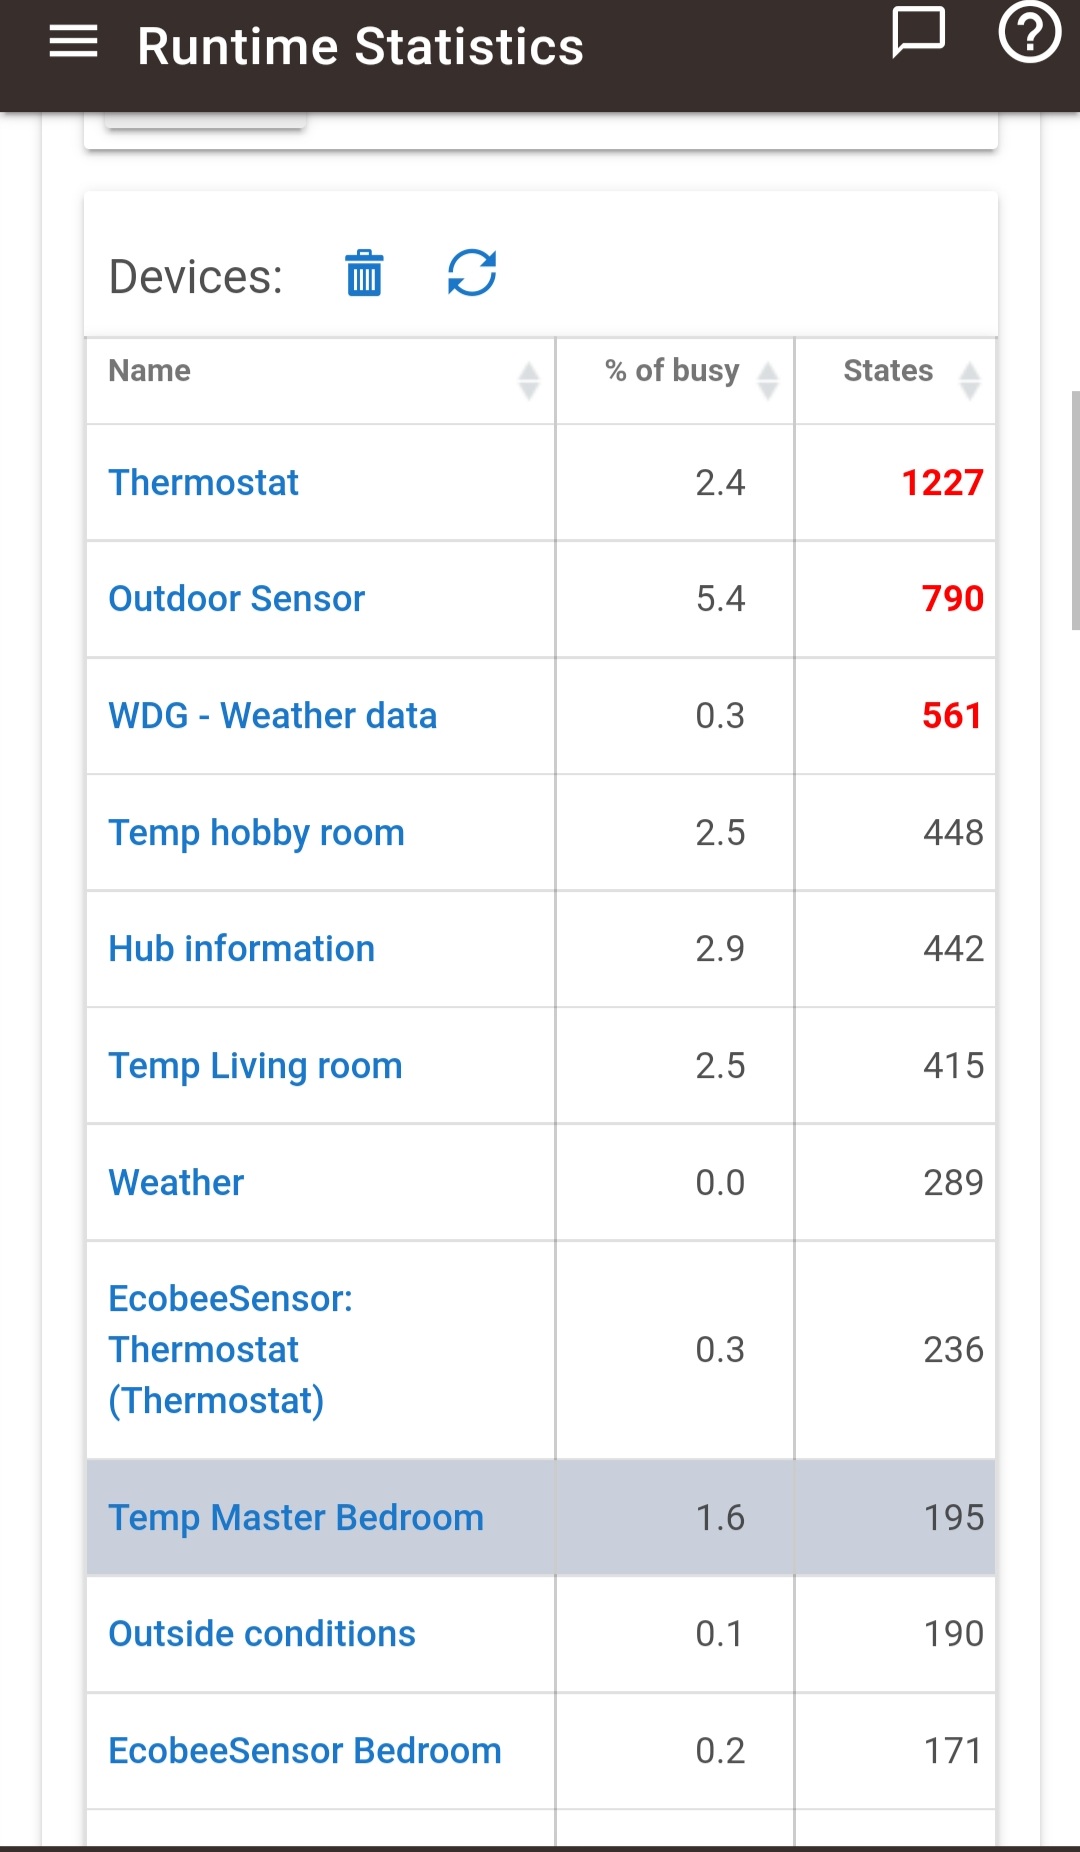
After that completed i now have only 3 devices with states above 500 and those are devices that have a large number of attributes, my ecobee thermostat, and outdoor weather station. So that doesn't have me concerned. And my database is holding steady
Just wanted to mention something I have noticed when db size grows to over 500 MB and you get alerted and need to soft reset and then restore. I have been setting up a C-7 Hub for the last month as I migrate off ST. So, I am new to HE but not home automation. It has happened to me 3 times in the last 2 weeks. I have the event history and state history set to 11 as mentioned here in the forums.
Each time it happens it started right after I had an incomplete z-wave inclusion for a new device. After several failed attempts I have learned to go to z-waze details and find an incomplete/ghost device that I have to remove, shutdown the hub. Every time later that day is when the db starts growing and nothing seems to stop it.
Once I soft reset and restore and have no more z-wave inclusion failures the db size stay low and each morning it shrinks to a smaller size and grows slowly.
I am not sure if this is related to the massive db growth or just a coincidence. I have seen my db grow to over 1300 MB.
1 Like
Please try a reboot before soft reset/restore.
I found a condition that can trigger unchecked database growth. It may not be the cause, but it definitely a cause. The fix is coming in 2.2.9 update.
3 Likes
I did do a reboot before each time and no change in db size.
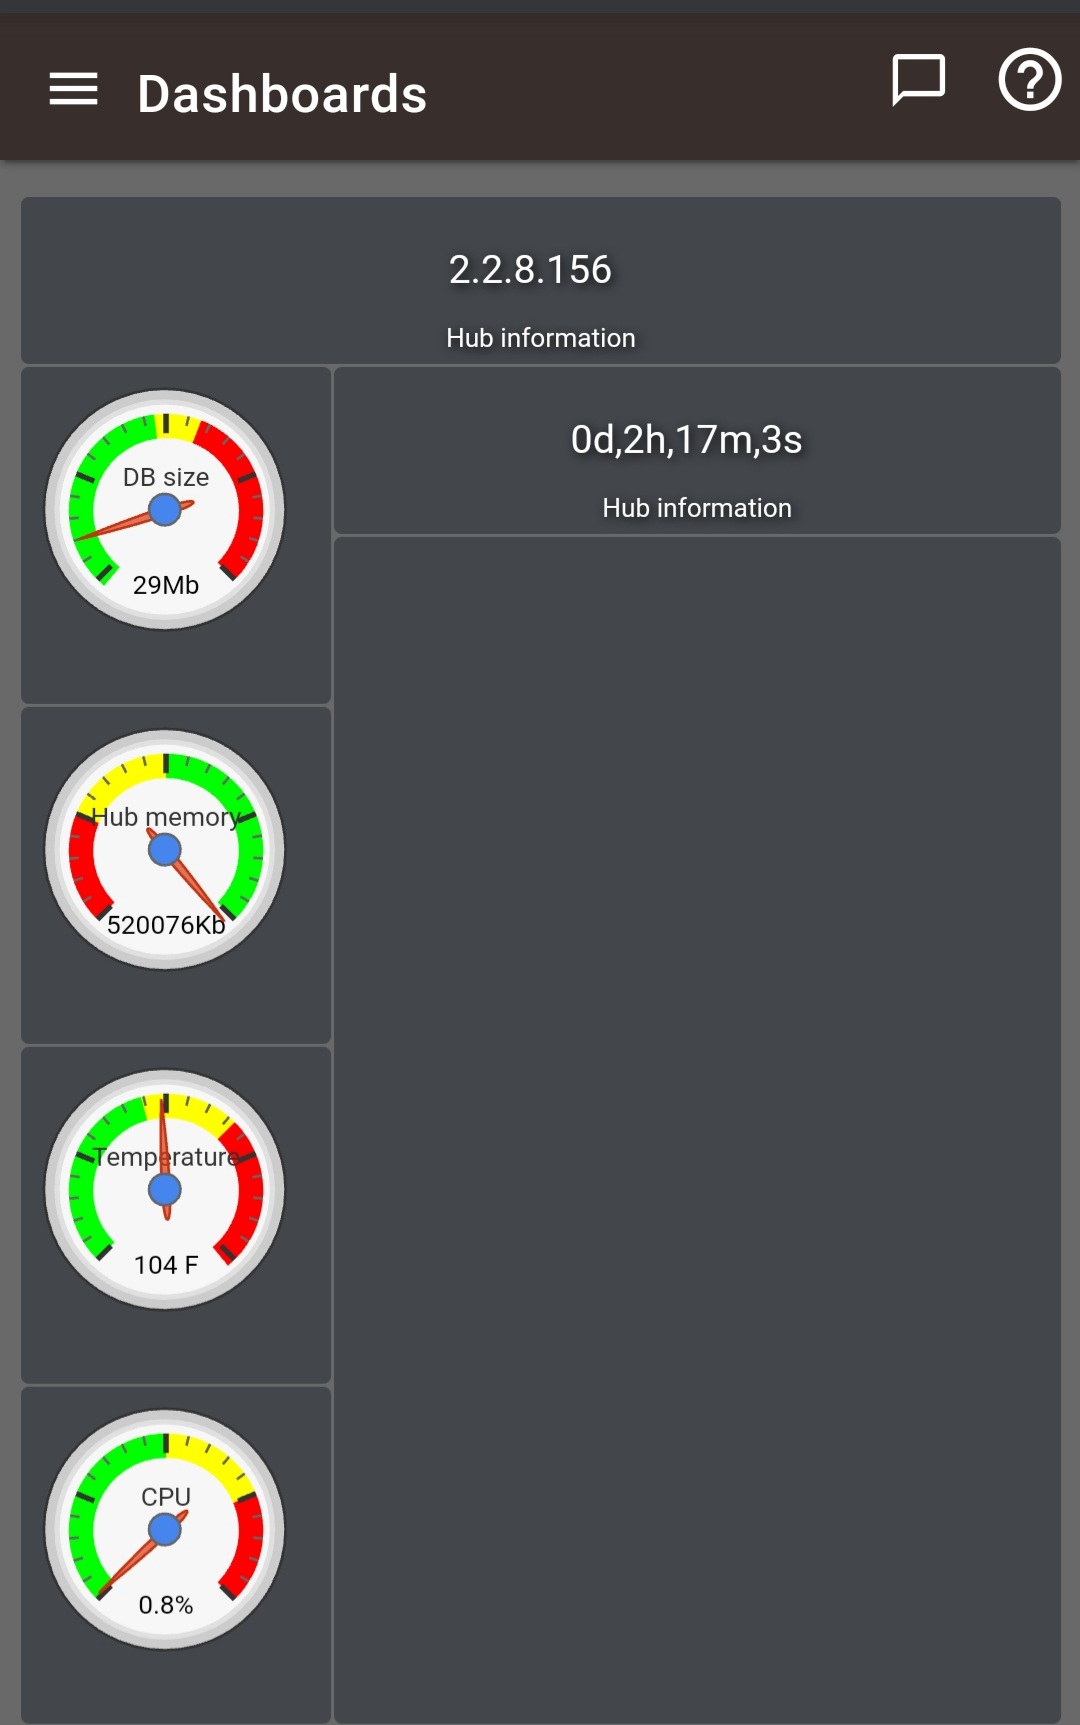
hello, how did you put those temperature gauges on the dashboard?
I used hubigraph. It's on the hubitat package manager

