That's correct.
Noted. I'll poke around, maybe there's a pattern.
That's correct.
Noted. I'll poke around, maybe there's a pattern.
I received an error saying my database was corrupt last night. The app suggested a soft reboot which I did twice and then restored the most recent backup. Today I received an alert that my database is at 214m and growing. I globally lowered event history size and state history size to 20 (down from 50 each, globally) and rebooted my C-7 running 2.2.8.156. I am not seeing the alert yet but the majority of my device stats and app stats are showing event counts well in excess of 50 and very few are less than 20 based on a quick glance.
So I don't know if there is something else I should be doing here or if this is just gonna clear itself out but the corrupt database warning last night was not heart warming. Not sure if this information helps or just clutters the field but I'm happy to help if I can provide some specific data points or whatever might be useful.
The value you set (20) is what the DB will be trimmed down to the next time the cleanup runs... middle of the night. You could get to hundreds or thousands of events in a day, and all but 20 get swept away each cleanup.
Have you done a soft reset yet?
I'd second @thebearmay 's suggestion, I thought I had hit a record with a touch over a 1GB database last night, but seems like I am well short. Even with my 1 GB db file, when I logged into the Admin UI via the mobile app it still suggested a soft reset ASAP. I'm assuming you would be seeing the same thing....?
I also did a db restore as part of that soft reset. Ended up with a ~10Mb file after the restore, currently running at ~55Mb consistently.
I never really found out what caused it, only that the db started growing around midnight (when I went to bed). I had changed some of the actions when transitioning between modes, and saw some errors around this in the logs, so will be interested to see what happens tonight.
I'd suggest installing @thebearmay 's Hub Info drivers to help keep tabs on what is going on (this seems to be a theme on my posts tonight  ). You can use either Hubigraphs or another charting setup, I have InfluxDb and Grafana running on a rpi.
Simon
No, I just panicked after seeing it as it has been growing very quickly.
Been reading about it since, it is late night so will shut it down now and do it after work tomorrow.
So I won't lose any devices or settings of I backup and restore after soft reset?
The soft reset puts you back to a clean hub, it is the restore of a recent backup that gets you back to where you want to be. I've done 2 or 3 lately, including last night, and the hub hasn't skipped a beat.
I literally did it laying in bed a ~4am this morning, it's that easy... Probably not advisable at that time of the morning, but still, very easy...
Just grab the MAC address of the hub before you start...
Thanks for confirming. Will try it tomorrow.
All fixed after soft resetting the hub.
I'm using sizes 11 and 11 ("Setting these will override individual devices setting, use caution!")
I want to decrease the amount of state history and event history in few of my devices. That needs to be done under device settings and that's why I set both to "1" in one particular device...that happened 8 hours ago. When do I notice any difference in runtime statistics on that particular device?
I thought that 1 means 1 per attribute. There is 30 attributes in one device so my logic says it's 30 stored events right?
I changed size 8 hours ago and at the moment runtime statistics says:
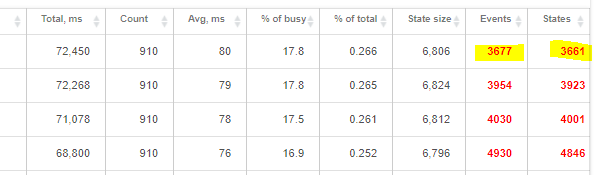
Device with yellow is still creating same level of events and states even when it is set to 1. Those three others are using default 11.
Should I also see a lot less event history pages after changing the size?
Now it lists 371 pages of data.
It could be that I just still do not understand how event and state size should work and how should I see difference when changing sizes.
I wrote this about 10 messages above:
In your case, 11 vs 20 but the question is... did an overnight cleanup have a chance to run? 8 hours might not be enough depending on TZ. You could also reboot, since the cleanup runs during boot, if I remember right.
I now have this alert on my 1st hub as well (where all the apps are installed)
Your database is at 173m and growing.
Try rebooting the hub first. If that makes no difference, review runtime statistics for device drivers when you can.
You can shrink database by reducing event and state history size.
This didn't happen till the latest update. Anyone figure this out?
So if I understand this right keeping it to 11 should already wipe daily everything else but 11x30 events away. If I set it to 2 it will leave 2x30 events after daily clean up (at night).
I rebooted hub couple of times just to make sure that setting size to 2 works, but it did not change anything in that device. There is always same amount of state and event history even when individual settings are applied.
Maybe it cleans up only at night and reboot does not do anything. By the way I also thought that pressing bin at
![]()
would reset state and event history too but that's not the case.
The DB size is one factor among several that contribute to the performance of our hubs. There's two elements of course.. one is having to traverse the whole DB on occasion. Larger equals slower. The other is that it grew somehow, and that's mostly due to events, what might be called 'run away events' - more events occurring than is ideal. So you get hit by having less CPU time available because it's busy writing events and less CPU time by occasionally having to traverse a bigger and bigger DB.
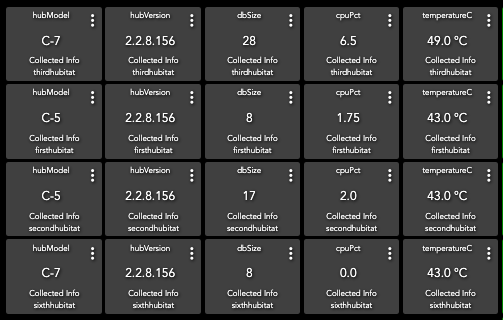
Nothing is "Wrong" it's just not ideal. I have multiple hubs, all set to 11 and these are my DB sizes, today, a minute or two ago:
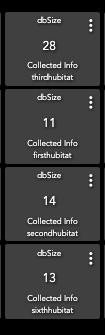
The bottom 3 have Z-Radio devices, the top one has none. However, all the devices from the bottom 3 are mirrored to that top one. Each Z-Radio hub has 40-65 devices that combine onto the top hub totaling 162 devices.
So you have your events set to 11 instead of the standard 100?
yes, I set them to 11 and then if I need to, I can increase one individually for some debug time, then put it back. My Development Hub (5th hub) has a higher self-imposed 'default' but it has almost no devices permanently attached either.
I'm getting alerts about my database size. Never had it before a few weeks ago. I continue to do soft reset. But today the data core was corrupt and the Hub didn't work. I got it fixed but issue is a mess.
I'm still trying to understand this whole thing.
Like I earlier wrote. I have size 11 in all devices except one that I changed yesterday to 2.
Today my runtime stats looks like this. Edited device is the last one.
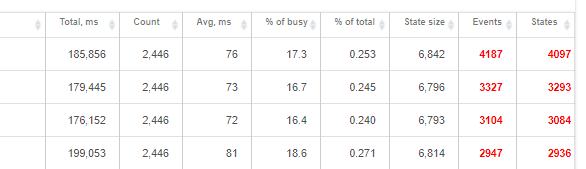
Why do I not see basically any difference when comparing to those other three devices. Those all devices are presence sensors. First three devices have been travelling today so it should be normal that there is more events and states than with last device which has been at home all day. It of course sends updates too even when it's not moving but I thought that event and states level would be significantly smaller.
It really does not cause any problems but I can't live without understanding what is supposed to happen when I change size from 11 to 2.
Download the Hubitat app


