Alert - Your database is growing

Is that after the DB gets so large that it crashes the hub? After you get it restored and working, right away try doing a full power down, unplug for a minute then power up. Once you can get to the UI again, do a reboot. Mine has never gotten to the point where it crashed the hub, I have noticed well before that point.

Unless there is something else going on for other people causing the problem, but for me after a reboot the database is perfectly stable. I have my Max Event and State Days set to 60, and most devices Event / State history set to 100/30.

So my hub has crashed a few times in the last fortnight and I didn't think anything of it and just restarted once and cold rebooted once.

This evening I came home and nothing was working again, only to try and load the web interface and get tons of 404 errors with SQL code displayed. In amongst that I saw an error about database size so found this post.

I managed to get the reboot to work through the diagnostic interface, though now I get a constant error about corrupted database no matter what I do.

Does this now mean Im foobar? How common is this error? I guess there is a bug at the moment...

(I'm running the latest version, though no idea why I installed it a few weeks ago given I haven't changed any settings on my hub in the last few months)

Corrupt databases happen occasionally. You will want to:

  1. Download your latest backup via the diagnostic interface (just in case).
  2. Soft reset your hub
  3. Once on the reset hub, go to the backup/restore screen and download another copy of your latest backup (assuming you can).
  4. Restore the backup of your database via the downloaded file (rather than from the file on the hub - I understand it will help repair the DB that way)
1 Like

Agreed. My issue was after it crashed, pulled power for 1 minute and booted - the UI loaded to the "corrupt database" screen. From there I was able to go to the maintenance page and do a soft reset, reboot, restore database, and reboot again - that got me up and running at least.

Problem was, my database kept growing FAST. In 6 hours I saw it jump to 3513m at one point and then it crashed again. This happened several times over a couple of days. In the last round I tried changing the event/state history to 10 and added database cleanup (which should have already happened after reboot). After that I captured what I think was the smallest and cleanest backup of the database and iirc I ran through the soft reset once more and I have been stable since. DB currently at 47.

I think I just got trapped with the problem in 2.2.8 that causes the db to grow - AND I decided to migrate from C5 to C7 and things really went sideways. Pretty sure I'm good on this front for now. Just have to go back and fix my GDO routines a bit more now.

Add me to this database growing issue. I too am migrating off of Vera and on to HE. I'm only doing 2-3 Z-Wave devices at a time though, every 3-4 days. No rules, on either Vera or HE. I am running MSR for all that. Anyway, I was in the same issue DarellCraighead was. A reboot caused the DB corruption error message. It would not take my restore from the UI. Giving me a 500 error. Luckily I had opened the Backup link in a new tab. Pointed to my local copy and hit restore. This was all Friday afternoon when my DB was 2590. After a 30 minute scare, it came back to life and appeared normal. Today, 2 days later, its now 1025 and growing. When is 2.2.9 planned to be coming out?

EDIT: This round a reboot didn't clear the message. I shutdown the hub, unplugged for 30+ seconds, and plugged it back in. The message is now gone. Is there a way I can watch the DB without having to have extra tools or apps? (New to HE still)

EDIT: 17 hours later, the alert is back and my DB is 603.

Download a fresh backup.
Do a Soft Reset from http://HUBIP:8081.
Restore from backup.
Shut down then remove power > 1 minute.
Power back up.
** Initiate a restart from the UI **. This step seems to be key to the DB not exploding again.

After doing all those steps my hub has stabilized.

You can monitor your DB size using [RELEASE] Hub Information Driver - Developers - Hubitat

It creates a new device you can monitor from. Make sure you enable
Screen Shot 2021-09-27 at 10.26.24 AM

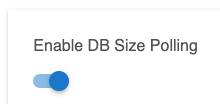
And hit initialize - then give it a minute or two to report.

1 Like

Just to confirm, the restart from the UI, and the restore, is all done from the Diags screen on port 8081?
Or is the restore done from the Diags page and the restart is via the general WebUI with the Reboot Hub link?

I have never had mine get so bad I had to soft reset, but every time I have to power down and boot back up I have been following it up with a reboot using the "Reboot Hub" link from the regular admin UI on the settings page. That's what has been working for me. If I don't do the reboot then the DB grows at a constant rate until I do the reboot, at which time it normalizes and stays stable.

2 Likes

After the Soft Reset I was able to all the remaining steps from the regular UI

I'm really thankful for having found this. I've been fighting this message for a couple of months now and kept doing full shut downs as I figured this was the "better" restart methodology. I even tried a soft reset a few days ago. That was all clearly wrong for me. I did a normal reboot about 5 hours ago and I'm holding steady at 22 (down from ~500s).

1 Like

Thanks all. Installed the Hub Info driver. Shutdown the hub for >2 minutes, Rebooted the hub after it powered back up. The dbSize is holding at 4m. I was at 715m and climbing before the shutdown. It's a waiting game at this point.

1 Like

DB size will probably grow to 30-40m in the next couple of hours but should hold there.

1 Like

Another factor you might want to consider, the devices that are generating events at a high rate, try turning down the sampling rate if possible. While nice to have, I've found some devices like power monitoring devices can be quite spammy. Especially when hooked up to a large tv or something like that. Turning off power reporting helped me out a lot to reduce the load on the mesh.

5 hours in and it went from 4, to 17, 19, 21, 23, 25, 24, 28, 27.
I don't think I did the reboot after the shutdown last time. Let's hope this work around lasts more than a few days. Thanks again to an awesome community.

1 Like

Oh it works. Can you tell what day I forgot to reboot right away? On 9/8 and 9/9 is when I figured out the solution, and 9/16 I forgot to reboot after a shut down and went to bed.

I also just like to show off my charts when possible :wink:

HAHA. Can you share your query for that chart? I've tried a few different settings in my Grafana, but I can't seem to get the data to show. I've changed the Select row a few times. I think I reverted back which is why it's null now.
image

Since I only have one thing with 'dbSize' I did not explicitly pick a device.
You also need to select a measurement for it to work.

image

1 Like

This is concerning...States and events are low. DB is growing crazy. Something that maybe related I have noticed is the DB is steady until I repair a zwave device on the network, then it grows. Maybe just me but it seems that way.

Database

And an hour later....
hour later db

Just do a regular reboot, not shut down. It should bring it back to normal.

1 Like