Has anyone else notice that Topography and Graph labels are backward in Zwave Details
What version of HE are you on?
1 Like
Platform version is: 2.3.7.145 running on a brand new C8
Is correct on my hub. ![]()
I am running a slightly newer software version, but I doubt they have touched those buttons in eons.
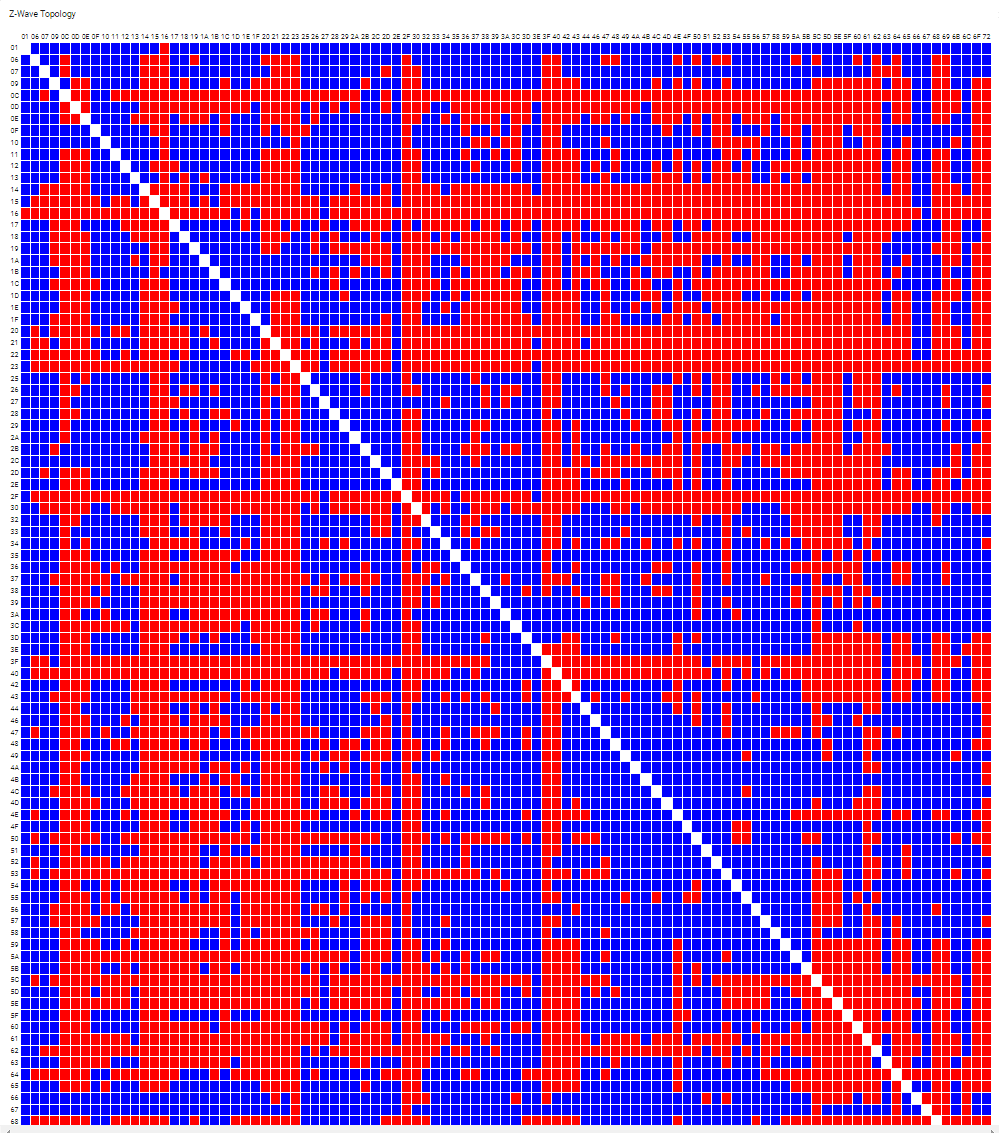
I clicked topology and got:
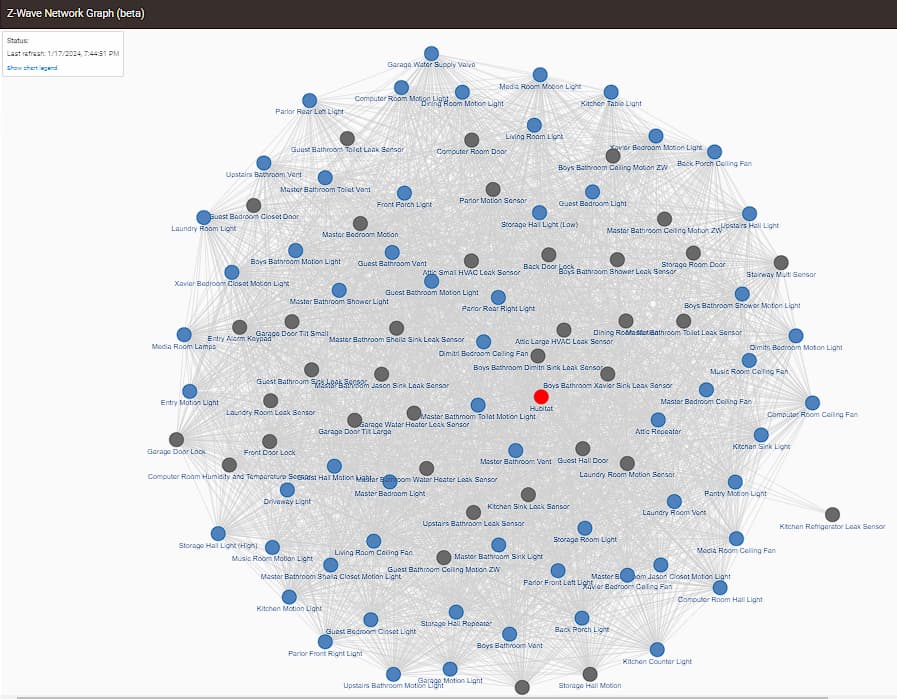
Clicked graph and got the spaghetti:
4 Likes
Isn't that the wrong way round for normal understanding of the word "topology"? I have to say it surprised me as I was expecting the opposite
1 Like
I don't think so. The red blue one has always been called topology drawing, even in the Z-Wave SDK.
The red and blue block chart is the Graph but is under the Topology button
The diagram with the network mesh is the Topology, but is under the Graph button.
I don't think that is how they have been traditionally labeled. And I don't think that's how they're labeled in the official Zwave SDK/tools either.
So I guess this is just a differing of opinions on the definitions. ![]()
1 Like
The chart is a graph
The network mesh is a topology
They may have been wrong forever, but they are wrong
1 Like
Duly noted. They are wrong in your opinion. The one you believe is a graph can just as easily be called a topology, based on the definition of topology...
Anyway, I didn't go pull out the Z-Wave SDK or tool set so maybe I'm remembering wrong. If I am someone else will correct me.
But if I'm not, it should stay the way it is to be consistent with the nomenclature that has been in use for years.
The graph is a node graph. Exactly as defined here: Node graph architecture - Wikipedia
It has a node graph icon on the button:
![]()
Not sure why you think a node graph isn't a node graph, but it is.
2 Likes
Its not opinion, its industry standard terms
There's literally an industry that INVENTED Z-wave that disagrees with you.
3 Likes
Good point.
All that said I really don't have enough passion around this topic to argue about it or get more pedantic than I already have. Lol.
I think it's fine the way it is per various definitions. The OP is allowed to think differently. It isn't a big deal to me.
No, it is 100% not. And you've been provided examples.
I'm putting this on mute because it's getting stupid now.
4 Likes
Closed because this semantic discussion is pointless. In the end, individual opinions and disagreements apart, the definitions used in the Zwave SDK will prevail.
FWIW, in my personal opinion the blue and red representation is a topological representation of the communication between each node and its neighbors. The spaghetti diagram is a less-informative graphical representation of the same.

