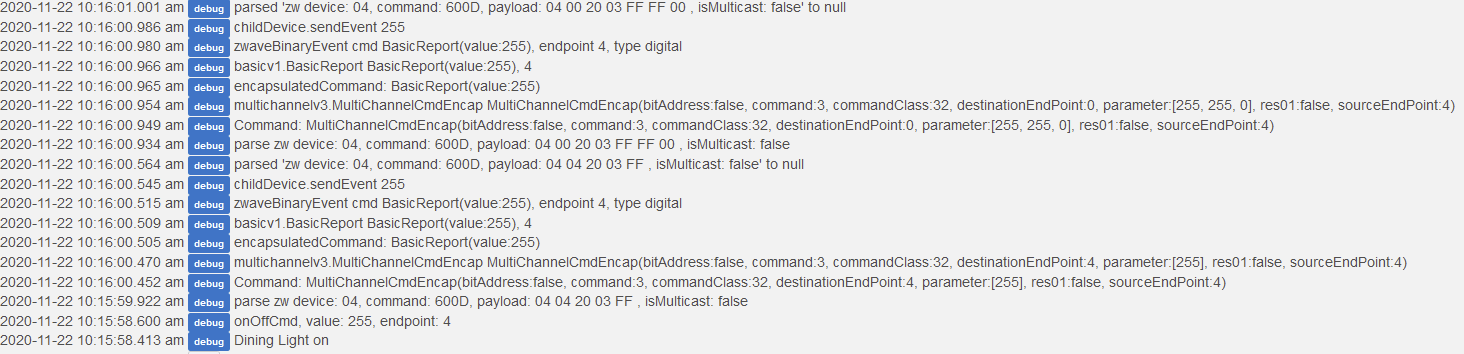
I have no idea what all these mean. I'm currently using the drivers from the https://community.hubitat.com/t/community-device-drivers-aka-compatible-devices-wiki/ and the MCO Touch Panel Power Single/Double/Triple Switch with the child relay driver. It's been working fine for months but it's my first time seeing these debug messages. I am not the one who made these so I have no idea what the heck is going on nor understand these debug messages. How do I get rid of this problem? Switches still work fine, just that these debug messages keep showing up.
I'm not familiar with the drivers or the device, but can at least provide some basic help...
Are you seeing any strange behaviour in the functioning of the switches? EDIT - Sorry, just re-read your post, I see the answer is no.
Is it a case of you are just unsure of whether there is something wrong you are not aware of?
Could it be the drivers have been updated on your HE hub, either by you manually updating to a recent version of automatically in some way? Could some additional logging have been introduced in an update?
Just to the left of your screenshot is where the app or device producing the logs is indicated. Do those devices or apps have a setting where you can turn debug logging on or off?
I've written some drivers myself, typically debug logs are there to help in testing and/or to try and understand what may be happening when something is wrong, but seeing them in the logs isn't necessarily a cause for concern, as long as there are no errors around them or strange behaviour in the operation of the switches. But I do also think it is strange if they suddenly started appearing.
Simon
Hi yeah, these only started appearing recently. Everything seems to work fine. There's no update since 2018 for these drivers made by the community, there's also no way to turn off debug. There's no built in generic z-wave 4 gang drivers so I don't really have much of a choice but to use this... Guess I'll just ignore the logs for now, I can't really tell if the log is showing any issue or not.
Having a quick scan through the code, most of the debug messages look pretty benign, they are just outputting that something has been called and some additional info if applicable. Strange if you haven't seen these before...
It shouldn't be too hard to tweak the code to either introduce a setting to turn it on or off, or simply comment out the logging in the code so it doesn't occur. There's probably be some of the infrequent stuff you might leave in like device creation or updates being called, but the day to day stuff could be turned off most of the time.
I'm not sure who would maintain these, you could ask around to see if anyone does, otherwise could look at doing it yourself or I could probably guide you through it if you are interested.
Simon
If you're willing to guide me, I would love to try it out myself and see if I can get rid of all these debug messages. How should I start?
I'm assuming you loaded these drivers the manual way, i.e. copying and pasting the code as a new driver. You're essentially going to open that code a modify it there. I'll do this in a couple of posts, but feel free to jump ahead if you are feeling keen....
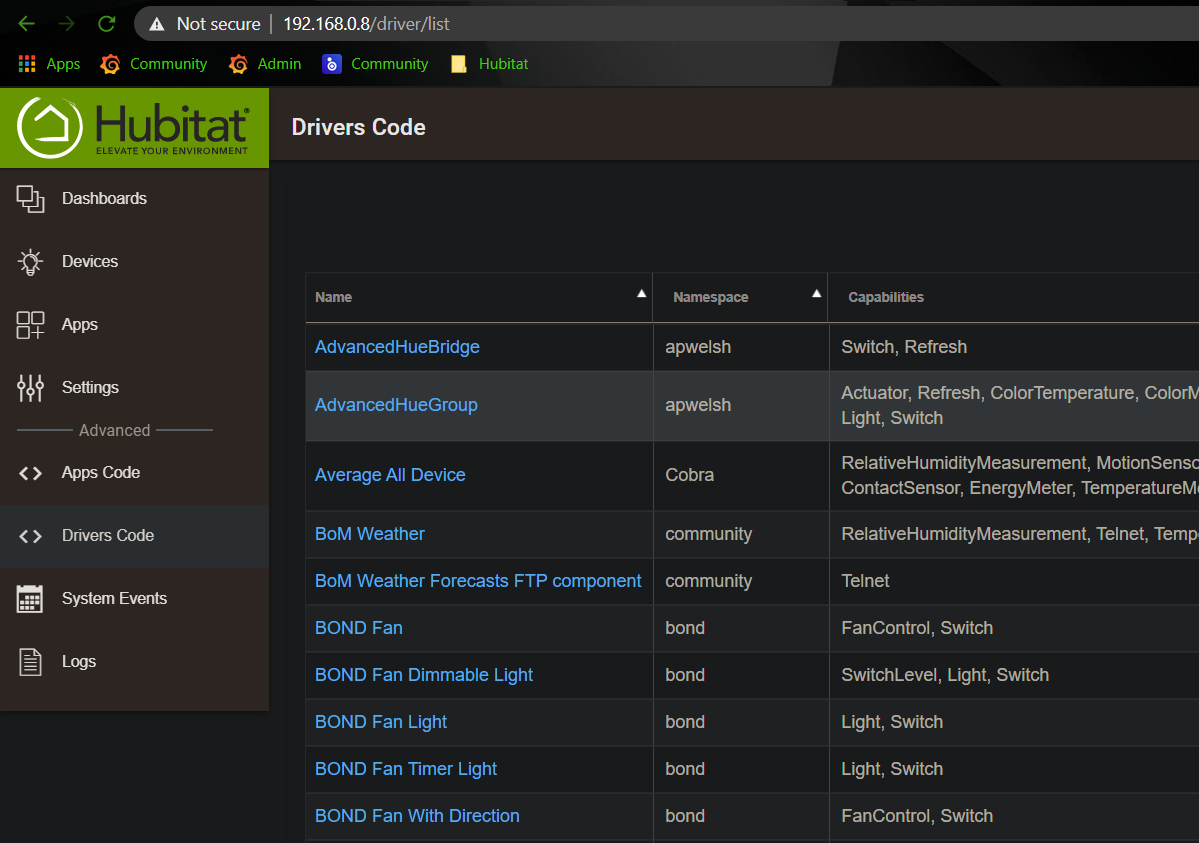
Open up the Admin Web UI, clicking on the Drivers Code option in the menu on the left hand side. You'll see a list of the driver's you have installed, left-click the title of one you are interested in from the table in the centre of the page.
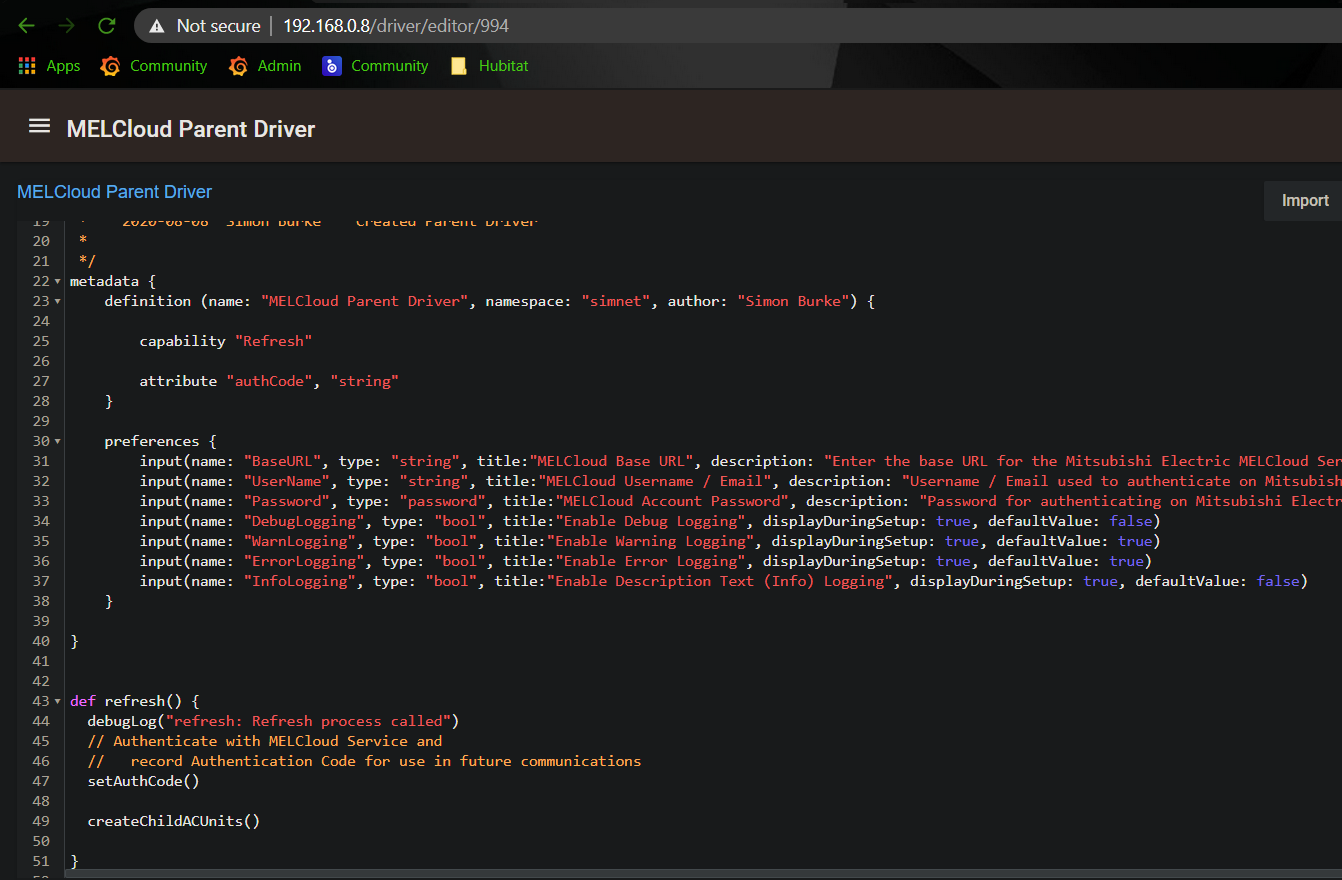
This screenshot probably covers the rest... It's an example from one I have been working on.
The orange colour text in my display are the lines that are commented out. These are often used to include comments about what is happening in the code, such as the two-line comment in the refresh method in my screenshot talking about authentication. Comments can also be used to essentially disable a line of code that is not used anymore. So in your case you could put two forward slashes in front of any of the debug log lines in your driver to stop them from occurring. Larger blocks of text can be commented out using forward slash followed by a star to signify the beginning of a block of comments, then finished off by a star followed by a forward slash. You can see the tail end of that at the top of my screenshot (the stars on each line are not necessary). Alternatively, simply delete the debug logging text entirely. Commenting them out may be preferable if you wanted to re-introduce it later, rather than remembering where they were placed in the code.
You may notice in the refresh method of my code the debug log output is slightly different to the driver you are looking at. That is because I did what I mentioned earlier, setup some settings in the preferences section of the code, then referred to these in three separate methods, debugLog, errorLog and warnLog. I then call these methods, like I do in the refresh method, whenever I want to log something. I'll include the text from these methods my next post.
To setup the logging settings, I include in my code three items in the preferences section:
preferences {
        input(name: "DebugLogging", type: "bool", title:"Enable Debug Logging", displayDuringSetup: true, defaultValue: false)
        input(name: "WarnLogging", type: "bool", title:"Enable Warning Logging", displayDuringSetup: true, defaultValue: true)
        input(name: "ErrorLogging", type: "bool", title:"Enable Error Logging", displayDuringSetup: true, defaultValue: true)
        input(name: "InfoLogging", type: "bool", title:"Enable Description Text (Info) Logging", displayDuringSetup: true, defaultValue: false)
    }
I then setup three methods that check the appropriate setting and produce a log if the setting is turned on:
//Utility methods
def debugLog(debugMessage) {
	if (DebugLogging == true) {log.debug(debugMessage)}
}

def errorLog(errorMessage) {
    if (ErrorLogging == true) { log.error(errorMessage)}
}

def infoLog(infoMessage) {
    if(InfoLogging == true) {log.info(infoMessage)}
}

def warnLog(warnMessage) {
    if(WarnLogging == true) {log.warn(warnMessage)}
}
Then throughout my code I call these methods, note the first line calling debugLog():
def refresh() {
  debugLog("refresh: Refresh process called")
  // Authenticate with MELCloud Service and
  //   record Authentication Code for use in future communications
  setAuthCode()

  createChildACUnits()

}So I think the best starting point would be for you to simply comment out the debug message lines and see how that goes. Start slowly by commenting out a couple and see it take effect.
There may be one or two debug messages that would be good to leave it because they may be more to do with errors occurring and not so much debugging like I described earlier. As well as leave those type of messages in the code, you may also want to change the type of log entry produced, i.e. changing it from debug to either an error or a warning.
I should probably stop and let you digest what I have written and play around with the code. Let me know if you need anything.
Simon
Sorry, almost forgot, there is a save button across the top of the screen, when you are finished making changes click that save button for the changes to take effect. If there are an compilation errors from what you have changed there will be a small description of that at the top left of the screen.
Yeah thanks! I'll try it out and see if it works.
1 Like
This topic was automatically closed 365 days after the last reply. New replies are no longer allowed.

