Something to remember as well is using memory isn't in and of itself a bad thing. If your hub is fairly idle which your cpu avg numbers do indicate it is likely the hub just doesn't see a need to remove things from memory.
The linux OS and JVM combo that the hub uses are not as quick to free up memory as something like windows. Generally speaking in any computing environment you want to keep things in memory if possible as it is faster to access then pretty much any storage tech.
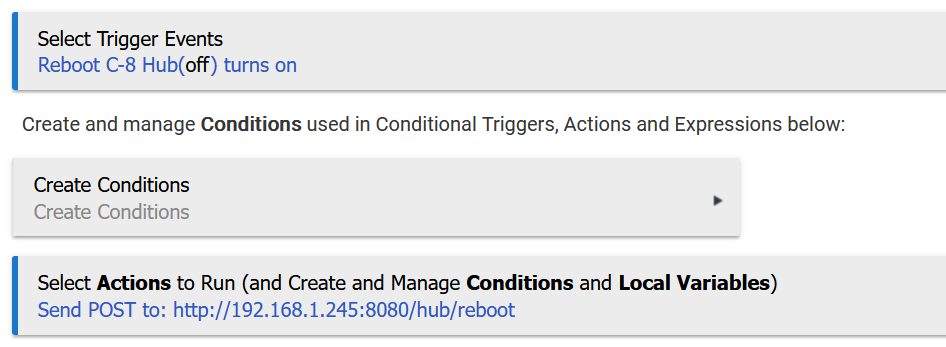
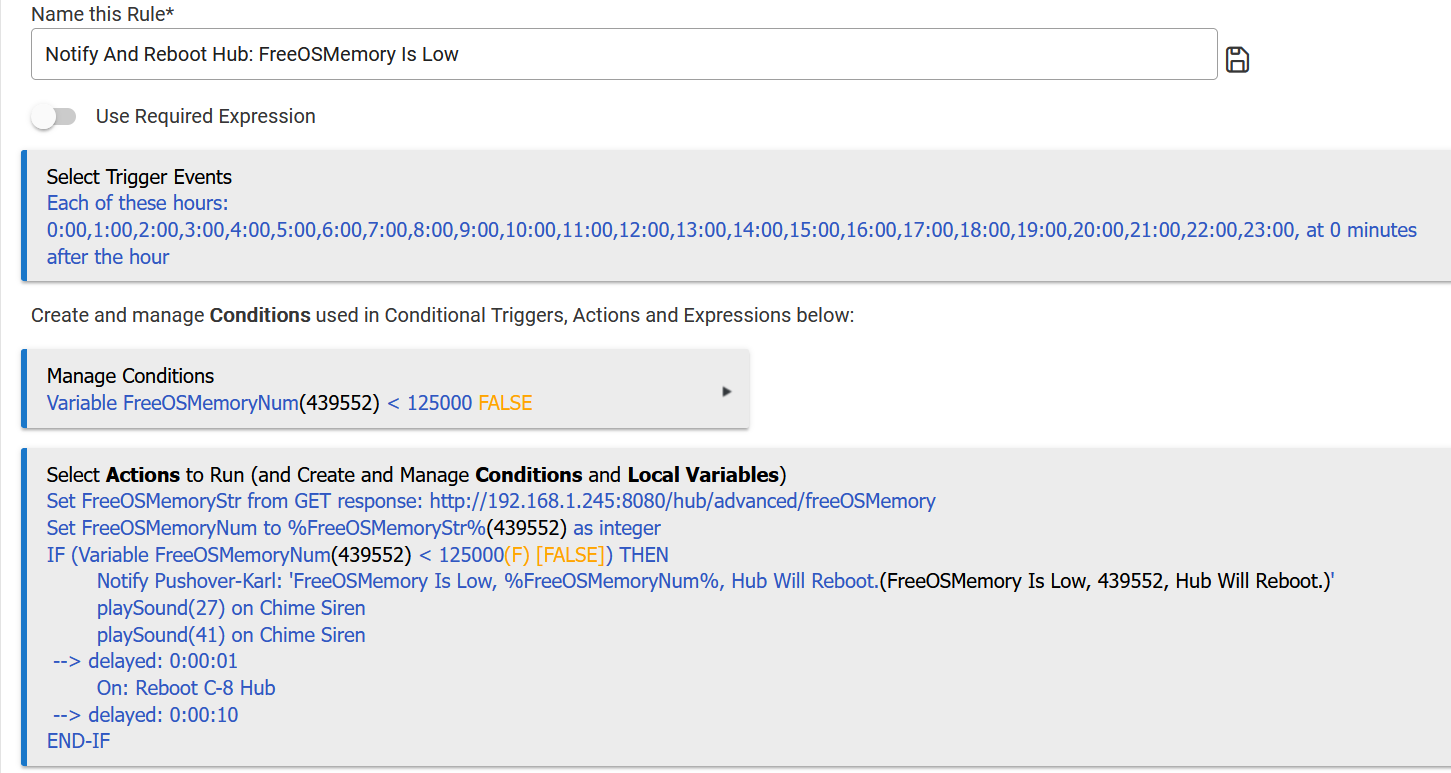
The problem occurs when you have a usage spike that needs to access more memory then what is free. If the usage stays flat then it isn't likely to cause an issue. My hub hardly drops once it gets down to around 180MB. Because our HE environments are all different though there is no one magic value for free mem that represents a problem. That said, a rule that will reboot the hub when it drops to a point is not a bad thing. I have a Rule in RM that looks at the memory at 3am (before DB Backup) and then if it is below 120MB will initiate a reboot. I only check at 3am since generally speaking there are not huge drops for me and i only want it to reboot over night for this to prevent unexpected HA issues during the day.
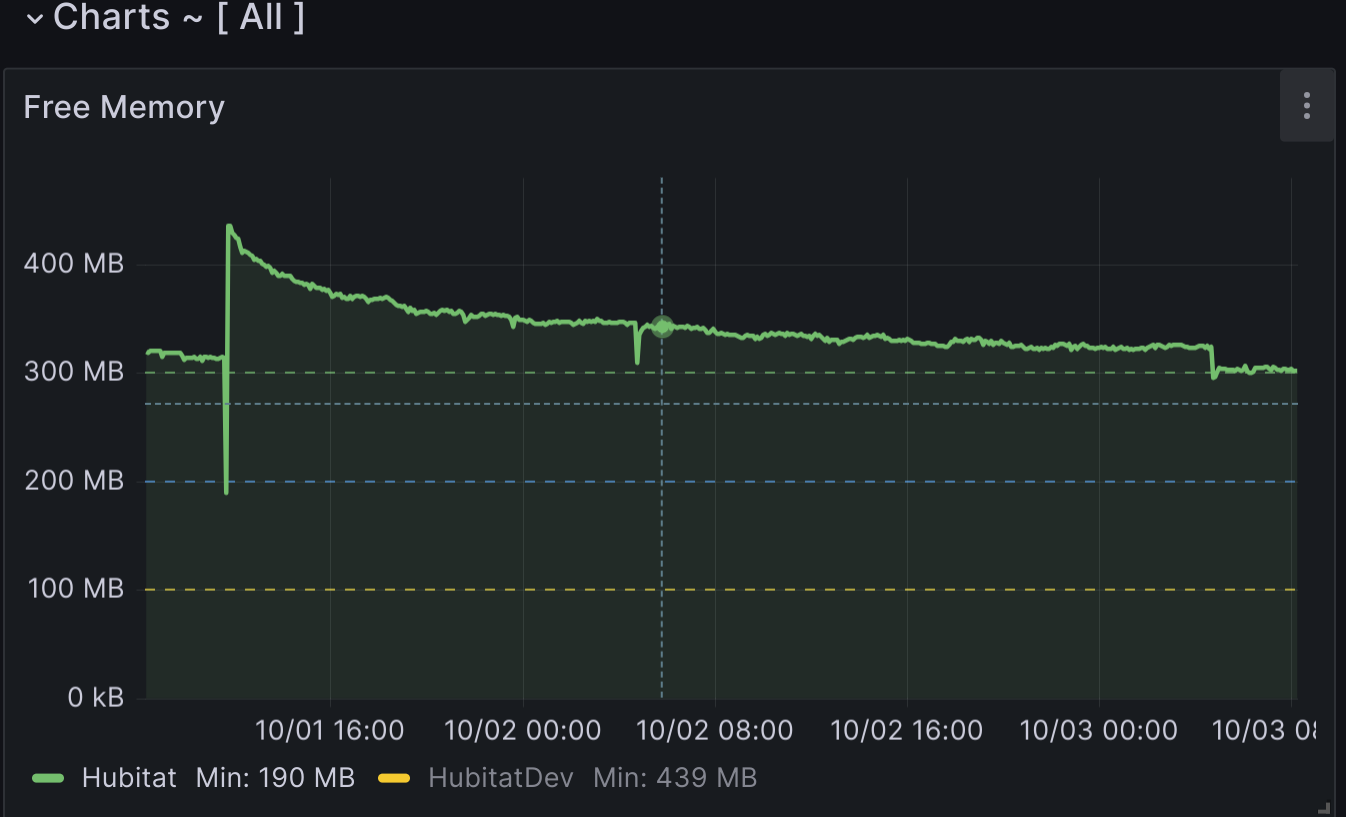
It is also nice to graph with Webcore, or the combination of Influxdb Logger, INfluxdb, and Grafana as shown below. I like the later because it gets all of the processing off the hub.
Here you can see my last reboot and where it is now. That graph though does a great job of showing how the lights flattens out. So overtime it shouldn't be a issue.
That said it is more important to do a graceful restart then allow it to lock and have to pull power. That can corrupt the database and sometimes in ways that are not obvious.
thanks, and i apoligise for any repeats as i'm aware i discussed this issue a few months ago)
I'm still on FW 2.3.4.153 (reliable- if it aint broke dont fix it) and i dont see the Hub information driver app so guess i will have to install as a custom app?
Any tips on this or should i hang on a bit longer and see if HE looks after its own available memory?
thanks all
If i remember right that is the firmware right before the C-8 was released. There were many improvements that have gone in since then, so you may see benifit.
Do you use HPM(Hubitat Package Manager) that is a community app that makes finding apps easy. If you do not i would suggest get it to make finding things allot easier.
In many ways it does. They JVM that it is running on has a process called garbage collection that will free up memory as it sees it is needed. They key with that statement is as it is as needed. If there is allot of free ram it may leave things in memory to improve performance.
Given that this is such a talked about thing not sure why freeMemory isn't exposed on one of the hub pages; setting/details, settings diagnostics or what ever. Or all of it; CPU%, memory, temperature, etc.. on a new settings tab "Hub Operating Stats" or something.