Looking for ideas on how to visualise sensor data such as temperatures, humidity etc. I’ve been playing around with hubigraphs but any examples of what people have done and screenshots of the actual config would be awesome!
Thanks in advance!
Looking for ideas on how to visualise sensor data such as temperatures, humidity etc. I’ve been playing around with hubigraphs but any examples of what people have done and screenshots of the actual config would be awesome!
Thanks in advance!
I went with InfluxDB and Grafana, as many have and not just in the HE world. It was a lot easier to set up than I anticipated.
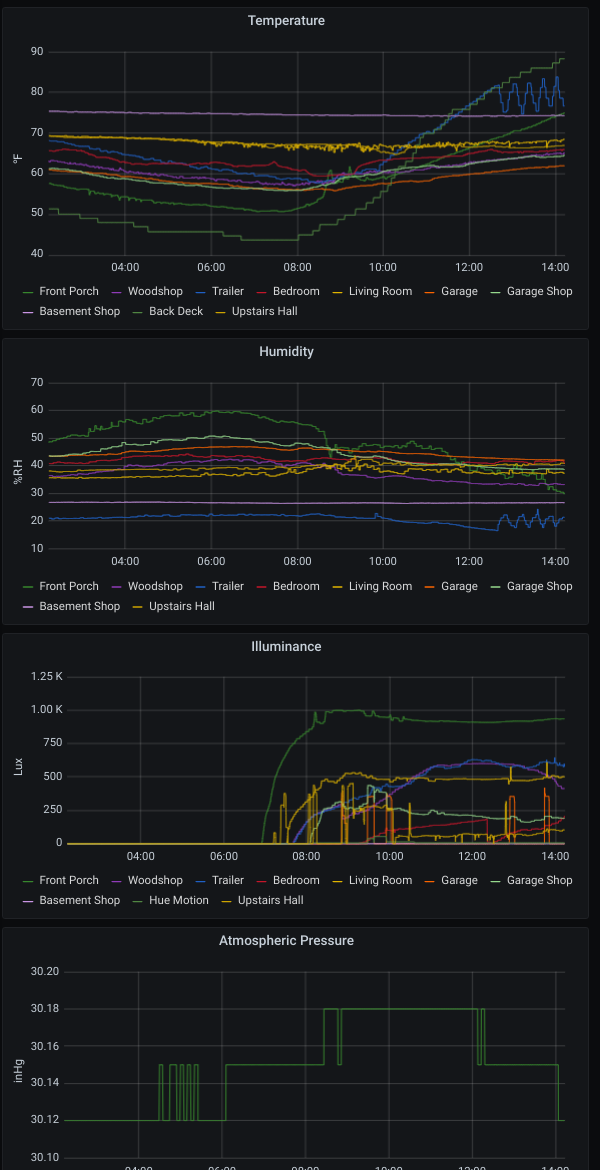
Here is what I think you're looking for
Above is showing all sensors but if you click on one of the sensor names at the bottom of each graph you get this
There is a community app, InfluxDB Logger, that allows you to select which measurements get written to the database.
I don't wish to disparage Hubigraphs but I won't use it because it's not a local-only solution. The above is.
I did the same as @LosinIt, chose the Raspberry Pi, InfluxDB and Grafana route. Though I haven't used the charting options on Hubigraph, I would still recommend at least taking a look (like you have done) before investing in a rpi, if you would have to buy one like I did.
I posted a similar question before I started. The thread includes some of mine and others experiences, as well as links to the InfluxDB logger and grafana setup I used.
Feel free to take a look and ask any questions, always happy to help.
Simon
Ah, yes, you remind me of a couple other things.
If you have a server with plenty of idle CPU (not that it takes much) you can install there like I did.
For reasons I don't understand many folks like to use Docker. I had to do it for a while but was tickled when my app and OS (Node-red on Arch Linux) got to the point where I didn't need Docker anymore. IMO Docker was a PITA, not because it didn't work (it did) but because it was one more layer that had to be managed.
That is true re the RPI / Windows comment. I did forget I chose RPI for two reasons relevant to me, I didn't have a Windows machine that was always on and there are other uses for RPI where many of the instructions are focused on RPI. All that said, I would certainly feel more at home in Windows....
This looks awesome  I’ll definitely check out grafana
Thanks Simon I’ll check out this thread !
That an HPE rack?
cheap rack from Amazon.co.uk
Not the best photo - its normally tidier than this! the trailing wires are from various bits and bobs I've been testing
The blue LED display and fan control is actually a laptop cooling tray, it sits on top of a rack tray and provides conveniently controllable fans - much cheaper than proper rack fan solutions ..
The Pis are in rack cases I printed along with the Unifi USG
Download the Hubitat app