When trying to sign on to Hubitat main menu I get message that cannot contact server. I was having trouble with system in that the correct time was not being displayed. Backed up from previous version. Rebooted hub. Now i cannot get to apps, dashboard, any commands??
You can use the diagnostic tool to set the correct date and time: Hubitat Diagnostic Tool | Hubitat Documentation
Not sure what main menu you were trying to sign into? The web portal? Something on the hub?
What hub Model?
What platform version is hub running?
What color is the LED on the hub?
Please include screenshots of the issue if possible.
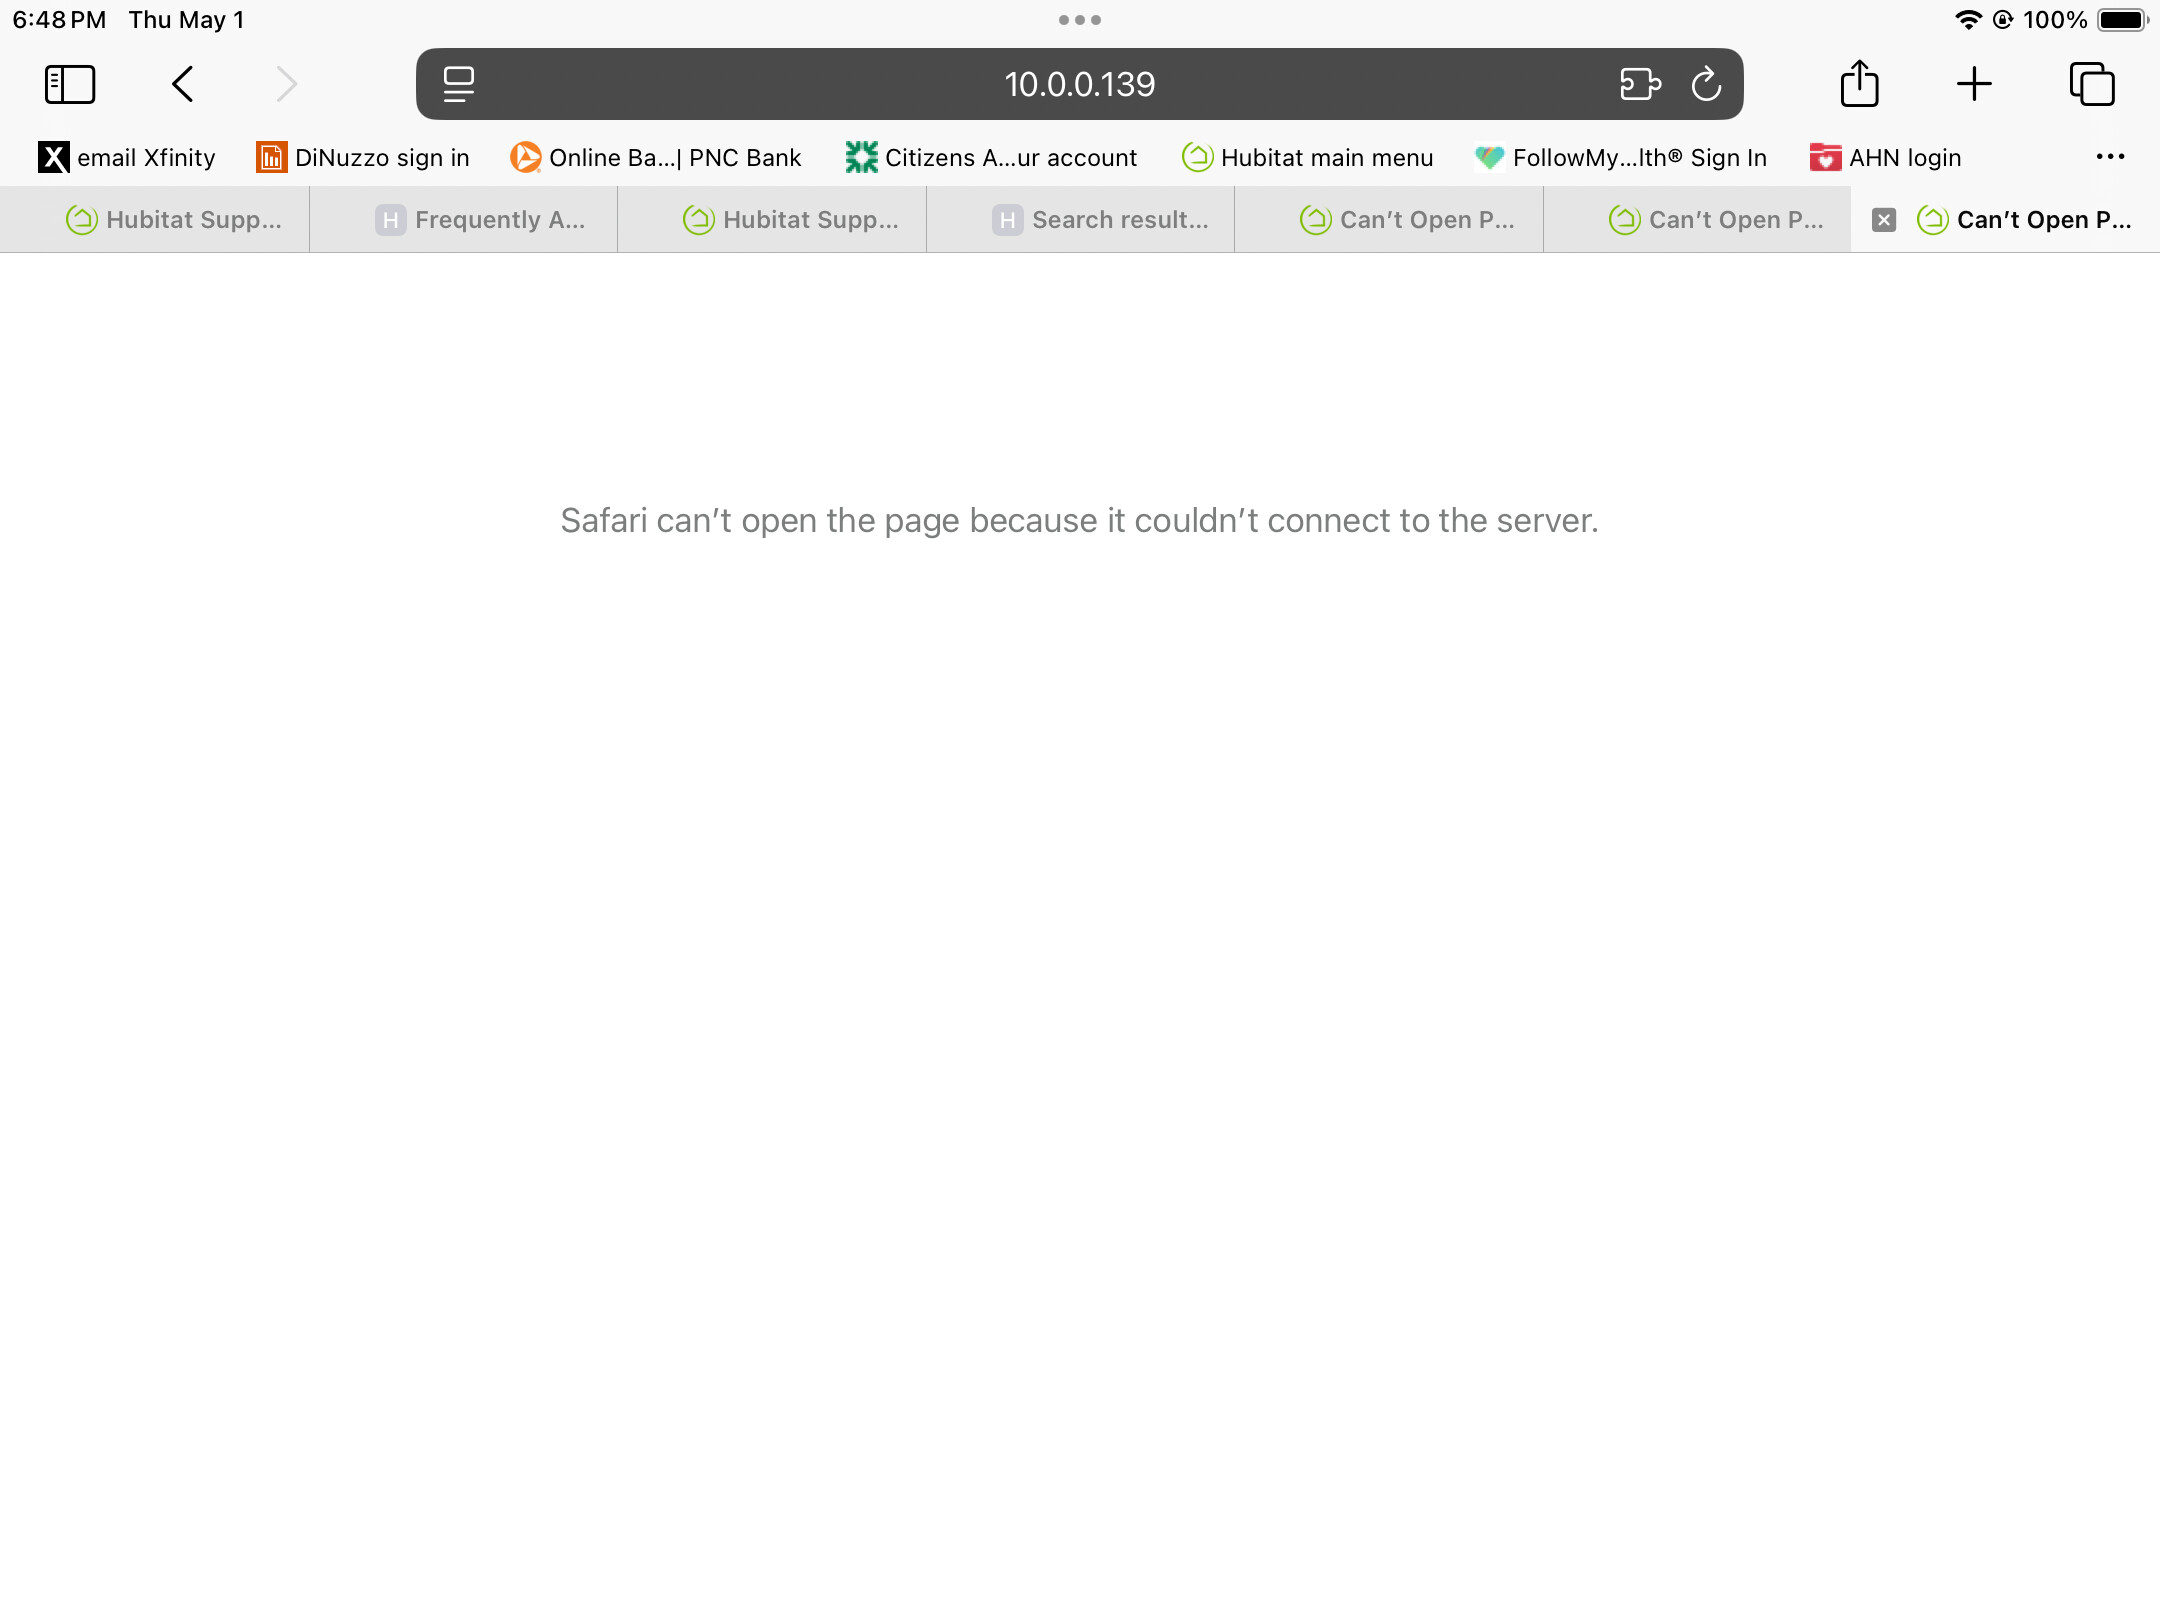
Trying to sign on to 10.0.0.139. From there I could get to all the apps, devices+,+. I now get the first photo.
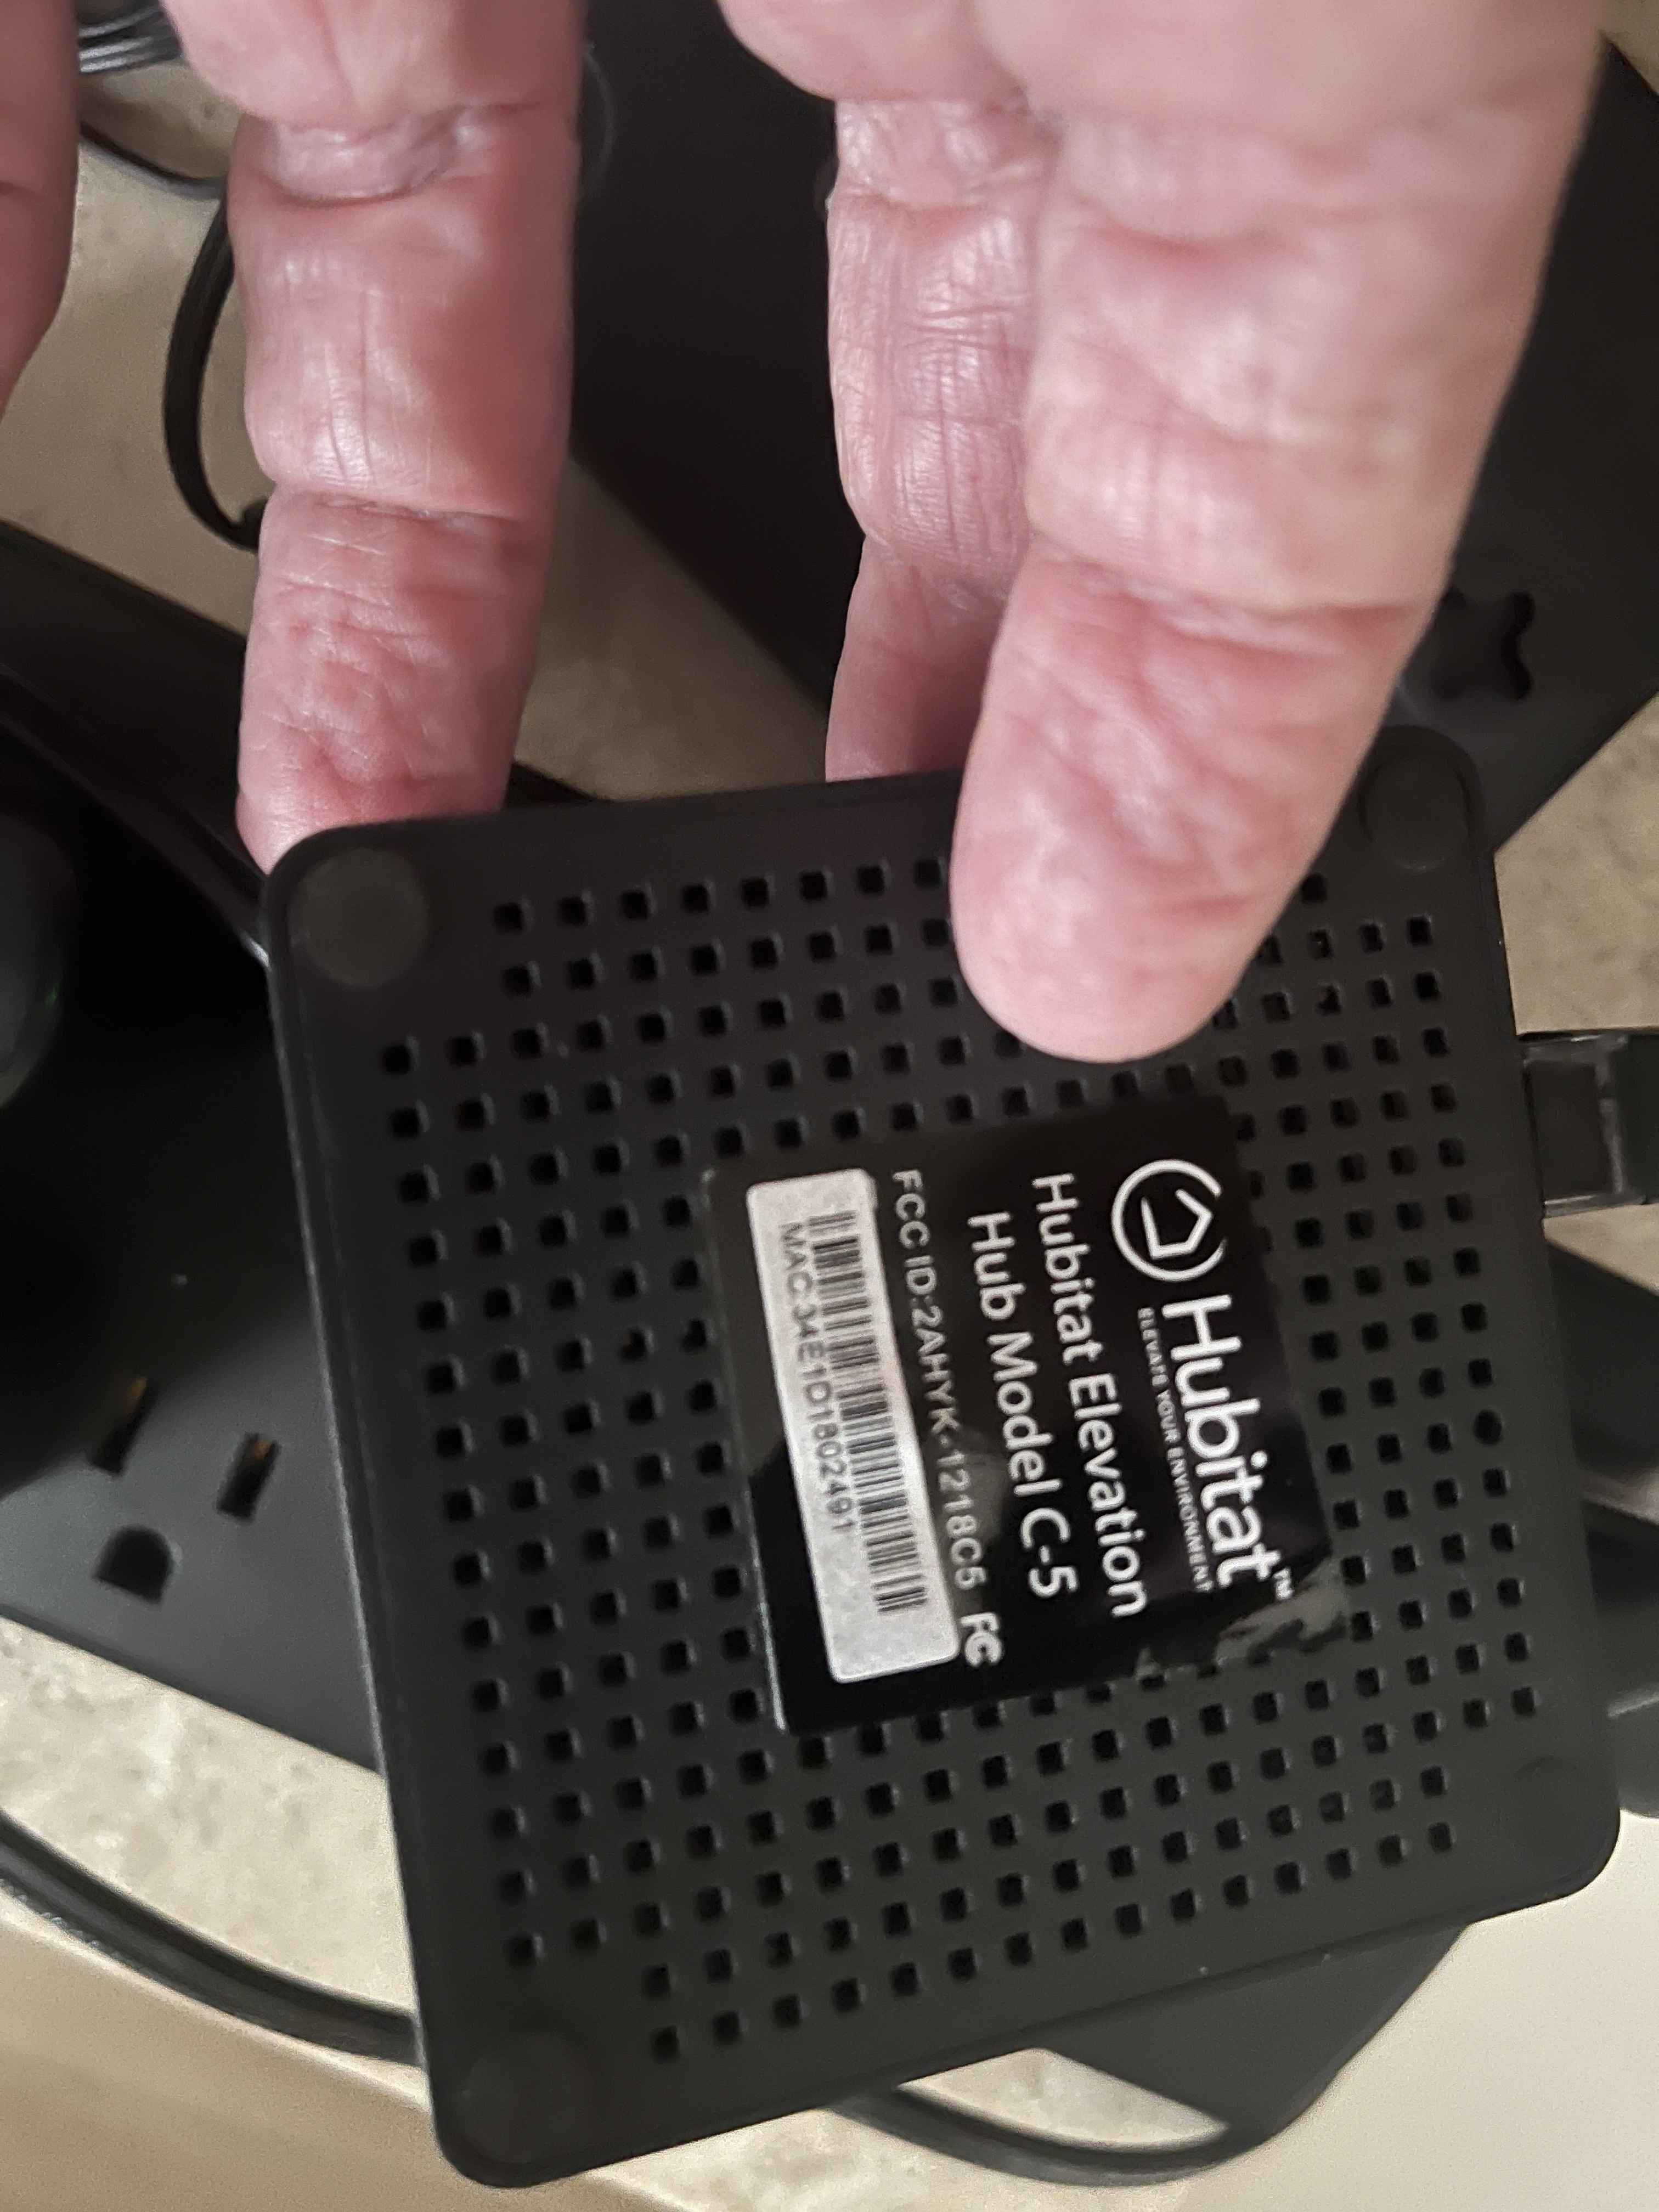
The model is hub model C-5. Second photo)
The led is green.
What's the IP address of your Mac?
Did the hub get a different IP?
Thanks guys. Not sure how that happened, but with the new ip address all is back.
Unfortunately, I had tied all the Hubitat switches and lights to voice control with Alexa. Those are now all inoperative. Any suggestions on how to get those back?
To prevent the Hub from getting a new IP again, you can go in your router and set a fixed IP in the DHCP settings for it.
The hub getting a new IP should not impact Alexa at all. Since it is cloud based, it does not use your internal LAN IP at all. Check the logs for errors.
DO NOT delete or otherwise change anything in the Alexa app on the hub. You can however open that app up and click Done. Then check logs again for any errors.
Check if hub is connected to Hubitat cloud system
- Go to: My Hubitat > Registered Hub
- Click the details button for your hub.
- Is the Last Checkin recent?
Another way to verify if hub is able to connect to internet
- On the hub UI, go to settings > Network Setup > Network Test
- In the ping test, type in cloud.hubitat.com
- Post screenshot of results.
You can also go to the Alexa skill (from the Alexa mobile app), disable it, then enable it again. It will have you log into your account again and select a hub. This should retain all your devices you already have shared and just reconnect the two system together again.
1 Like
I’m loosing ground. Set fixed IP. However my hub is no longer registered. The button for connect to hub is grayed out (not functional) . Also have a note in red “incompatible firmware”. Connect hub and update to latest firmware. Same issue, can’t connect to hub.
Just type the IP into a web browser, you dont have to go through the portal page.
The firmware message might mean you need to update the hub platform for remote admin to work. You dont need remote admin if you are on the same LAN.
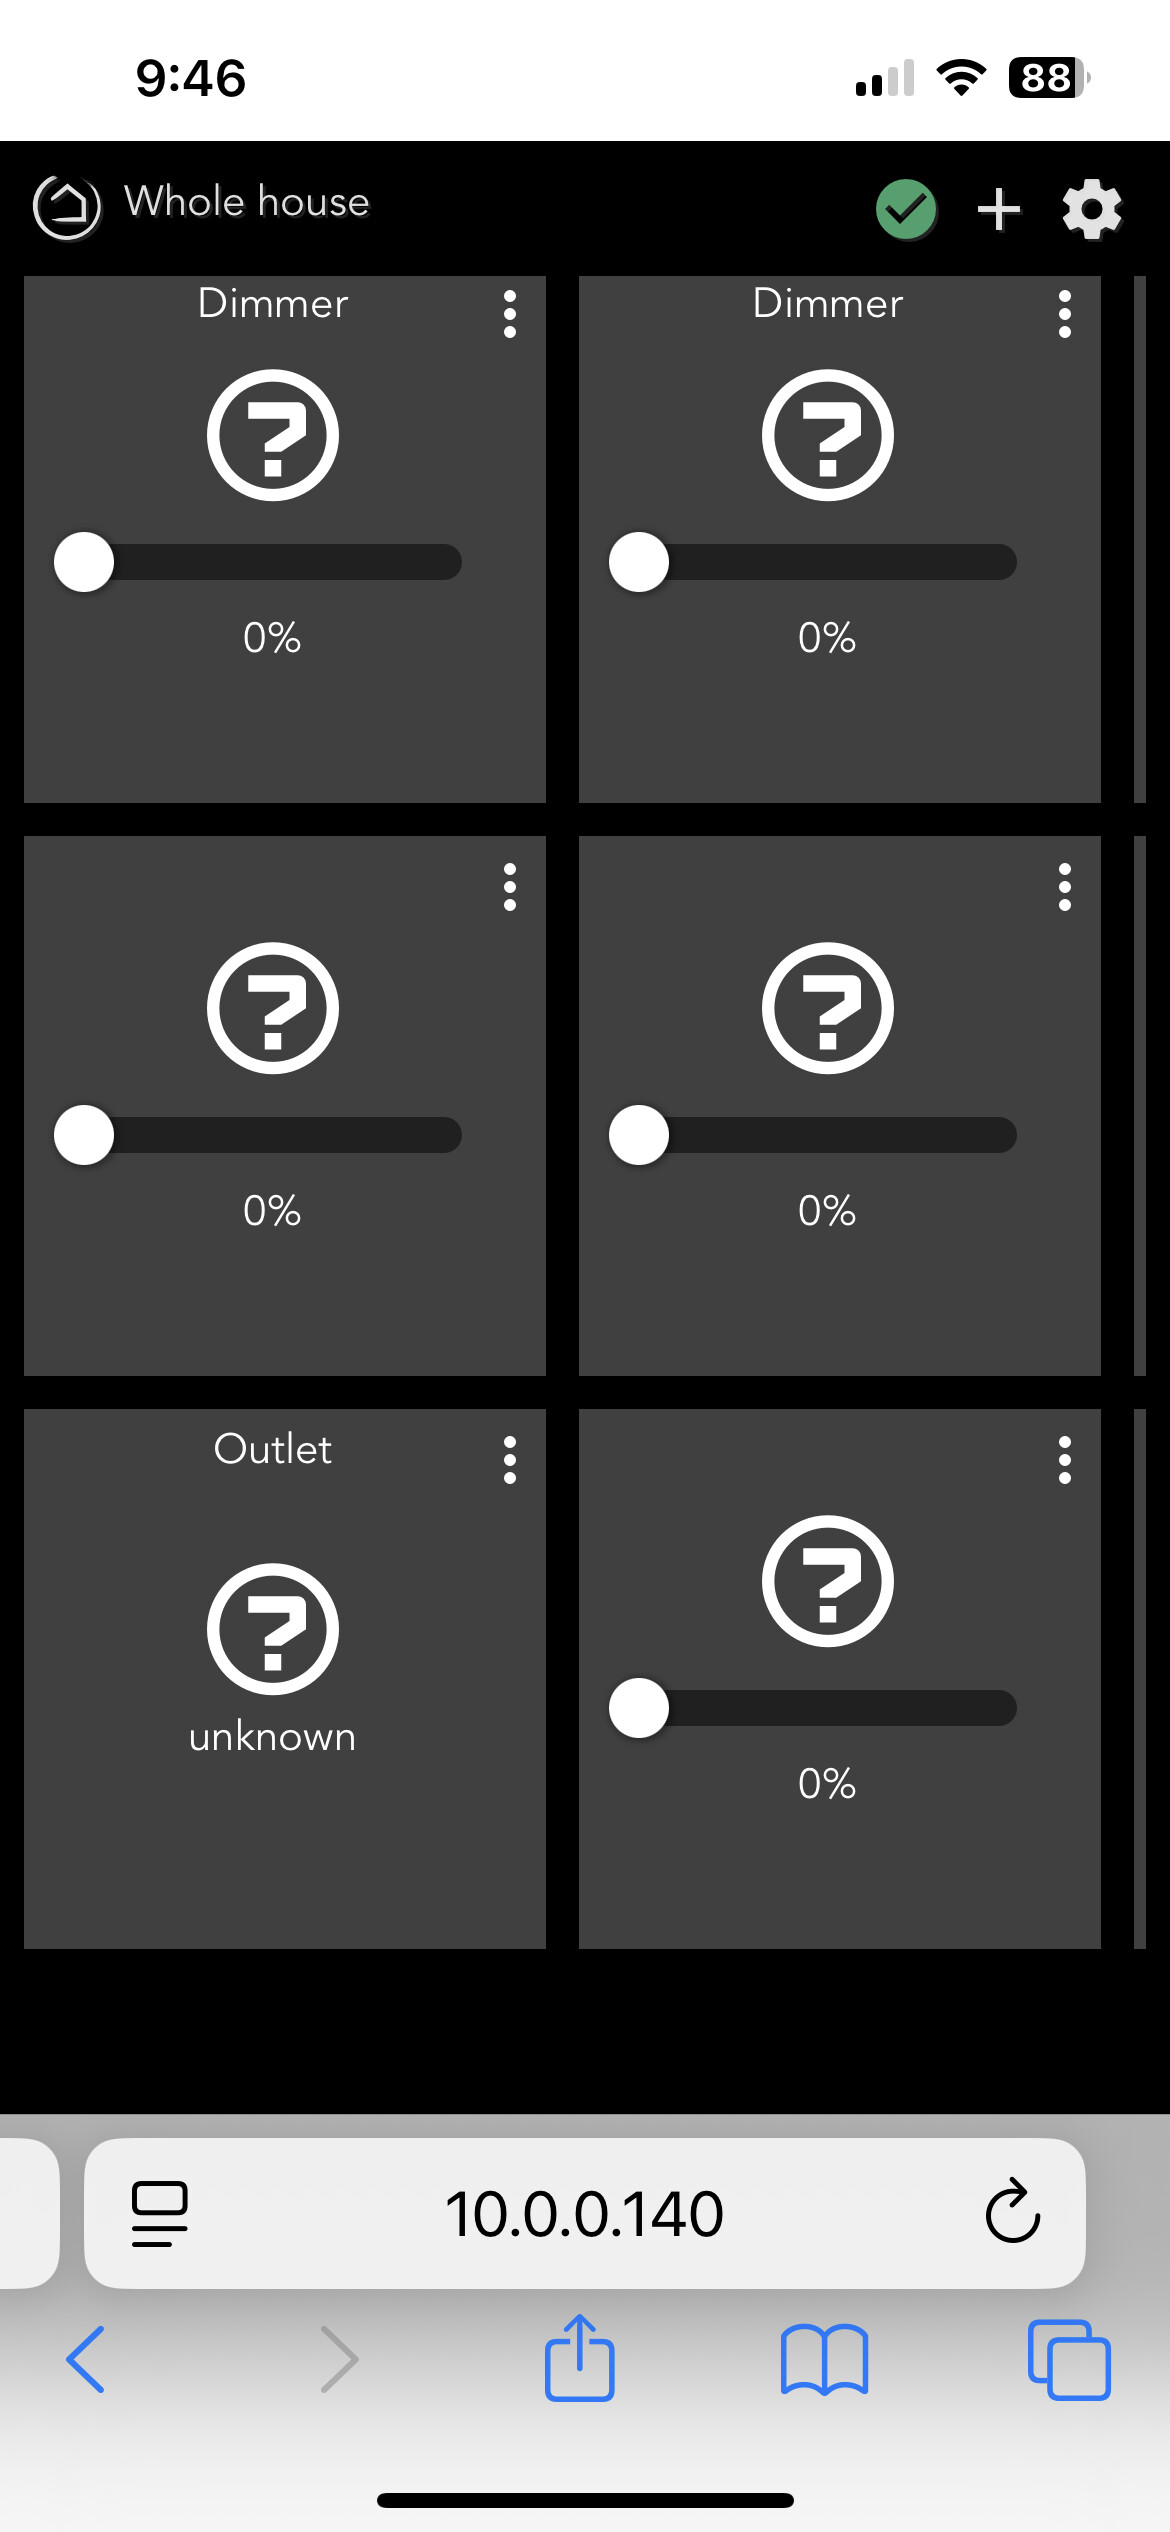
I updated software to version 2.4.1.167. You guys have changed a bunch since the version I was on. I can get to the dashboard by typing ip address. Now the dashboard has all my original blocks, but they are gray with question marks.
Screenshots would be very helpful to understand the issue.
If you have a question and want help, ask an actual question.
Do you still have your devices listed in the devices list?
The devices are still listed in the device listing. Since I know where the various devices are located on the dashboard, I can still manipulate the various lights and plugs
The question is how do I get the gray block to return where the blocks have the name of the devise showing?
Click the three … on one and see if the devices are listed there. You could try changing the device to something else and back, or also the template to something and back to dimmer or switch again.
All devices are listed in the device listing.
The current dashboard is shown in shown in screen shot.
Question is how do I get back to “normal” dashboard?
I gave you a suggestion above, did you try it?
Yes I did try the suggestion. Clicked on the three … and the device is listed for that block. Sorry but I don’t see how to change the device to some other device and back from that point in the dashboard. Would performing a back up from an earlier save fix the problem?
Again, screenshot of what you see would be helpful.
It should look like this when it pops up. All the devices available to the dashboard are listed along with the templates. Grey is the selected one.
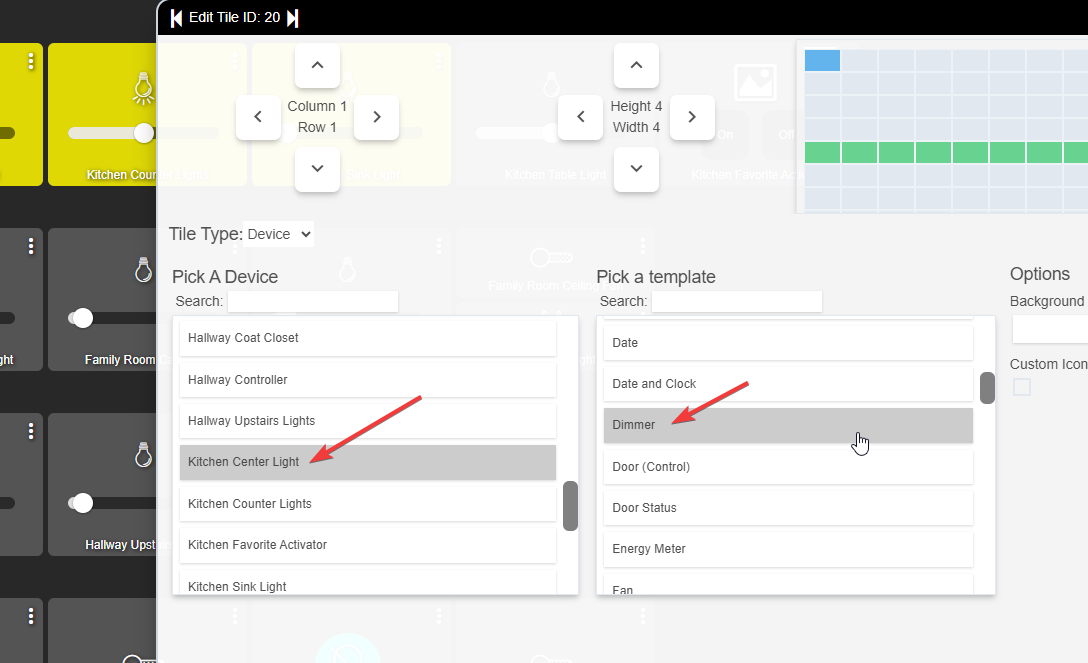
If there is just one device listed or devices are missing you might need to go to the dashboard APP (in the apps list) and select all your devices you want for the dashboard. Not sure why they would have all went missing though.
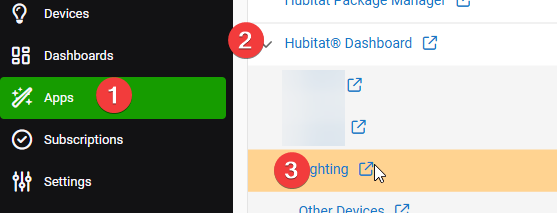
Select ONLY the devices you need for the dashboard, selecting all devices can make the dashboard run very slowly.
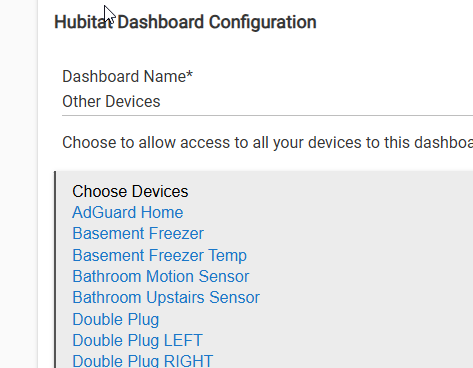
Then click DONE at the bottom.
You could try restoring a backup, do a local backup only or hub database only, no need to restore the radios if using a cloud backup.
Thanks for hanging in there with me! Only one device was listed, add the additional ones I needed and the dashboard is back to normal. Thanks from an old man who is no longer as tech savvy as I once was. Thanks again
2 Likes
Weird not sure how they all got de-selected. Maybe you had the "All devices" option selected before and I think they removed that due to the reasons I mentioned above. That possibly broke it when you updated the platform.
Glad you got it back to normal finally.

