Going to document my findings here. This is a hub I worked on for someone.
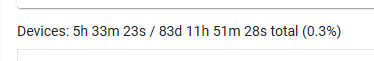
Running 2.3.9.184, very long uptime.
Then found this in the logs:


@gopher.ny @bobbyD why do we have all these log entries but yet there is no alert generated on the hub that there is a problem? I checked the alerts and all it had was an update alert. I have seen at least one other person (other than @DocNaes) have this same issue recently on the forums.
As much as I hate having to do it, I setup weekly reboots for this person to avoid this going forward...
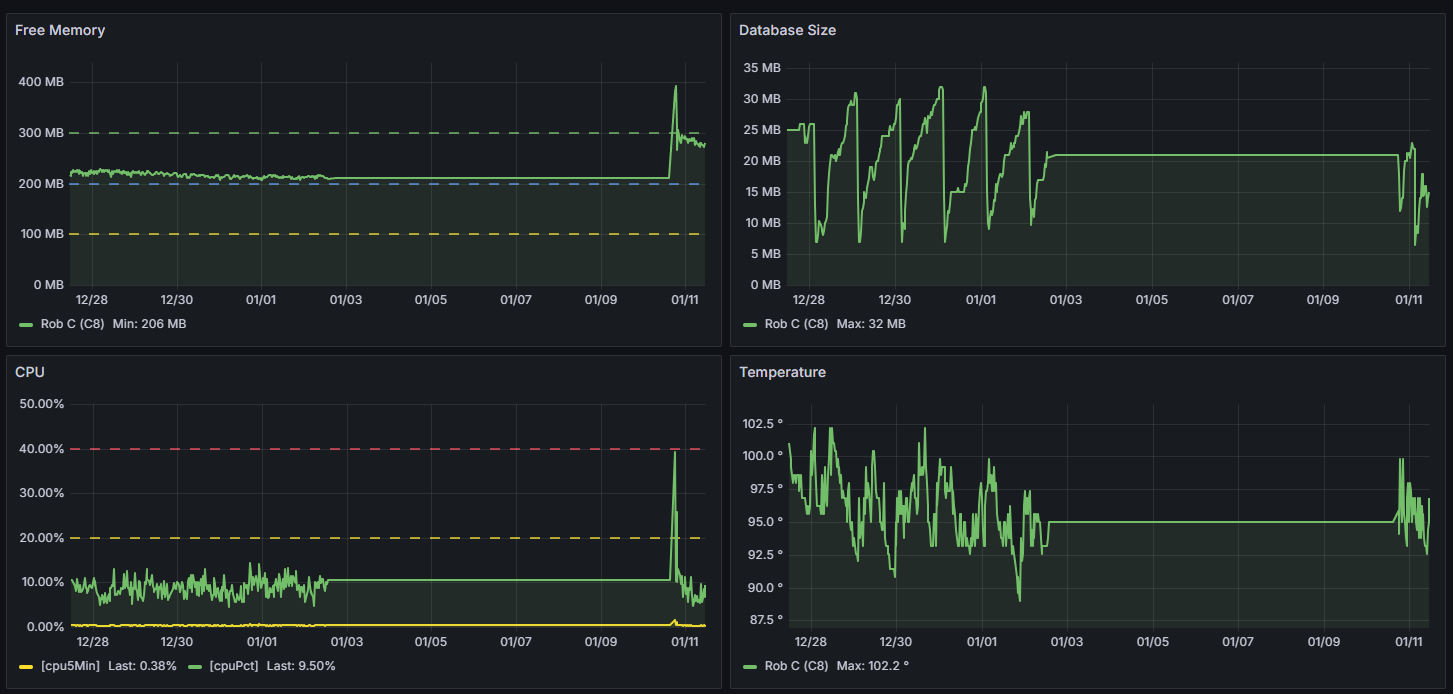
Now, I finally got into the Grafana cloud I setup for this hub.
There does not appear to be any excessive load up until the hub stopped processing events and reporting things up to influx. Unfortunately I did not think to check the actual endpoint for the CPU stats before I rebooted, so what happened between 1/2 and 1/10 is lost.
1/2/25 is when everything stopped working correctly.