So just I just wanted to bring this to the attention of @support_team .
I upgraded to the latest firmware last night on my C8. It has been working flawlessly for myself since I got it. I was one of the fortunately ones that up until today i hadn't noticed any issues at all.
I applied the latest software update just a little after 7pm. At 4:27pm today I got a pushover notice on my phone that the memory had dropped below 26mb and the hub was being restarted.
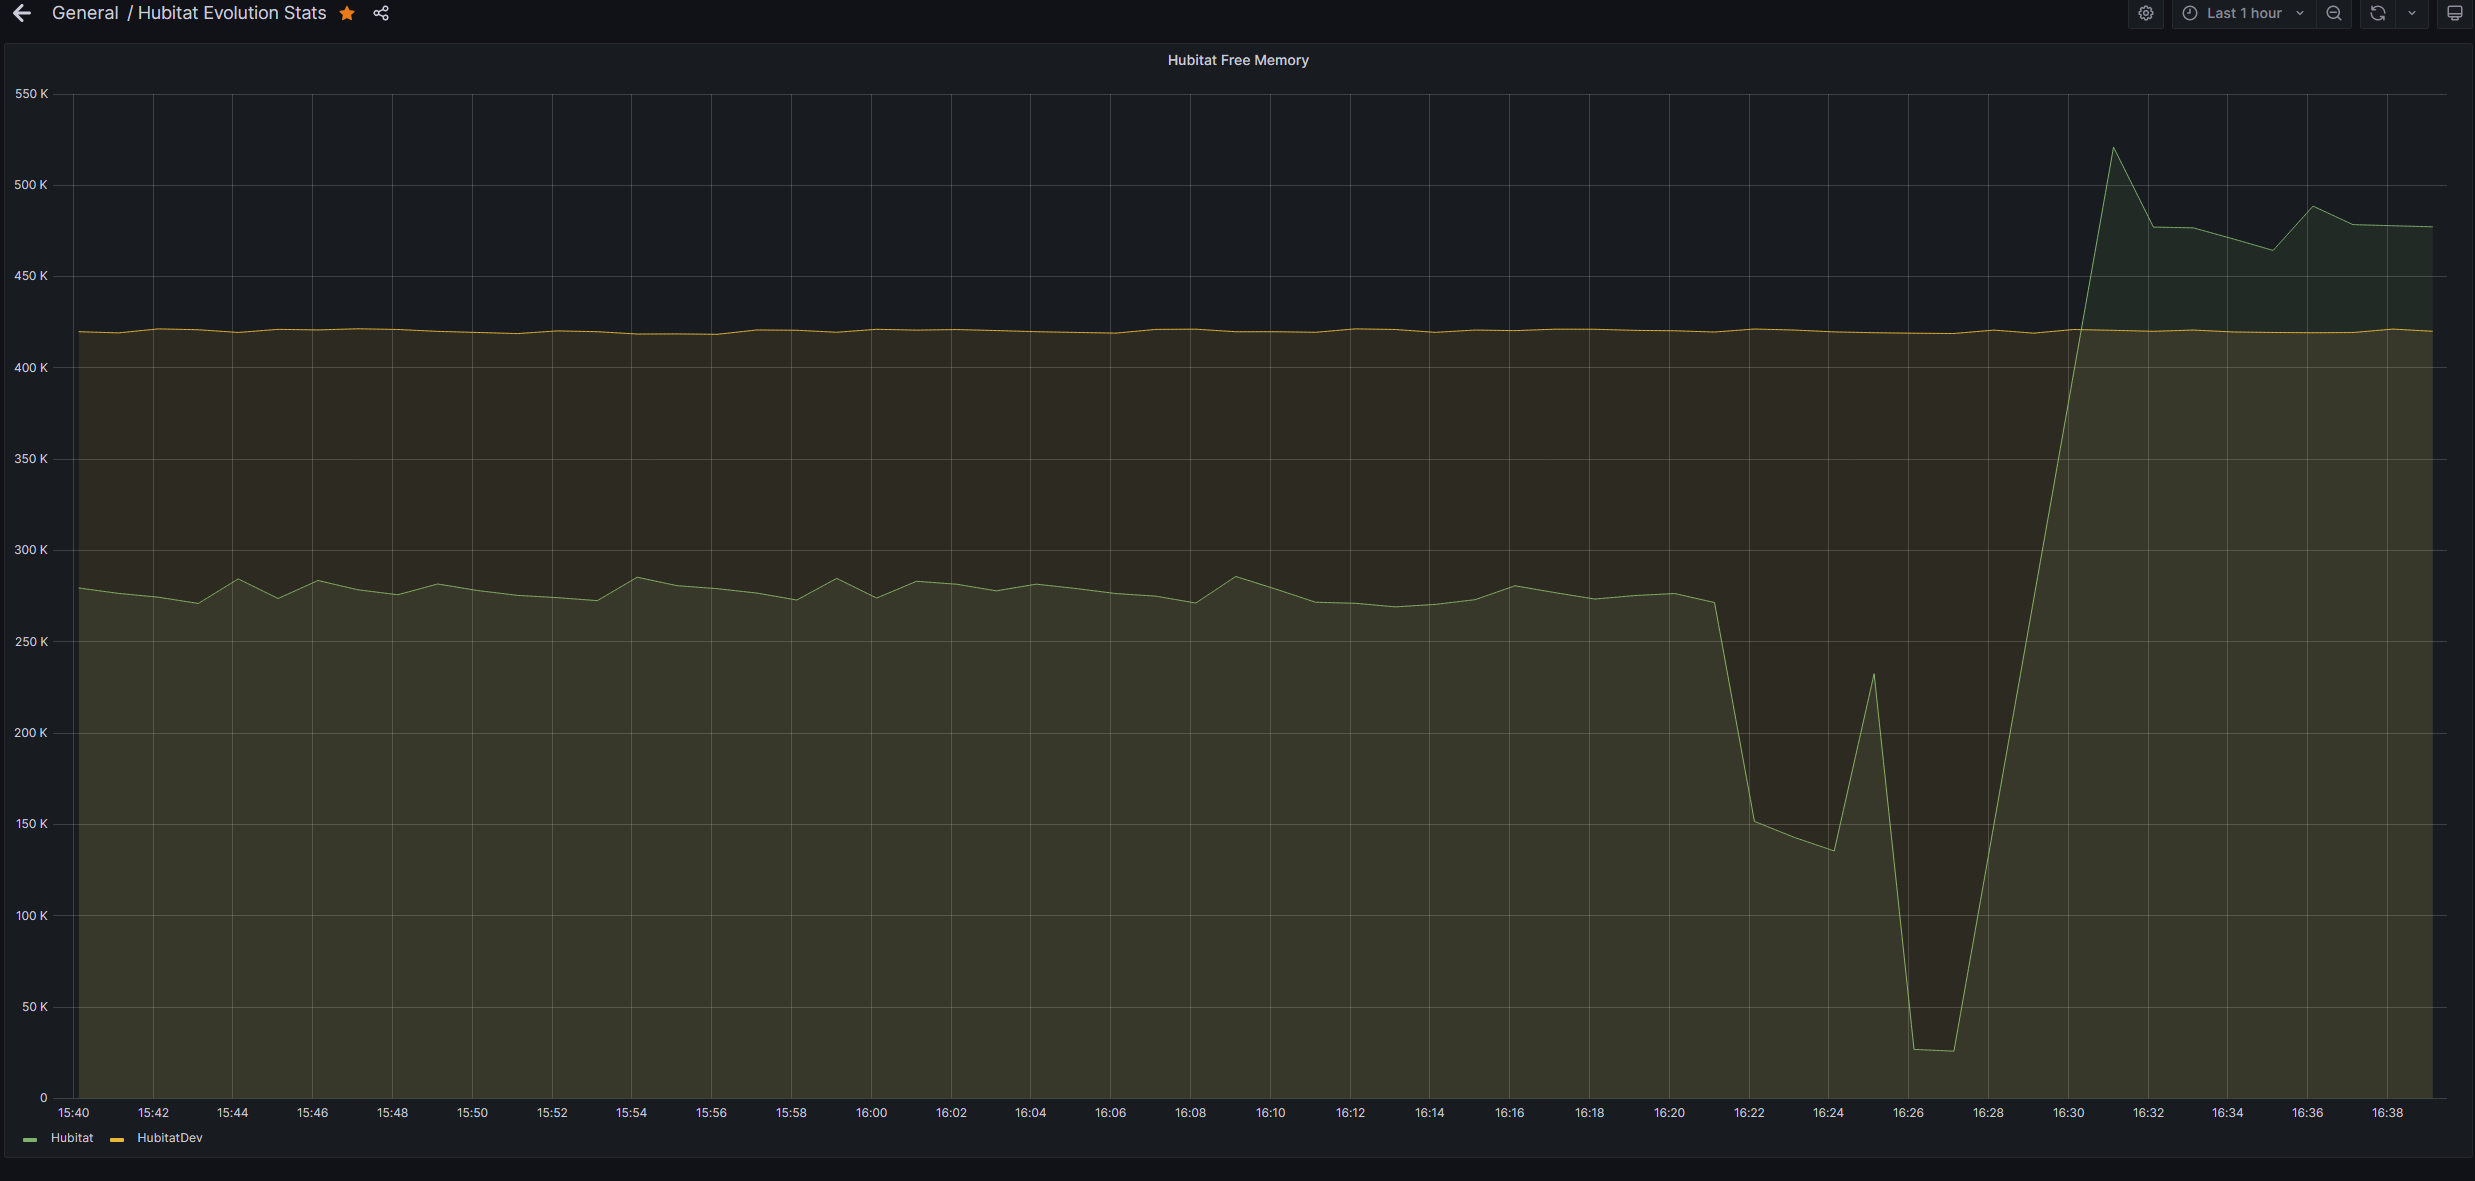
Here is the graph from grafana showing what happened on the hub.
For whatever reason the memory tanks to about 130mb n just after 4:20 and then it tanks again down to 25mb at 4:26. That is a huge drop when you consider before that it was around 270MB
The only activity I did on the hub at that time was try to install a app that a user reported a problem with. It never even got to the setup page, as the gui for the app failed due to a null value. The last thing i did was use HPM to update that after the developer published a update to fix the null value.
Neither of those items should have cause memory to tank like this. I have never seen the memory tank like this until today
I have seen another identical post. Someone @thebearmay suggested it should recover, since the low memory is due to some type of maintenance going on.
However I don't know if this is expected behavior...
But this isn't when i have maintenance scheduled in any way. It is at night. Also going down to 25MB seems a bit crasy. The hub consumed 250mb of ram in that short time.
I have the maintenance and backup run early and you do see it drop, It isn't as significant as this and it does recover from that. My hub didn't make it 24 hours which has never happened before.
I was the one that started the other thread. My free memory dropped to 17 at a time when nothing else was going on. It usually runs around 370, so this seemed really excessive.
I was trying to do a fresh insatal of InfluxDB Logger. The key is it didn't even get to the first page to setup the app because of a ui issue. That issue was a bug in the code that a value was null that was needed for the ui to display. It has sense been fixed though.
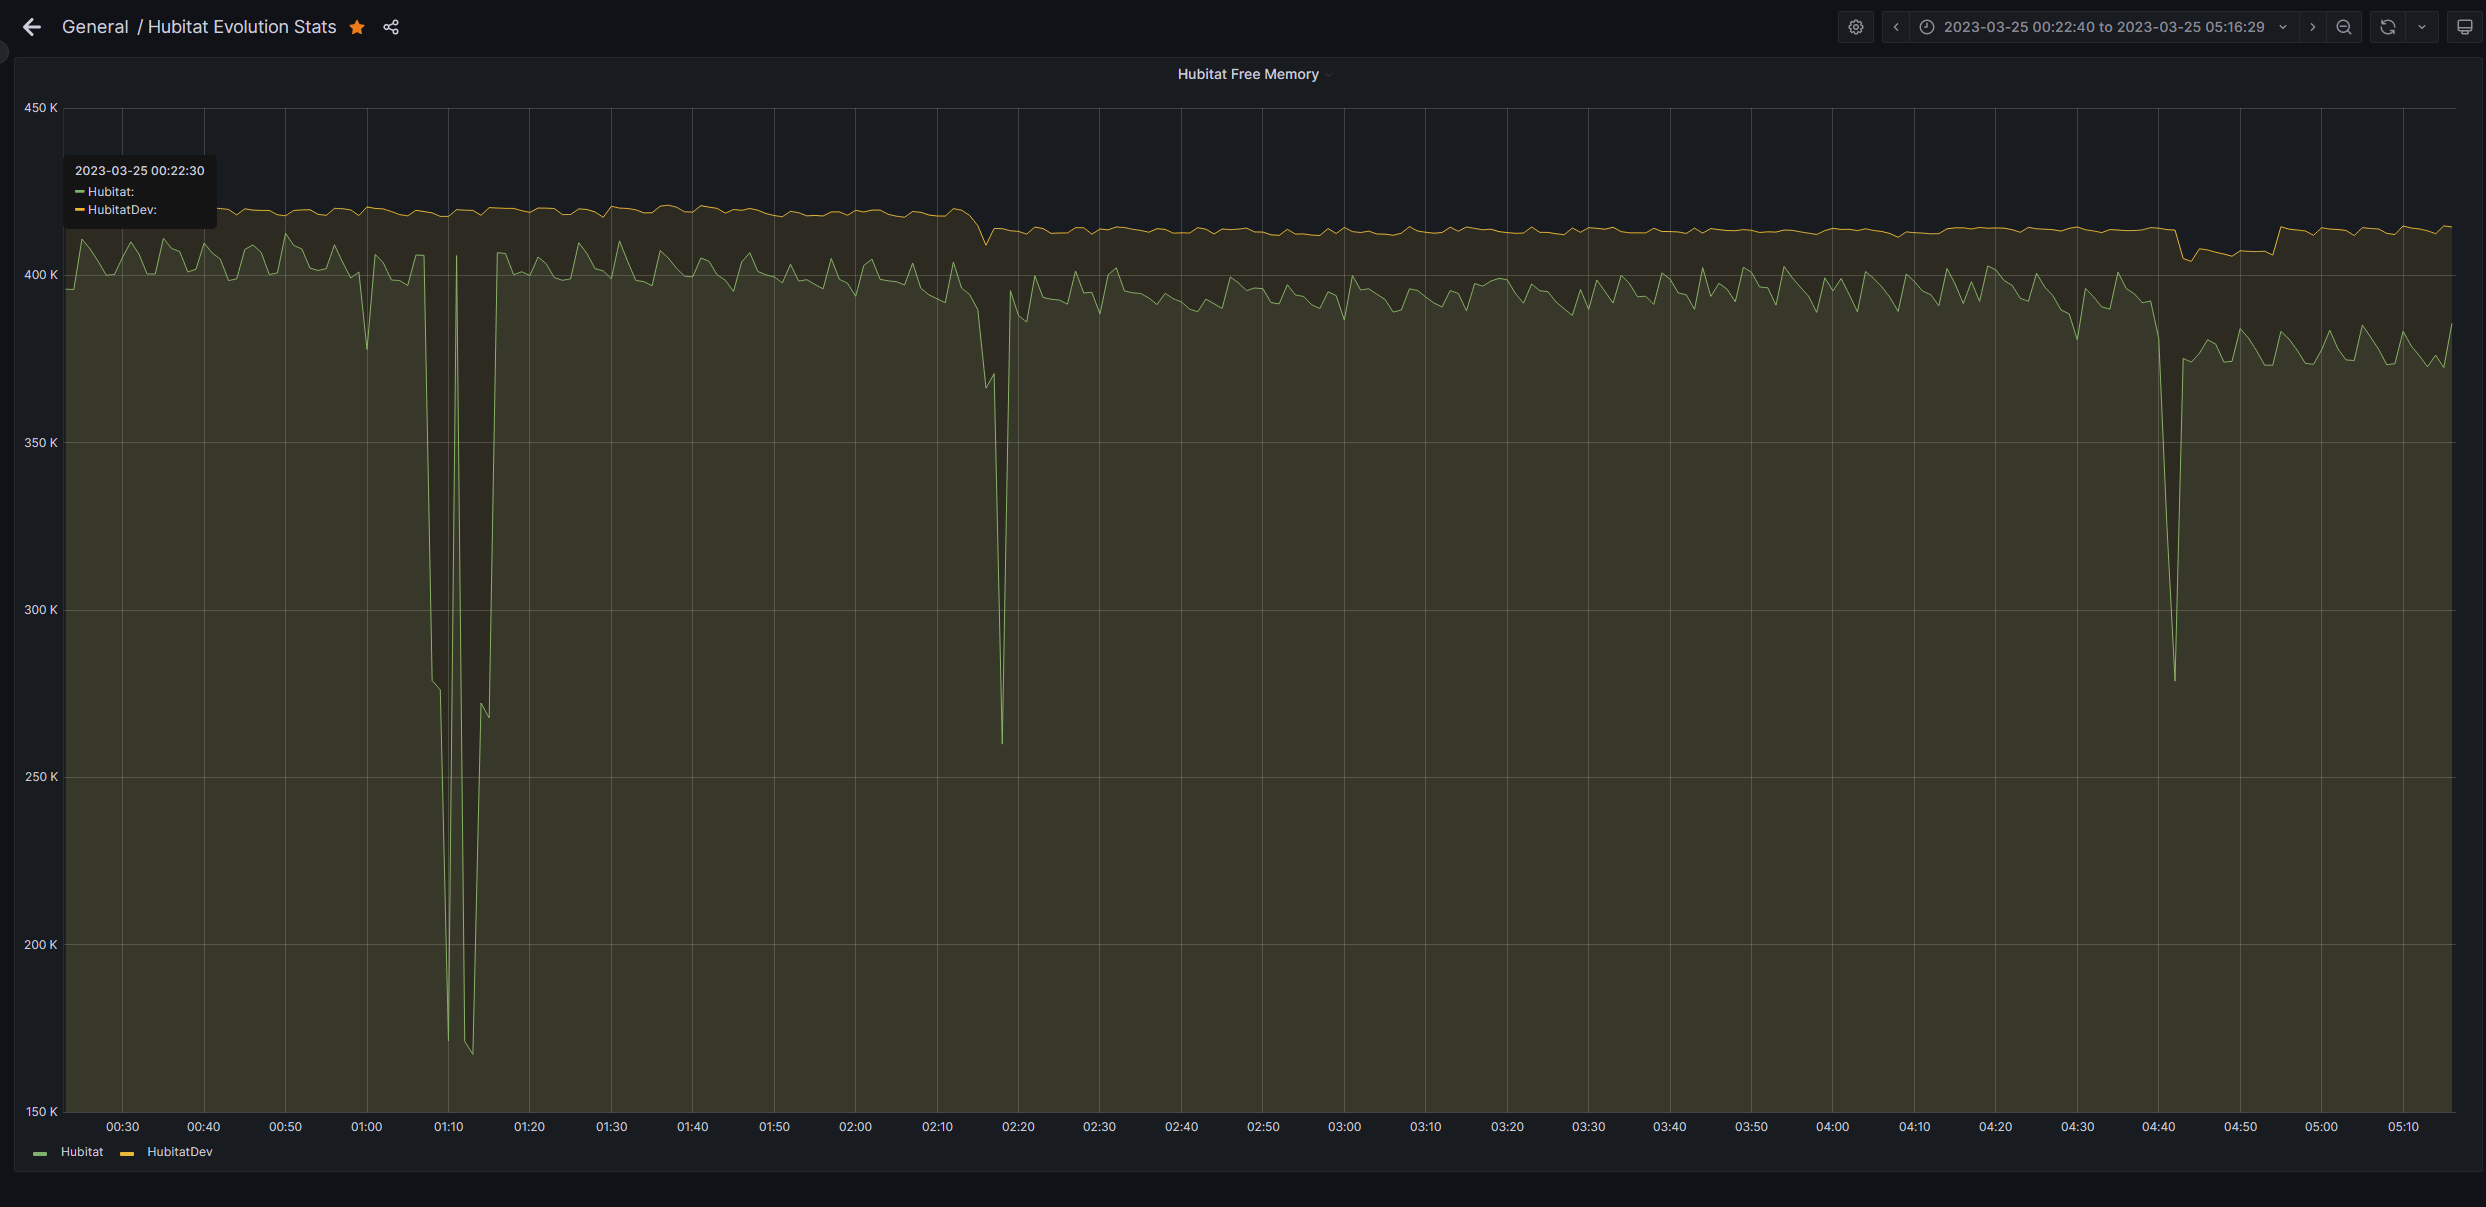
OK so this happened again early this morning. Here is the graph for that time window. At that time no user interactions were being done on the hub. Because of the timing I tend to believe/agree this isn't related to the app as suggested and is something the hub is doing in the backend. There are 3 visible dips in the graph below. The first one I think is this new event. The second and third dips are related to the local hub backup and then a backup my Unraid server downloads.
@gopher.ny So if this is a backend process do we have a way to schedule it to only occur in non busy times? i feel like this happening in the middle of the day could be detrimental to the usage of device. This would also allow myself and others to write our low memory event handling to react better to this if it is predictable. I know I am not the only one that has something like that.
This also does validates it will recover, but it looks like i had plenty of memory available for it to do so. If this was after a week or so of uptime when i am stable at around 200mb of memory then that may not have been the case.