I just setup InfluxDB/Grafana along with the InfluxDB Logger app tonight. I wanted to see what dashboards and useful queries folks have come up with. There's a fairly steep learning curve to flux so I thought I'd see what others have done as a starting point.
The main one I still use is driven primarily off data from the Hub Info driver for my 4 hubs. I still have some work to do with the performance (and temp) of my lighting setup, but hopefully you get some inspiration from the use of Grafana. I mostly look at this now via a Chrome shortcut on my Android phone. I know, I know, I should setup some kind of monitoring and alerting.... 
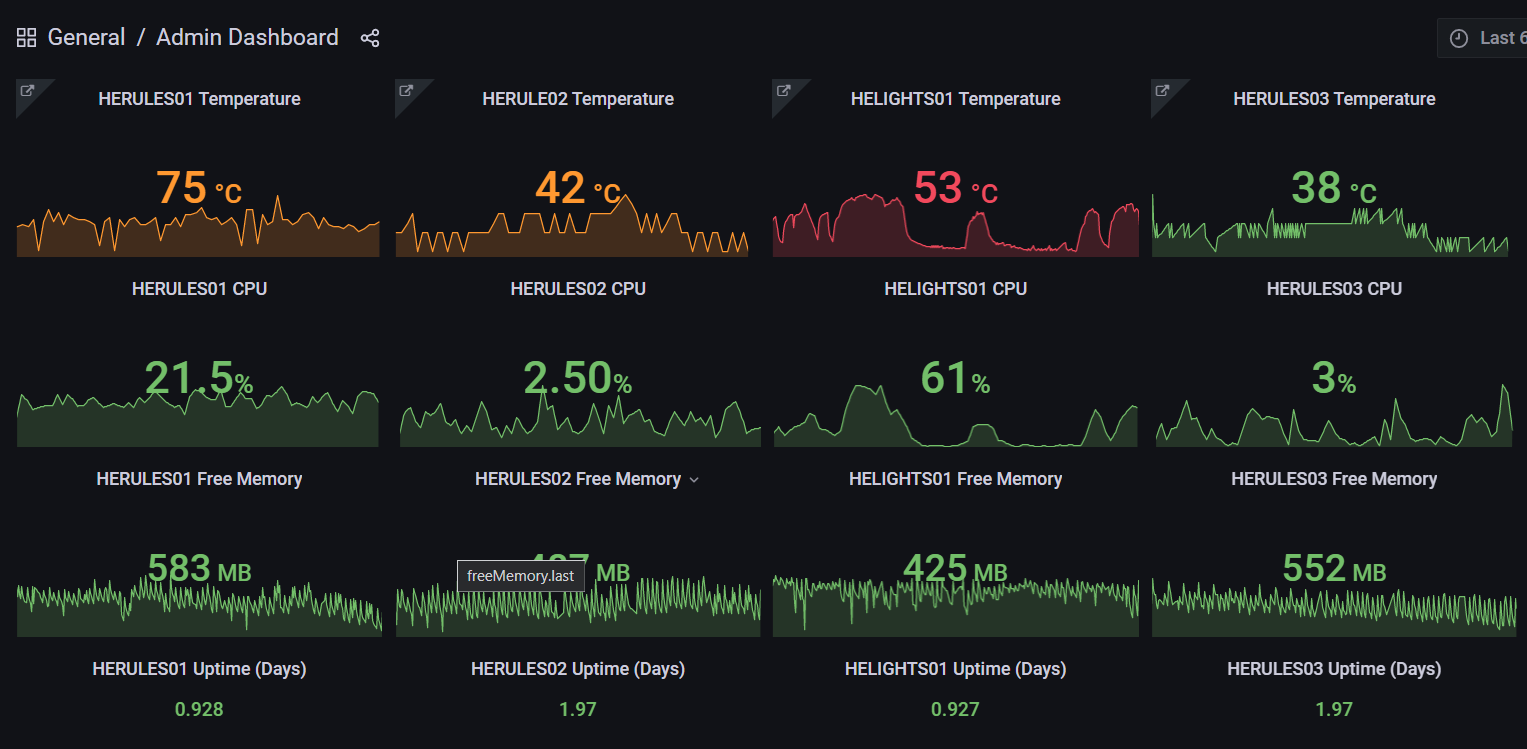
The bottom of the dashboard includes some more charts for my Rpi's and sensors (I still need to sort out the temperature reading from one of my rpi zero's). These are still coming from HE, I have a virtual temperature device that I send a reading to every minute from a shell script running on each rpi, using Maker API to receive the temperature reading.

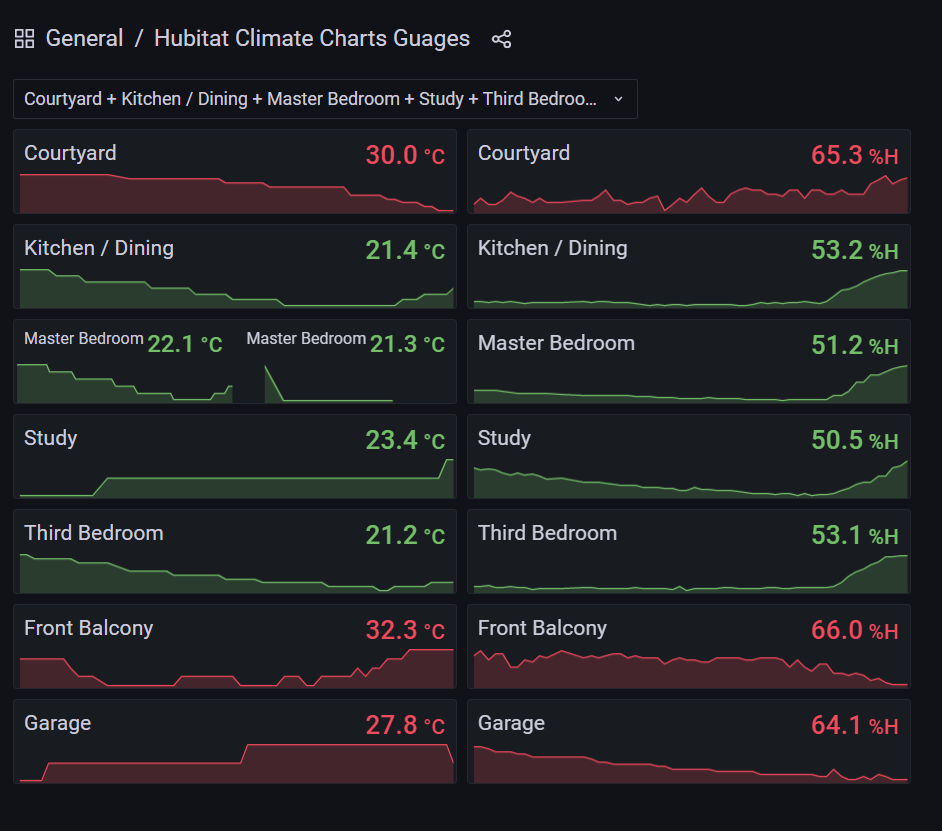
My original use was to display the temperature and humidity for various sensors I have throughout the house and outside, using an iFrame device driver on HE to display the Grafana dashboard. It's been a while since I displayed this on a dashboard outside of Grafana, but hopefully I will get back to centralising this stuff one day. Also looks like my filters / grouping is still a little sketchy for the main bedroom....
can you post what your flux queries are? I’m just getting started with flux and it is quite a bit different (and less user friendly) than the old way of constructing queries.
Or even for those of us still SQL natives... ![]()
There's likely a little to cover.... been a while since I set this up, and have probably tweaked it a little over time. Some of the basics include:
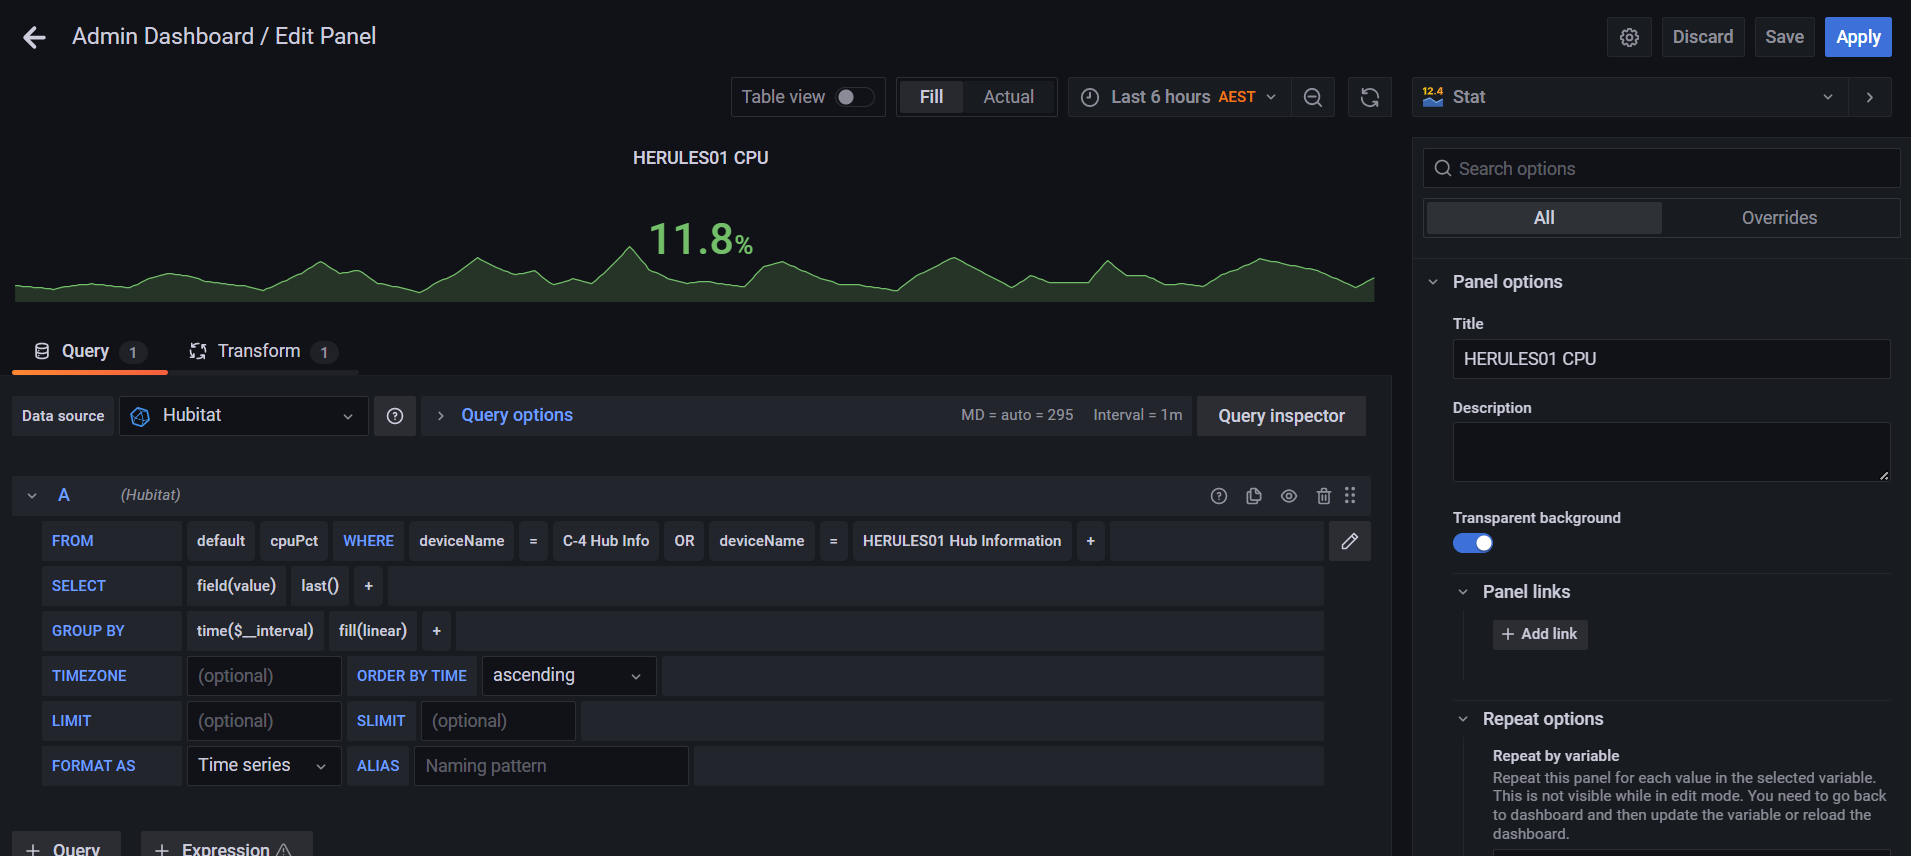
Temperature
Query:

Transform:

The only thing that really changes for the CPU is the metric (the same transform is applied):
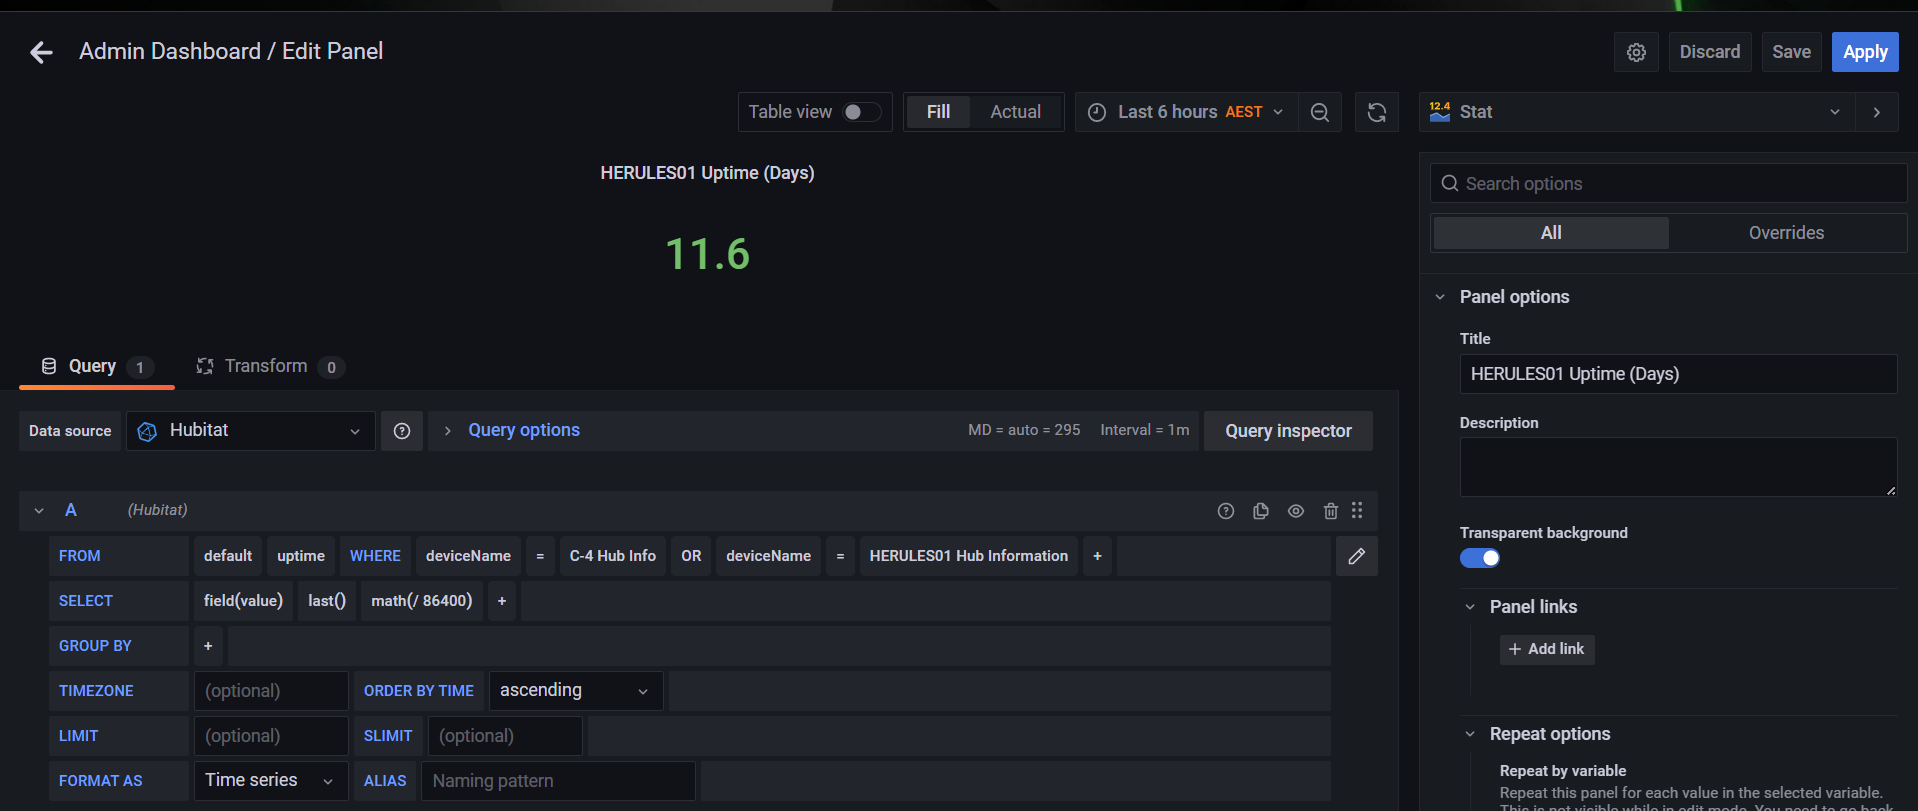
Uptime in Days applies a Mathematical function:
The sensors are a little more complicated (not much). If that is what you are interested in, let me know and I can work through those as well.
There's probably a few more details hidden away in the dashboard I have forgotten about ![]() I also don't appear to have used the repeat options available in Grafana that may make things easier.... If you are interested or need / want to know about these, let me know and I can dig out an example of this.
I also don't appear to have used the repeat options available in Grafana that may make things easier.... If you are interested or need / want to know about these, let me know and I can dig out an example of this.
I'd also add I am likely on an older version of Grafana and InfluxDB. If you hit any hurdles that may be a result of this, let me know and I can find out the specific versions I am running. I at least know I am not running the defining change to the latest InfluxDB version that required changes to some of the loggers around here....
flux queries are quite a bit different. when using flux, you can’t use the query “builder” to get what you want — as best I can tell. I may roll back to pre 1.8 influx.
As an example, here is the temperature query:
SELECT last("value") FROM "temperature" WHERE ("deviceName" = 'C-4 Hub Info' OR "deviceName" = 'HERULES01 Hub Information') AND $timeFilter GROUP BY time(5m) fill(linear)
But I hear you, it's not immediately intuitive. I'll cut them and the other platforms like InfluxDB some slack, it is a different paradigm being time-based recording, much like a fact table I am more used to in data warehousing. The use of a single metric, the reliance on the time-based column and the tagging is somewhat foreign, but not entirely for me. Coming from an operational system point of view there are a few leaps to make at once...
flux is totally different syntax.
You can run influxQL queries on a 2.0 database. There is a small additional setup step (I don't remember the exact steps, but I found them via a web search). Also, ChatGPT knows some Flux. 4 is much better than 3.5.
1 Like
Sorry, I only just twigged what you meant.... That is not the flux syntax that I posted.... And that would be a pain if you can't use the query builder. That may have been one of the reasons I stayed on the older version.
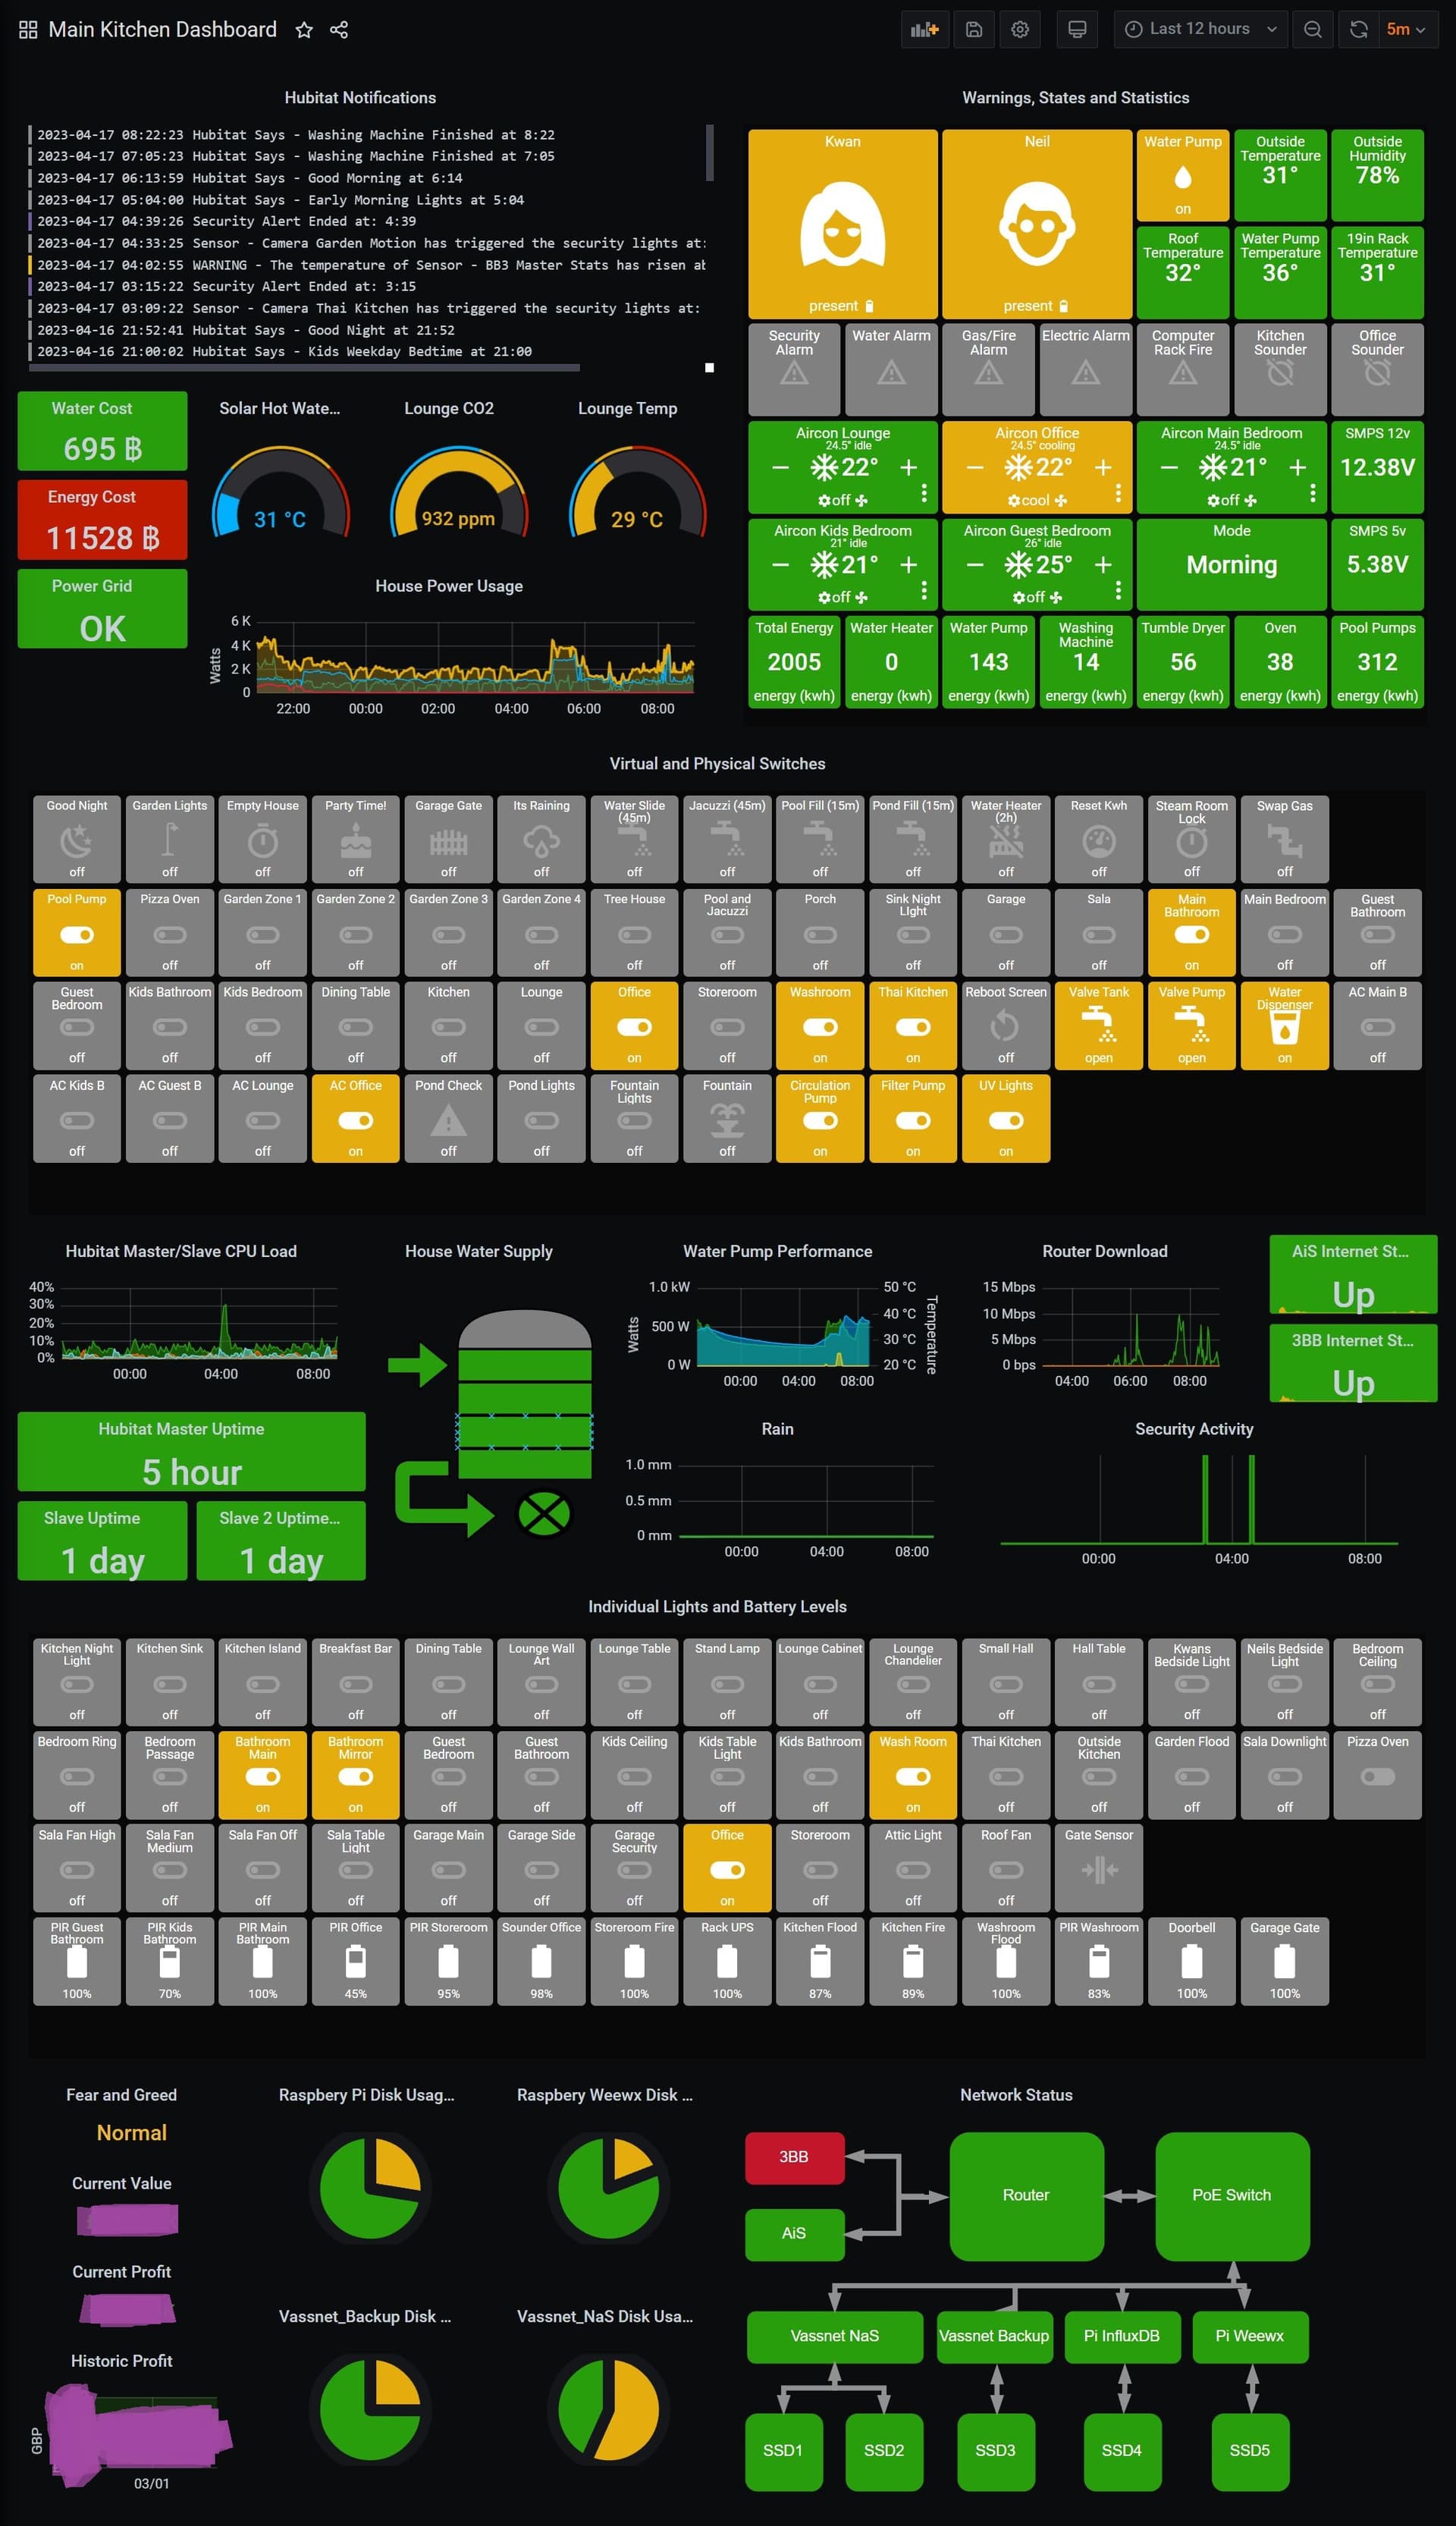
I use Grafana as my Main Hubitat Interface. This is my Kitchen Tablet (32in) Screen. I use Iframes to pull in Actiontiles and Node-Red/InfluxDB to produce my Portfolio Overview and all my Network Data goes to Influx via SMTP. This is then all mashed up to produce a main overview screen with about another 10 screens for various more detailed information. To get the tank level monitor I used Hubduino with tank Sensors for Flow and Level. Weather Data comes via a local weather station running Weewix on a Pi4b and InfluxDb and Node-Red run on another Pi4b. Security is handled by a Camect recorder unit which has a Hubitat device drive so I can identify what the security trigger is (i.e Cat, Dog, or Human). I work on the principle that Yellow is Active and anything in Red needs attention.
1 Like
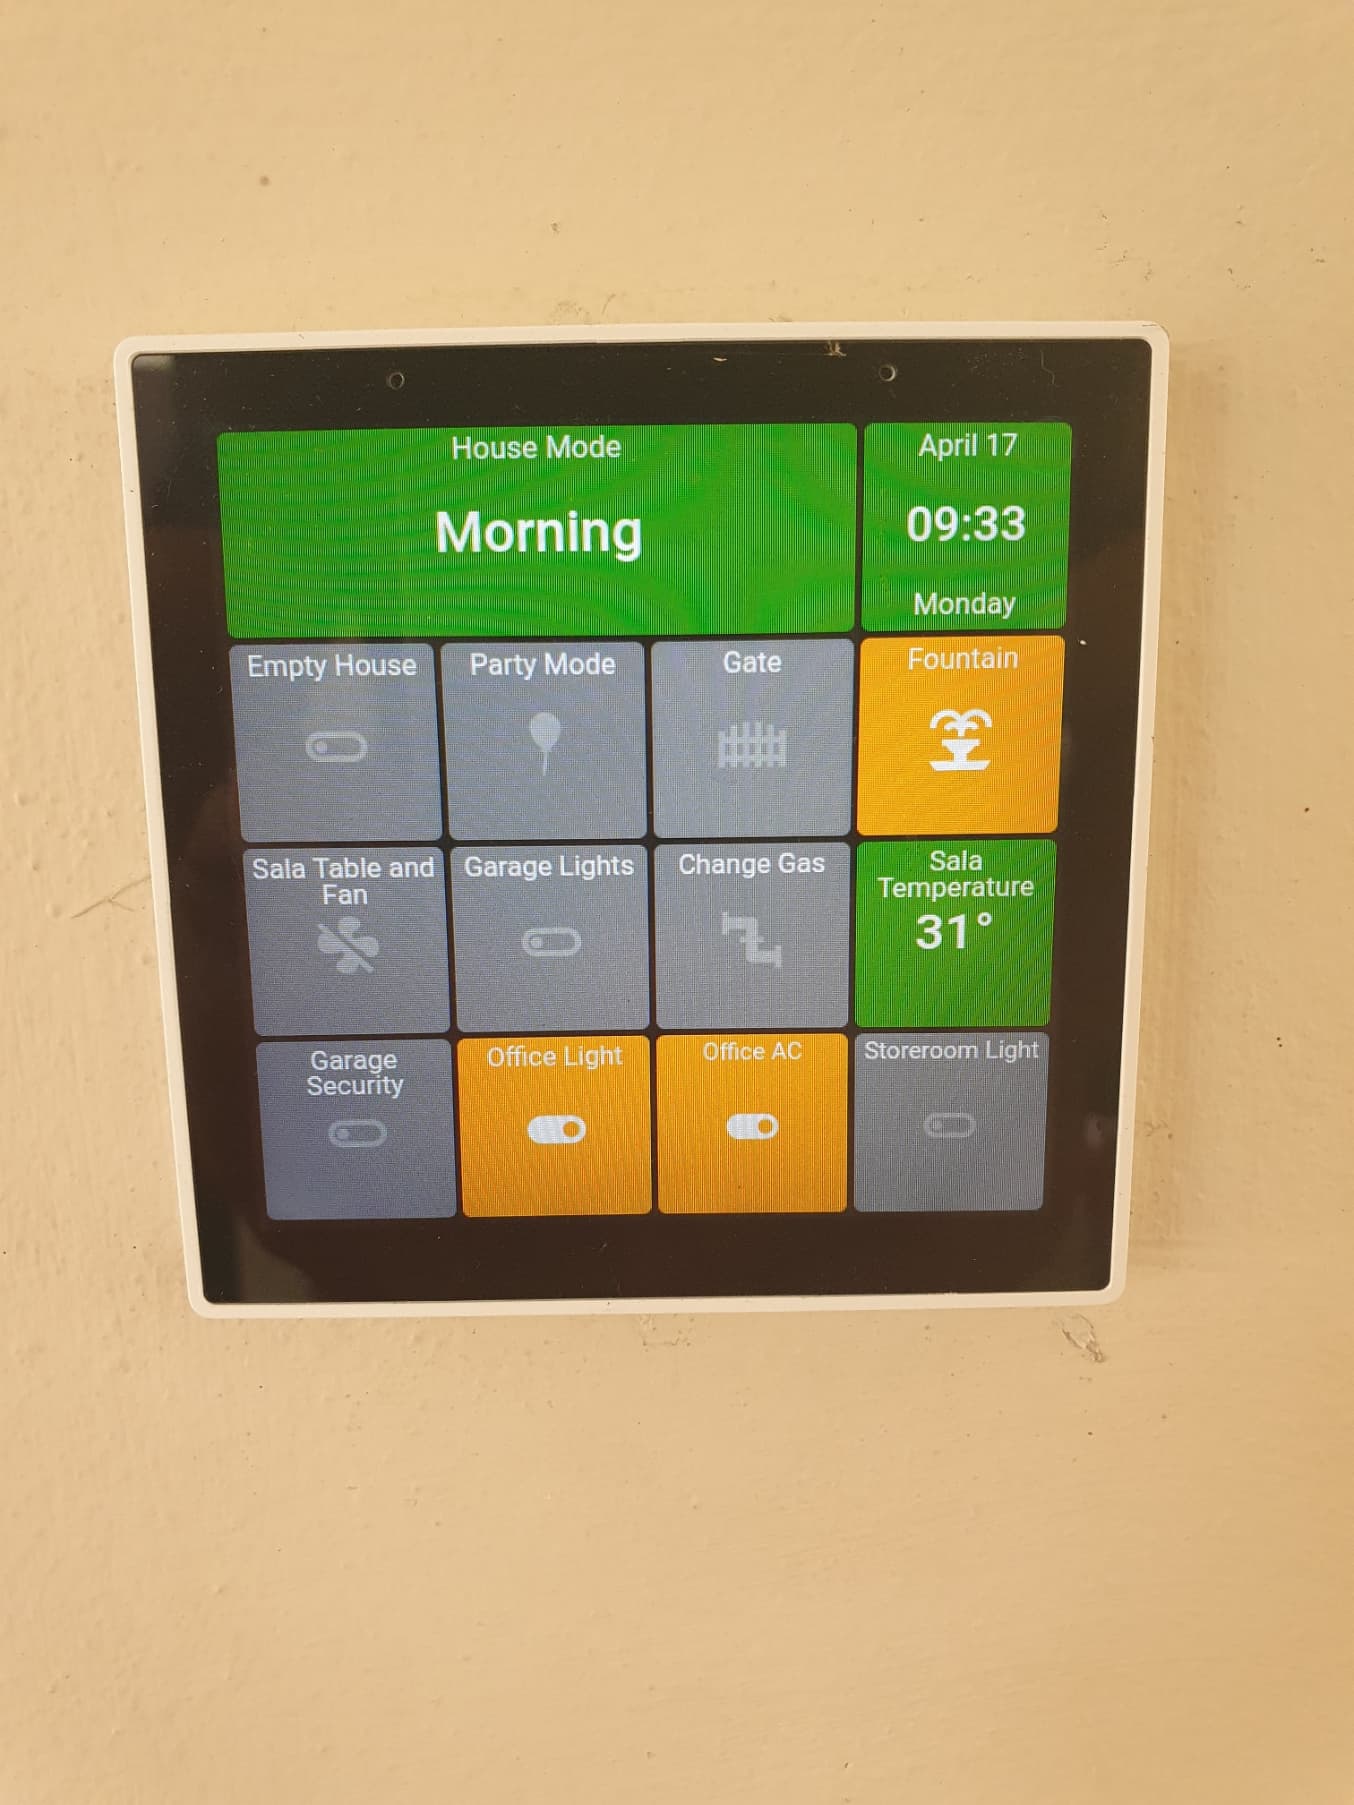
The second part of my Automation strategy is to replace several of my UK wall switches with these wonderful Tuya T6E panels. They basically run Android but you need to root them (which takes some work). Once that is done they run a 4*4 grid of Actiontiles beautifully. The beauty is you can easily have up to 16 custom buttons in any single location. I have tried Grafana on these and it works but doesn't look very good.
1 Like
This topic was automatically closed 365 days after the last reply. New replies are no longer allowed.

