I have influxdb2 and Grafana running in docker on my synologyNAS. It works very well, and is very powerful but a bit confusing.
As I understand it - I install Influx Logger - and choose all the devices I wish to grab events for. I send this output into a 'bucket' on Influxdb.
Do I create seperate buckets, independently? Or is one giant bucket sufficient to collect all my output?
Originally, I implemented In/Graf to collect just humidity details of a single sensor. I had no issues.
But now that it works so well, I want to have multiple graphs - a temps graph, a humidity graph, a lux graph. When I edit the Grafana graph I'm getting all of them overlaid - Is my grafana configuration the fault? I'm not drilled down on the graph correctly and need to create multiple graphs?
Lets start with what version of InfluxDB and Grafana are you using?
One database is more then sufficient. You will adjust your query to only pull the data you want for a given graph.
That is a great way to start which is to get one item the way you want it.
It isn't likely at fault. You will need to create multiple panels on the dashboard for Grafana and then each panel will have it's own query that will determine the kind of data it will display. Look in the upper right corner for the + button to add a new panel to it i believe.
You would need to tweak it a little but as a example here is my Hubitat Hub stats dashboard as an example (the response time panel would never work for you actually, but the others could be made to work with the Hubinfo driver):
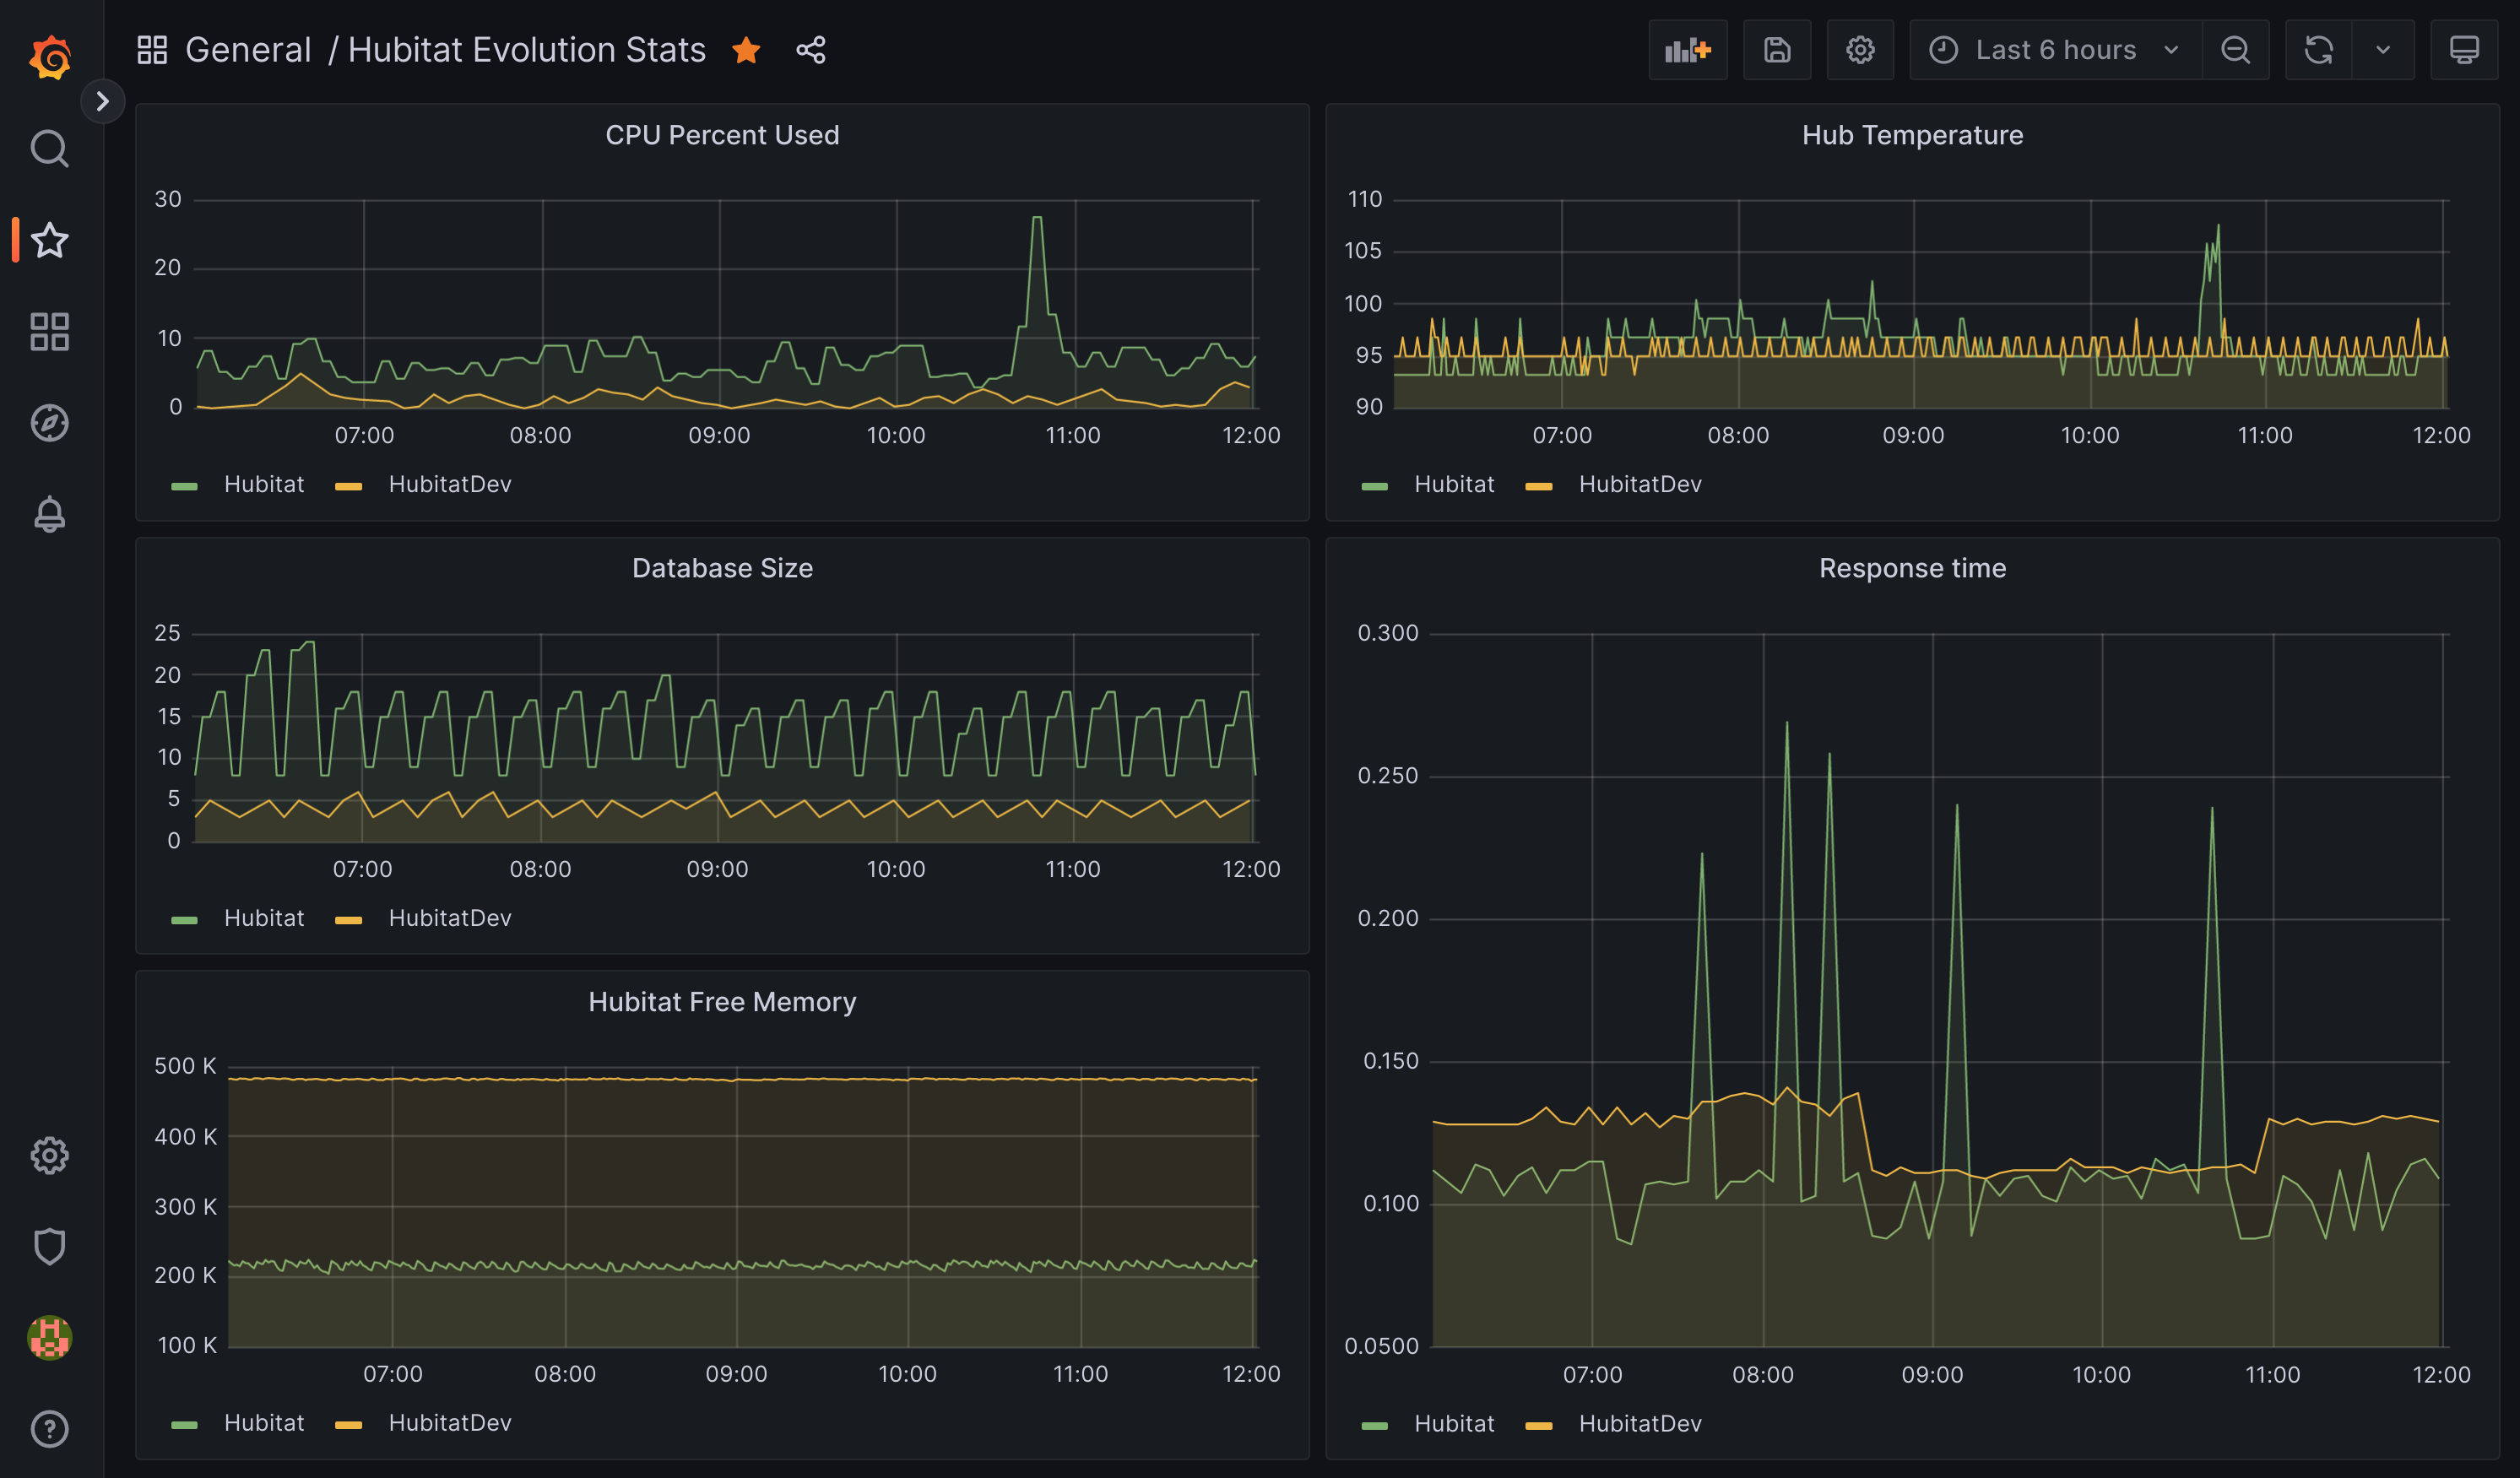
The json for that dashboard is"
{
"annotations": {
"list": [
{
"builtIn": 1,
"datasource": {
"type": "datasource",
"uid": "grafana"
},
"enable": true,
"hide": true,
"iconColor": "rgba(0, 211, 255, 1)",
"name": "Annotations & Alerts",
"target": {
"limit": 100,
"matchAny": false,
"tags": [],
"type": "dashboard"
},
"type": "dashboard"
}
]
},
"editable": true,
"fiscalYearStartMonth": 0,
"graphTooltip": 0,
"id": 7,
"links": [],
"liveNow": false,
"panels": [
{
"aliasColors": {},
"bars": false,
"dashLength": 10,
"dashes": false,
"datasource": {
"type": "influxdb",
"uid": "000000001"
},
"fill": 1,
"fillGradient": 0,
"gridPos": {
"h": 6,
"w": 12,
"x": 0,
"y": 0
},
"hiddenSeries": false,
"id": 8,
"legend": {
"avg": false,
"current": false,
"max": false,
"min": false,
"show": true,
"total": false,
"values": false
},
"lines": true,
"linewidth": 1,
"nullPointMode": "null",
"options": {
"alertThreshold": true
},
"percentage": false,
"pluginVersion": "9.4.7",
"pointradius": 2,
"points": false,
"renderer": "flot",
"seriesOverrides": [],
"spaceLength": 10,
"stack": false,
"steppedLine": false,
"targets": [
{
"alias": "$tag_hub",
"datasource": {
"type": "influxdb",
"uid": "000000001"
},
"groupBy": [
{
"params": [
"$__interval"
],
"type": "time"
},
{
"params": [
"hub"
],
"type": "tag"
},
{
"params": [
"linear"
],
"type": "fill"
}
],
"measurement": "hubcpuPct",
"orderByTime": "ASC",
"policy": "default",
"refId": "A",
"resultFormat": "time_series",
"select": [
[
{
"params": [
"value"
],
"type": "field"
},
{
"params": [],
"type": "mean"
}
]
],
"tags": []
}
],
"thresholds": [],
"timeRegions": [],
"title": "CPU Percent Used",
"tooltip": {
"shared": true,
"sort": 0,
"value_type": "individual"
},
"type": "graph",
"xaxis": {
"mode": "time",
"show": true,
"values": []
},
"yaxes": [
{
"format": "short",
"logBase": 1,
"show": true
},
{
"format": "short",
"logBase": 1,
"show": true
}
],
"yaxis": {
"align": false
}
},
{
"aliasColors": {},
"bars": false,
"dashLength": 10,
"dashes": false,
"datasource": {
"type": "influxdb",
"uid": "000000001"
},
"fill": 1,
"fillGradient": 0,
"gridPos": {
"h": 6,
"w": 12,
"x": 12,
"y": 0
},
"hiddenSeries": false,
"id": 6,
"legend": {
"avg": false,
"current": false,
"max": false,
"min": false,
"show": true,
"total": false,
"values": false
},
"lines": true,
"linewidth": 1,
"nullPointMode": "null",
"options": {
"alertThreshold": true
},
"percentage": false,
"pluginVersion": "9.4.7",
"pointradius": 2,
"points": false,
"renderer": "flot",
"seriesOverrides": [],
"spaceLength": 10,
"stack": false,
"steppedLine": false,
"targets": [
{
"alias": "$tag_hub",
"datasource": {
"type": "influxdb",
"uid": "000000001"
},
"groupBy": [
{
"params": [
"$__interval"
],
"type": "time"
},
{
"params": [
"deviceId"
],
"type": "tag"
},
{
"params": [
"hub"
],
"type": "tag"
},
{
"params": [
"linear"
],
"type": "fill"
}
],
"measurement": "hubTemp",
"orderByTime": "ASC",
"policy": "default",
"refId": "A",
"resultFormat": "time_series",
"select": [
[
{
"params": [
"value"
],
"type": "field"
},
{
"params": [],
"type": "mean"
}
]
],
"tags": [
{
"key": "displayName",
"operator": "=",
"value": "Hub Temperature"
},
{
"condition": "AND",
"key": "hub",
"operator": "=",
"value": "Hubitat"
},
{
"condition": "OR",
"key": "hub",
"operator": "=",
"value": "Hubitat - C4"
},
{
"condition": "OR",
"key": "displayName",
"operator": "=",
"value": "Hub Temperature"
},
{
"condition": "AND",
"key": "hub",
"operator": "=",
"value": "HubitatDev"
}
]
}
],
"thresholds": [],
"timeRegions": [],
"title": "Hub Temperature",
"tooltip": {
"shared": true,
"sort": 0,
"value_type": "individual"
},
"type": "graph",
"xaxis": {
"mode": "time",
"show": true,
"values": []
},
"yaxes": [
{
"format": "short",
"logBase": 1,
"show": true
},
{
"format": "short",
"logBase": 1,
"show": true
}
],
"yaxis": {
"align": false
}
},
{
"aliasColors": {},
"bars": false,
"dashLength": 10,
"dashes": false,
"datasource": {
"type": "influxdb",
"uid": "000000001"
},
"fill": 1,
"fillGradient": 0,
"gridPos": {
"h": 6,
"w": 12,
"x": 0,
"y": 6
},
"hiddenSeries": false,
"id": 10,
"legend": {
"avg": false,
"current": false,
"max": false,
"min": false,
"show": true,
"total": false,
"values": false
},
"lines": true,
"linewidth": 1,
"nullPointMode": "null",
"options": {
"alertThreshold": true
},
"percentage": false,
"pluginVersion": "9.4.7",
"pointradius": 2,
"points": false,
"renderer": "flot",
"seriesOverrides": [],
"spaceLength": 10,
"stack": false,
"steppedLine": false,
"targets": [
{
"alias": "$tag_hub",
"datasource": {
"type": "influxdb",
"uid": "000000001"
},
"groupBy": [
{
"params": [
"$__interval"
],
"type": "time"
},
{
"params": [
"hub"
],
"type": "tag"
},
{
"params": [
"linear"
],
"type": "fill"
}
],
"measurement": "hubDbSize",
"orderByTime": "ASC",
"policy": "default",
"refId": "A",
"resultFormat": "time_series",
"select": [
[
{
"params": [
"value"
],
"type": "field"
},
{
"params": [],
"type": "mean"
}
]
],
"tags": []
}
],
"thresholds": [],
"timeRegions": [],
"title": "Database Size",
"tooltip": {
"shared": true,
"sort": 0,
"value_type": "individual"
},
"type": "graph",
"xaxis": {
"mode": "time",
"show": true,
"values": []
},
"yaxes": [
{
"format": "short",
"logBase": 1,
"show": true
},
{
"format": "short",
"logBase": 1,
"show": true
}
],
"yaxis": {
"align": false
}
},
{
"aliasColors": {},
"bars": false,
"dashLength": 10,
"dashes": false,
"datasource": {
"type": "influxdb",
"uid": "000000001"
},
"fill": 1,
"fillGradient": 0,
"gridPos": {
"h": 13,
"w": 12,
"x": 12,
"y": 6
},
"hiddenSeries": false,
"id": 4,
"legend": {
"avg": false,
"current": false,
"max": false,
"min": false,
"show": true,
"total": false,
"values": false
},
"lines": true,
"linewidth": 1,
"nullPointMode": "null",
"options": {
"alertThreshold": true
},
"percentage": false,
"pluginVersion": "9.4.7",
"pointradius": 2,
"points": false,
"renderer": "flot",
"seriesOverrides": [],
"spaceLength": 10,
"stack": false,
"steppedLine": false,
"targets": [
{
"alias": "$tag_hub",
"datasource": {
"type": "influxdb",
"uid": "000000001"
},
"groupBy": [
{
"params": [
"$__interval"
],
"type": "time"
},
{
"params": [
"hub"
],
"type": "tag"
},
{
"params": [
"linear"
],
"type": "fill"
}
],
"measurement": "responseTime",
"orderByTime": "ASC",
"policy": "default",
"queryType": "randomWalk",
"refId": "A",
"resultFormat": "time_series",
"select": [
[
{
"params": [
"value"
],
"type": "field"
},
{
"params": [],
"type": "mean"
}
]
],
"tags": []
}
],
"thresholds": [],
"timeRegions": [],
"title": "Response time",
"tooltip": {
"shared": true,
"sort": 0,
"value_type": "individual"
},
"type": "graph",
"xaxis": {
"mode": "time",
"show": true,
"values": []
},
"yaxes": [
{
"format": "short",
"logBase": 1,
"show": true
},
{
"format": "short",
"logBase": 1,
"show": true
}
],
"yaxis": {
"align": false
}
},
{
"aliasColors": {},
"bars": false,
"dashLength": 10,
"dashes": false,
"datasource": {
"type": "influxdb",
"uid": "000000001"
},
"fill": 1,
"fillGradient": 0,
"gridPos": {
"h": 7,
"w": 12,
"x": 0,
"y": 12
},
"hiddenSeries": false,
"id": 2,
"legend": {
"avg": false,
"current": false,
"max": false,
"min": false,
"show": true,
"total": false,
"values": false
},
"lines": true,
"linewidth": 1,
"nullPointMode": "null",
"options": {
"alertThreshold": true
},
"percentage": false,
"pluginVersion": "9.4.7",
"pointradius": 2,
"points": false,
"renderer": "flot",
"seriesOverrides": [],
"spaceLength": 10,
"stack": false,
"steppedLine": false,
"targets": [
{
"alias": "$tag_hub",
"datasource": {
"type": "influxdb",
"uid": "000000001"
},
"groupBy": [
{
"params": [
"$__interval"
],
"type": "time"
},
{
"params": [
"hub"
],
"type": "tag"
},
{
"params": [
"linear"
],
"type": "fill"
}
],
"measurement": "freeMem",
"orderByTime": "ASC",
"policy": "default",
"refId": "A",
"resultFormat": "time_series",
"select": [
[
{
"params": [
"value"
],
"type": "field"
},
{
"params": [],
"type": "mean"
}
]
],
"tags": []
}
],
"thresholds": [],
"timeRegions": [],
"title": "Hubitat Free Memory",
"tooltip": {
"shared": true,
"sort": 0,
"value_type": "individual"
},
"type": "graph",
"xaxis": {
"mode": "time",
"show": true,
"values": []
},
"yaxes": [
{
"format": "short",
"logBase": 1,
"show": true
},
{
"format": "short",
"logBase": 1,
"show": true
}
],
"yaxis": {
"align": false
}
}
],
"refresh": "",
"revision": 1,
"schemaVersion": 38,
"style": "dark",
"tags": [],
"templating": {
"list": []
},
"time": {
"from": "now-6h",
"to": "now"
},
"timepicker": {},
"timezone": "",
"title": "Hubitat Evolution Stats",
"uid": "kjxWK9-Gz",
"version": 23,
"weekStart": ""
}
This topic was automatically closed 365 days after the last reply. New replies are no longer allowed.

