...and each of these is a simple CRON job, firing (at most) once a minute, and each doing nothing other than turning on a virtual switch on another hub, like this:
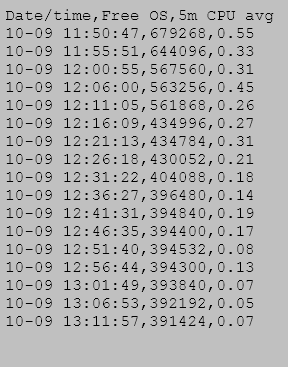
I think the values reported are in KB already so 200,000 = 200 MB.
Does it cause any problems?
Just because the mem goes down does not mean it is a leak, could just be the way the JVM is handling it, causing the cache to constantly increase. If it is all in cache as other things need the mem it will free it back up.
My router will run itself down to 10mb free (with cache to spare) and keep on chugging.
It probably isn't a memory leak but relates to how the memory is handled. Generally speaking java adds objects/data to memory pretty freely then will prune objects out based on a few criteria. A few of those ceiteria are Age and based on need. Generally speaking as long as you are not getting Java Out Of Mem errors it shouldn't be a problem.
The truth is you want as much information in memory as you can keep. The problem happens when you have a sudden large need that exceeds the free memory before garbage collection can free it up.
I know some report that they have issues when the memory geta below a certain point, but there is no consistency in when that point is.
Another thought is based on the graphic above it looks like it is starting to stabilize around 390 based on the data you show above. So at that point it seems that it would decrease allot slower. How long does it take to get to a point were you get the warning for the Low memory and to reboot?
You also mention having jobs run as frequently as every 1 min or 60 seconds, and then these jobs are communicating to a secondary hub via a Virtual device with Hub Mesh right. So there is allot more involved here then simply a cron timer.
So a few questions.
Are these built in Virtual drivers or community coded drivers
Is the remote hub another Hubitat and are you using Hub Mesh.
If the secondary hub is a Hubitat with Hub Mesh why not use the shared device instead of a virtual one.
If it isn't a Hubitat Hub what is the hub you are controlling via the Virtual devices.
Is there a reason you are running the same commands over and over on a schedule instead of letting it be event driven. Hubitat systems tend to run best when driven by events to prevent unneeded actions.
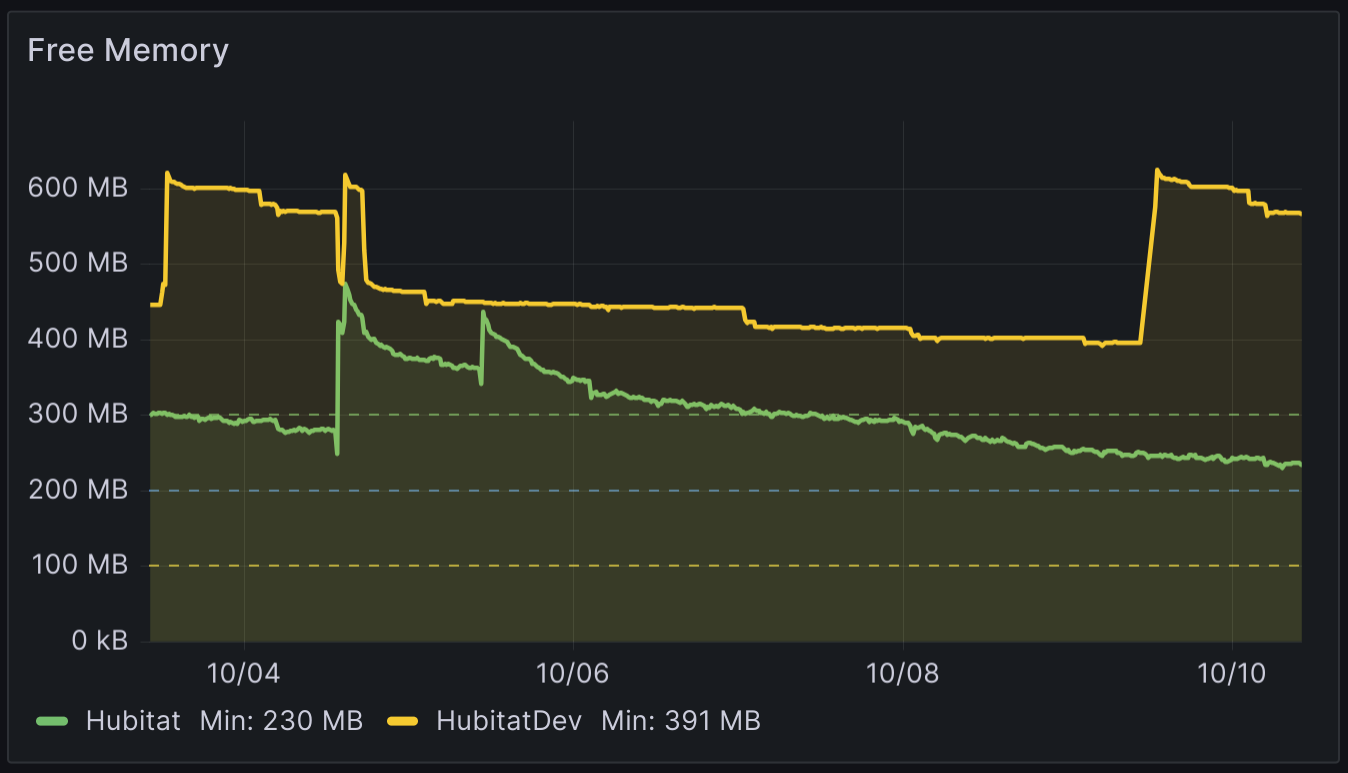
It is possible that because of the frequency of the actions and how java works you are creating allot of unneeded objects in memory. Do you have anything like InfluxDB and Grafana to show how your memory is consumed like the below graph. The green line is my prod hub and it uses memory at a decent rate until it gets fairly stable around 200 MB free.
The CRON is the built-in "Periodic using this Cron string" trigger.
Remote hub (#1) is another C-7, using Hub Mesh.
& 4. The jobs being triggered all relate to Zigbee devices, which are all on the remote hub, as are the Hub Meshed virtual switches that trigger them. (Hub 4 turns on the virtual switches on Hub 1; Hub 1 sees them, does the Zigbee things, and turns the switches off.)
The events are running on a schedule because they're controlling Zigbee RBGW strips that change color on those schedules. There are no "unneeded actions".
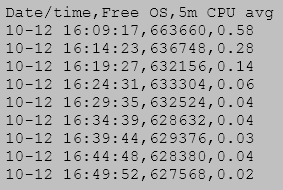
After about 30 hours of runtime, free mem is now 185424; the "low memory" alert on #4 will probably come sometime tonight, within another 6 hours or so.
The thing is it is more likely what the scheduler is running is the problem vs the scheduler itself. That is what I am trying to wrap my head around. There is allot more happening here i suspect.
Like what else is hub#4 actually doing. If it is running hubmesh then it is talking to hub 1 over TCP. Is it Meshed with any other hubs. What is the frequency of all of the scheduled jobs.
You also still didn't answer my question about why not talk directly to the zigbee device instead of over the virtual switch acting as a middle man.
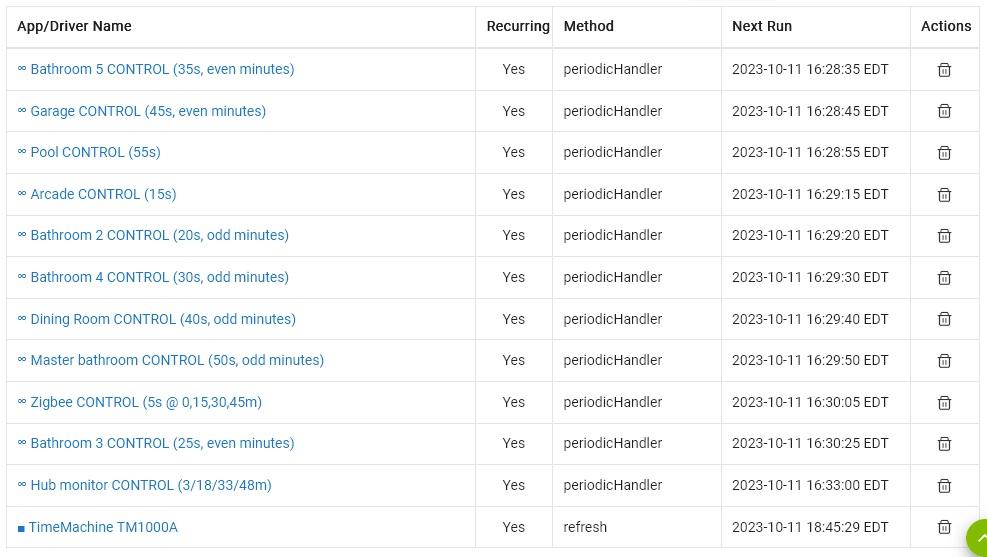
Have you taken the time to graph your cpu/memory usage with something like webcore or Grafana and Influxdb. Also it would be interesting to look at your Apps and Device stats pages and see what you have using up the most of your CPU Time and such. While there it could be good to post your Scheduled jobs page as well. That could provide a good picture to how many scheduled jobs you have lined up and the frequency.
The frequency of each job is in the title; most are either once a minute or once every other minute. For example, the one with "(15s)" in the title is once a minute, 15 seconds past the minute; the one with "(20s, odd minutes)" is once every two minutes, 20 seconds past the minute. The two other ones run once every 15 minutes.
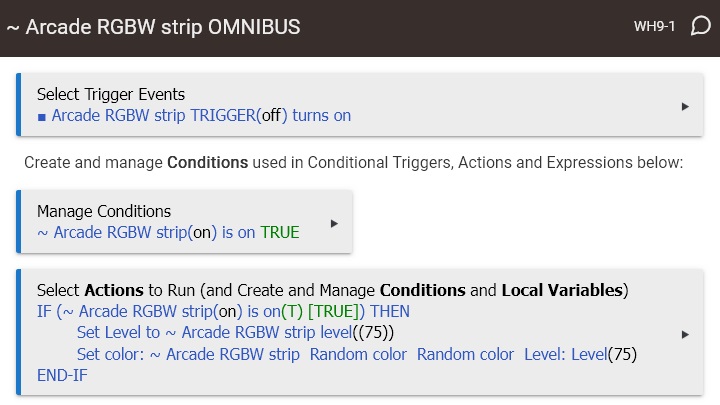
Each device is run by a rule that uses other devices to trigger, and chooses semi-random colors to feed to the device. The devices are all actually attached to Hub 1; I was using the virtual switches to attempt to move some of the workload (the CRON part) to Hub 4 to alleviate "low memory" problems I was having on Hub 1.
The CPU usage for both the devices and apps triggering them is evenly divided and very low - devices are 0.5% of total CPU, apps are 1.2% of total CPU. The problem is memory, not CPU or large state sizes or anything.
I am still more inclined to believe it is something to do with what is running behind the job vs the job schedule method. It seems like there are allot more layers involved. Sorry i am not being more helpful. Maybe @gopher.ny or someone from the support team can look at your hub and see what is cuasing the memory usage.
I suspect there is allot going in the in the background for each of those actions and it is just adding up quickly with the scheduled times of around 1-2 minutes. Hub mesh is involved which means allot of TCP connections are taking place and it sounds like a fair amount of somewhat random changes taking place in the background. Many of those changes may be flying between hubs via hub mesh.
The only thing being echoed back to Hub 4 here would be when the virtual switch auto-offs after 5 seconds; nothing else goes anywhere else over Hub Mesh.
Have you done a soft rest on hub 4 recently. I know it doesn't sounds like it should help, but i have seen a soft reset fix memory loss issues even on my own gear. I think for some reason i had in my head that the zigbee devices as well as the virtual switches were being shared by hubmesh. If they are not then the only traffic from hub 4 is the on command for x devices every min+x or so. Something is surely off if you are dropping down real low around 30 hours.