If you want to reboot your hub (C7) on a daily basis, is there a command in Rule Machine or do you need to do it with a post command?
Does anyone have a rule which takes a backup, turns off the radios and shuts down for a period and then restarts? If I really have to kill power I guess I can reuse my ST hub for it. My zwave devices are now taking minutes to respond so I switched the critical ones to wemos and will try rebooting consistently to try and get the others back on track.
The better solution is to track down what is causing the issues rather than masking it with reboots. Perhaps post some screenshots of your: settings zwave devices list, logs, and application/device stats. I haven't needed to reboot once with .148.
I completely agree with @lewis.heidrick. You should do what you can to track down the root cause of the issue. However I also believe in answering the asked question. Right or wrong you did ask.
Post command. When needed I use this commend to reboot the hub.
Appreciate this. Understand chasing down the root cause and I have reduced my footprint in order to do so but the performance is getting pretty frustrating and if this keeps it within tolerance it’s a reasonable stopgap.
I don’t see a lot of talk about Wemo or Liftx devices on here and the drivers seem to do a lot of polling or at least more intensively than I did for my zwave devices before I eliminated them. That said they work better/faster than my zwaveplus devices so I’m adding there as opposed to reducing.
Mainly just the speed of zwaveplus devices when in a group. The rule/button/any group action takes a long time to fully act. The wemos within that rule happen fast and the zwaveplus devices slowly react.
I mainly see it in the backyard where it’s turning on or off about six devices. I have switched them all from zwave to zwave plus and added a number (4) repeaters. I live in the Bay Area so it should be way, way, overkill.
The wemo in this set turns on and off fast. I switched out one of the zwaveplus that was driving me nuts for another wemo and now both of these are super quick while the rest of the zwaveplus devices slowly turn on and off. Can take up to two minutes plus to fully complete.
Turning the devices 1by1 are quick/responsive. Resetting the hub seems to make it quick again but I have been trying just work on other things and ignore this for a bit.
Properly performing mesh should trigger lights on or off in less than a second. There's obviously something going on there. My goodnight routine shuts down everything in less than a minute and that's with pauses baked into the rule. I have about 150 zwave devices, 40 or so Zigbee devices and another 100 or so sensors or virtual devices.
Yeah I’m a big fan of watching and reading about what you have done. I’m struggling on the debug here.
Yeah I’ve now switched to doing individual repairs as opposed to an overall repair. That seemed to at least clear the routes on the zwave page which were then filled in later with ones that look believable. I’m sure people were exhausted with me complaining about that page and the routes it was showing. Doing individual repairs and seeing the eventual update at least made me feel like something was improving...
I made a couple of what I hope were helpful tweaks over the weekend, doing repairs now and will let things sit for another week to see if the routes and speed improve. Everything works fast except my zwave network (zigbee, wemo, Sonos and LIFX) and are using the same automations sometimes so I’m really trying to narrow down why it specifically has a problem. It’s not as big as many of you on here which I thought pointed to a weak mesh issue but they are almost all plugged in devices now, a small area and they eventually work, so now I’m suspecting something else.
Everyone always says you should chase down the culprit causing the hubs to slow down, but there are no good ways to go about this. No utility to show current load, or over time... nothing. I spent countless hours with Support previously trying to figure that stuff out, and it was a bit frustrating to not really come away with a solid answer. My solution was to buy a second hub, and ultimately still have to reboot every few days. I put up with it because I don't want a cloud-based solution.
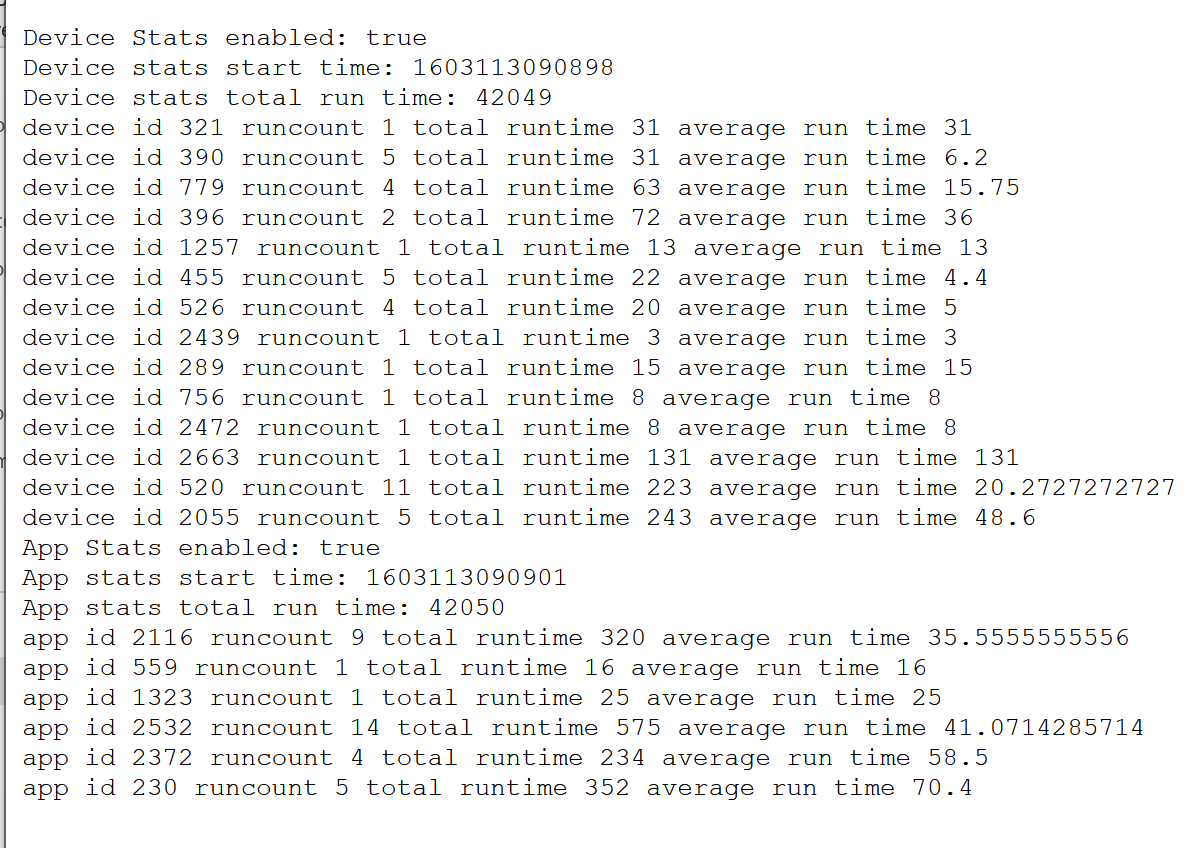
Run the enableStats link and let it run for about 5 minutes. Then run the stats link and take a screenshot. Run the disableStats when you're done. Post the results and let's see if there's something that stands out.
Problem devices or apps average run time typically look like my app id 1065 but this one actually is a web app and not local so this is typical for this one.
Another issue you might see is a high runcount. Something that is looping a lot can cause issues.
I end up rebooting both hubs about 3 times a week, yes. This metrics URL is very interesting... I wonder if there's some way we can scrub/store this into something that can give us visual representation over time. hmmm
I'm sure you could since its basically just a webpage. Running stat collection continuously isn't recommended though since this isn't a published feature and wouldn't be supported if you ran into issues because of it.
What apps or devices are common between the two? There any custom drivers being used?
If you find that you are experiencing slowdowns, I also recommend looking at your free memory over time.
The following is from the Hubitat support staff
This release brings us a couple of new URLs I'd like to throw out there. /hub/advanced/freeOSMemory return free OS memory, in K, just like free command that it runs /hub/advanced/freeOSMemoryStatus returns a GREEN/ORANGE/RED status. I've picked arbitrary numbers of 120000 for ORANGE and 50000 for RED, but that's just something to start with.
I suggest running the first option at multiple points to see if your memory is low,
Oh yes, definitely some custom drivers. IOTaWatt, hubduino, tons of hubconnect v2 RC2 drivers, iphone wifi presence sensors, you name it. Things to make the system useful. There are more 'experimental' drivers/apps on my no-radio hub, but out of necessity, I also have custom drivers for actual radio-based devices on my secondary hub. Many of the stock drivers are missing important features, or are just less-reliable than the custom stuff found buried in the forums.
My complaint has never been that that the hubs should be rock-solid with custom stuff, but simply that it's damn near impossible to self-diagnose the problems without any tools to track down the culprits. Would be amazing to see load per RM rule, overall load, memory, etc. Real-time health, essentially. It's nice to see these undocumented suggestions here, which might help me out over time.
I use things like device watchdog to let me know when it's time to reboot, but sometimes that doesn't catch it, and I still find out due to delayed actions for lighting, guest motion notification, etc. I always laugh when I get notified I have a guest like 5 seconds after they knock, when it took them 30 seconds to make it up my driveway. Just shake my head and smile -- oh well! haha
One thing I can say for sure is that my C4 (experimental) responds MUCH slower to UI navigation than my C5 (radio/more-pure.) The difference is staggering. Like 5-10 seconds to get my device/apps to display on C4, where C5 is almost instant.