This issue has absolutely been acknowledged, and more than once. Most recently when I challenged Bruce... This is an important distinction.
I have provided a bit of data over the past few weeks.. I've been through this cycle before with the Hubitat team over Zigbee issues. It took a while to track down, and a couple test builds to verify a fix... But they eventually tracked it down and fixed it.
I was just one lone voice on that issue, and they listened and reacted... There's a whole chorus of diverse people reporting the slowdowns, including myself. It will get fixed, that much I am confident of.
I don’t have a C5 and this problem has existed since I bought the thing. Over a year of this problem has eroded the confidence and patience I had, like yours.
The problems have multiplied. Drivers worsened. Performance worsened. And yet the focus is new features and devices. It’s well past time to halt all else and focus on this problem. If that doesn’t happen, I’m done.
I really appreciate your sticking with this issue. Getting feedback and data from someone with your skilset is really vital for @bravenel and the others who are debugging this.
By profession, I'm a scientist. The toughest part of my job is sifting datasets to separate the wheat from the chaff. And in this situation, given their current resources vis-a-vis personel, I think that Hubitat needs high quality data; they're far more likely to get that from folks like you and @doug and @dan.t than the likes of me.
Hey Doug, how many hubs you have and what version? I think you have c4, but just one? If yes, maybe you have one of those hubs they had an issue, I remember in this forum it was discussed, some hubs came with something wrong, if I remember correctly, they used half of the processing power or something like that.
One of my hubs was a nightmare, I replaced it with my "developer hub" and problem solved, then one day I decided to use that hub again and it was dead, it was still under warranty so it was replaced. Just saying, I know you are frustrated and maybe restoring the database in another hub is the solution.
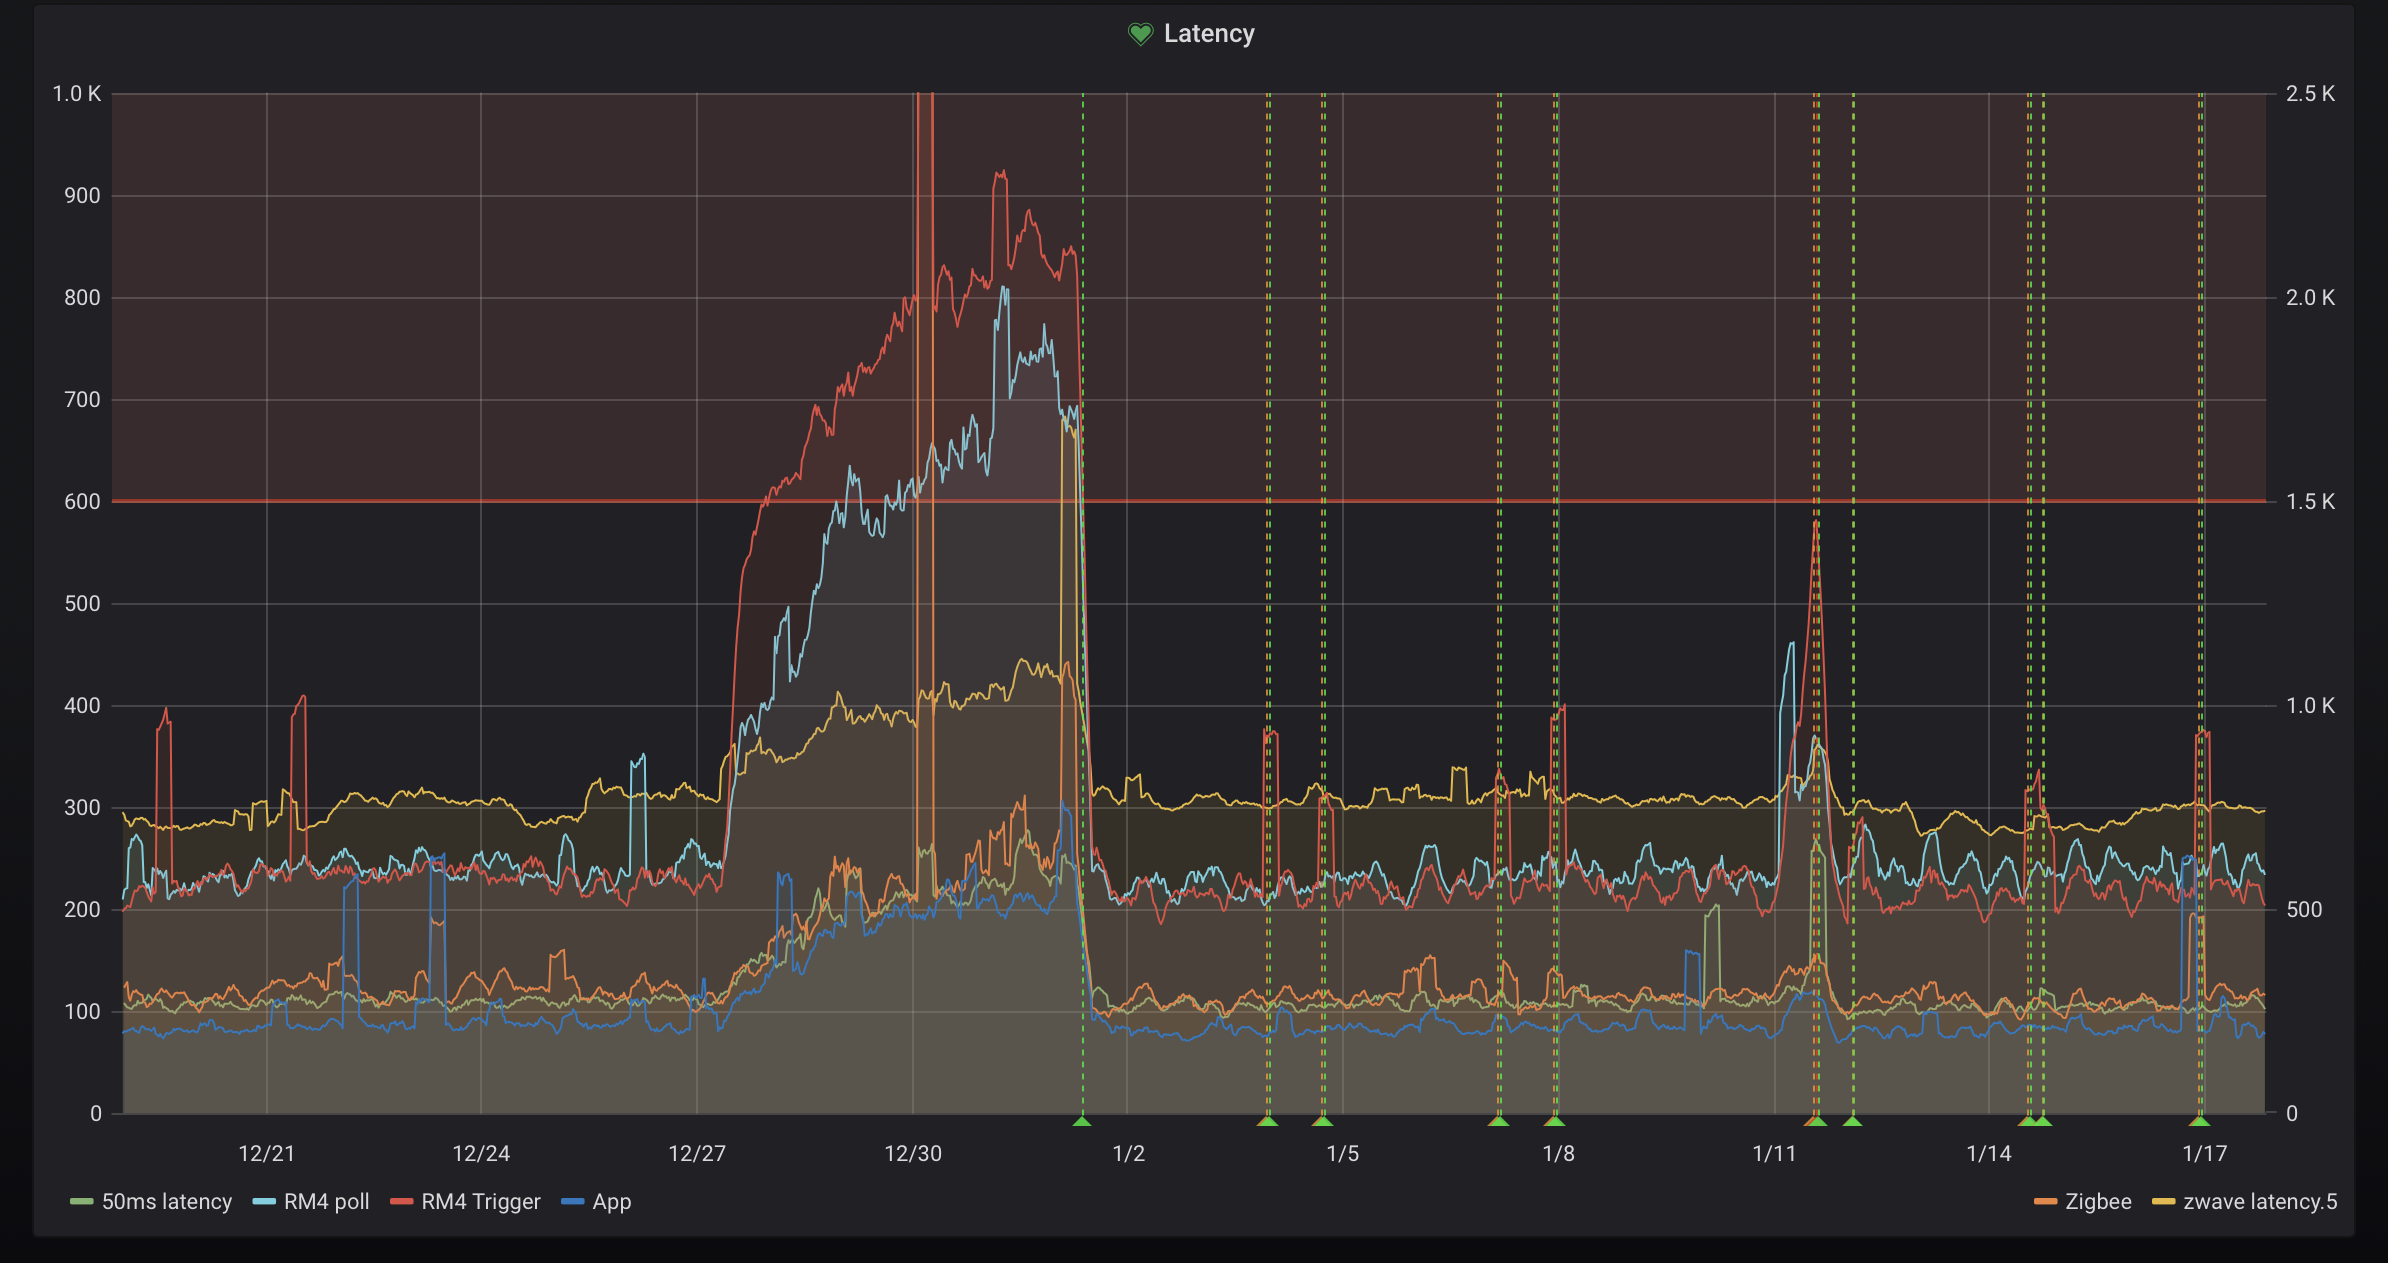
I'm convinced there's a resource leak of some kind, it's systemic. I left it go unchecked after Christmas and it was interesting to see how it went.
I find the "signature" of the even most interesting. I see a very rapid, almost step, in latency over a few hours, then it flattens to a gradual never ending climb. Would love to know what's going wrong, maybe something running away in the JVM? not my system,
If I had two cents, I'd bet on a DB situation - cleaning its self up after deletes or something like that. Add in some JVM garbage collection pressure and things could crawl - especially if the IO is slow.
This is the problem with JVM, right? It's all do it yourself. If someone doesn't know how to GC, it become a meltdown very quickly. This is why I don't understand why people continue to platform on Java!? Everytime you do a thing, it's do it from scratch. Nonsense in today's RAD world.
Not in my opinion. I don't know which DB they are using or what it's edge cases are. GC pressure can exacerbates problems - it doesn't necessarily create the problem. For an $80 box it makes sense to do just what we have. I don't know why people expect so much from so little, but they do.
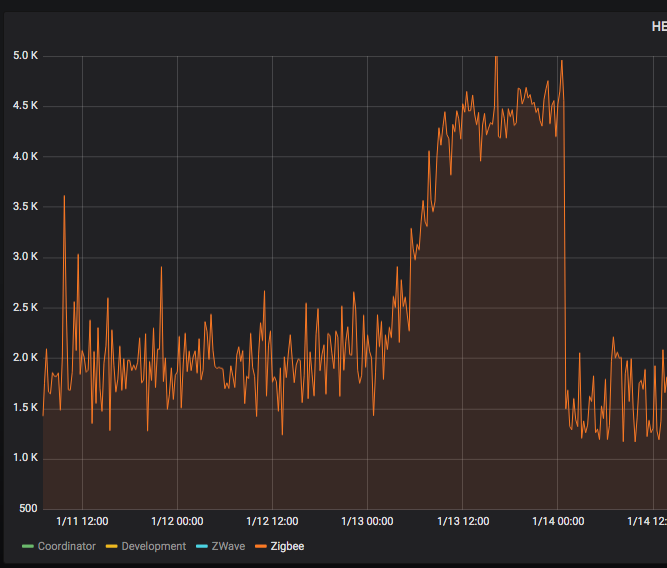
What is the start time for your inital climb? Mine is around the start of the backup.
Here is my very far fetched theory:
There is somewhere an issue with closing file handles. Under a Linux OS, there is a hard and a soft number of open file handles per process. Some of it is configurable (limits.conf) some of it is not. My assumption is that this get's exhausted one way or another. Sometimes faster, sometimes slower. When it starts to reach the upper levels, the connections to the database get affected, which results in slower returns to database queries or not getting any response and you see these weird SQL errors in the logs.
Here is why this is my theory:
I have seen similar behaviors even with large scale Oracle databases. A simple missed stepped during the setup (adjusting the limits.conf) and a wrongly configured maximum open handles for the DB itself caused similar issues.
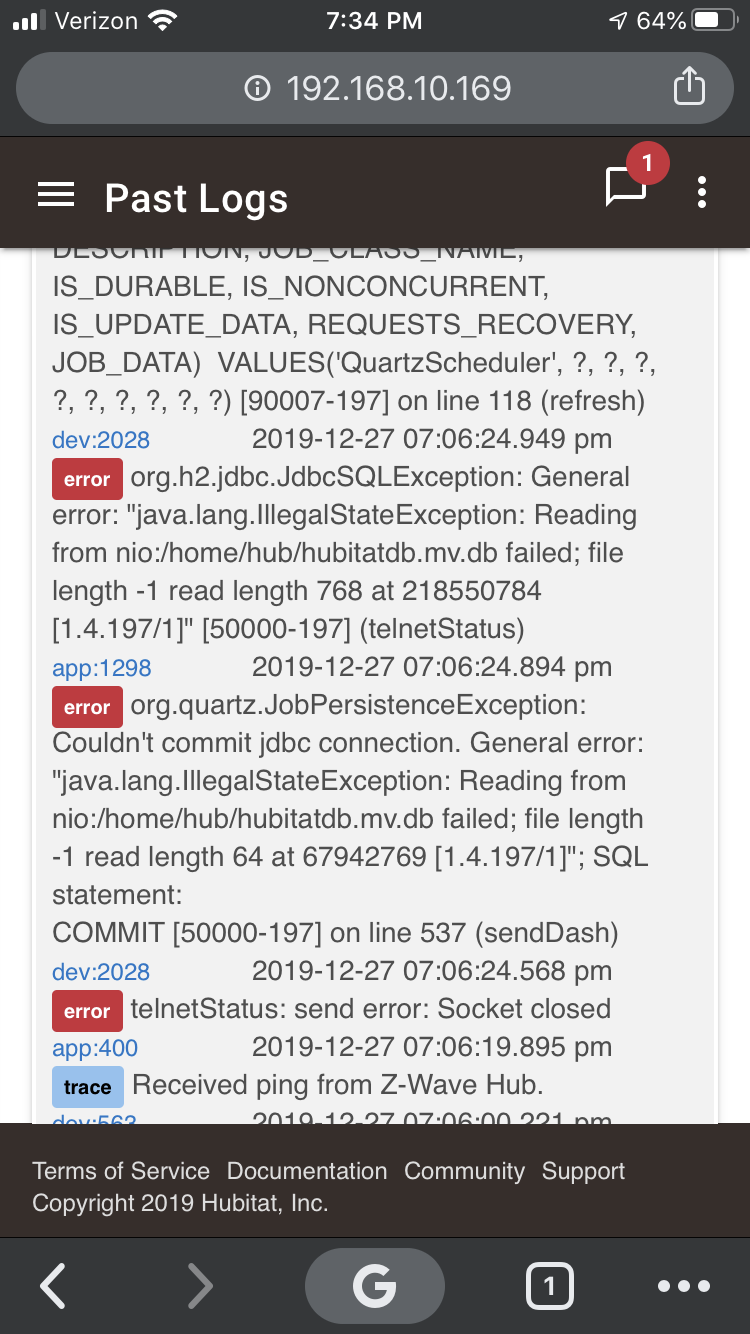
When I was troubleshooting a NUT UPS driver issue, I got the following error messages in the logs:
You can see in this log that the hub had issues reading from the database, a telnet connection socket was closed and that was followed by multiple SQL errors in the logs (not shown here as this screenshot was taken on a phone). The hub was slow as hell and became unusable at that time.
Most people would have pointed to a "corrupt database" at this point. But the database was absolute fine. It had nothing to do with it. There was a custom driver that continuously opened a new telnet connection without closing the original one correctly. In the end, there were probably so many open handles that it affected the overall hub.
We have to keep in mind that every file request, HTTP request, telnet request, etc. all count towards this handle count.... The more busy the hub, the more likely it is to reach that at some point. My theory is that there are other components that might not be cleaned up 100% after usage and then at some point affect the system usage. We see this then quickly rise during a DB backup as a DB backup will open up a good amount of resources (from an OS perspective). It probably is not the DB backup in itself, that is just the tipping point.
For the avoidance of doubt: This is MY theory, I do not say that the Hubitat team has to jump on this one way or another as I cannot prove any of this. MY theory is purely build based on professional experience and consequential observations that I made while running my Hubitat systems.
Just adding to potential things to check. After switching to the native dashboards (v2.1.7) I was experiencing horrible hub performance 24/7. After experimenting and working with support I believe there is a bug with the dashboard leaking memory if you enable all devices to a dashboard. I had 6 dashboard showing different states like battery percentage for 70+devices, dashboards with erroneous or non-existing devices. After cleaning all that up I don’t have the reliability and lagging issues anymore. Just wanted to share.
Dashboards are slooooow when all devices are enabled. I definitely do not do that. I do have dashboards on both systems. Maybe I’ll disable those for a bit and see what happens. You never know
Not that I understand this very well - but, if I understand you correctly, there doesn't have to be a single common contributory cause that results in the problem.
And that resolution of the issue would require:
Ensuring that file handles are opened and closed properly.
Increasing the hard and/or soft limits for the total number of open file handles.
If Hubitat has access to the underlying Linux OS, could they use a tool as simple as lsof to identify offending processes?
That is correct, and there are tools like lsof. but, to make matters worse, the OS provides you information on which process uses what amount of resources, however, you would only see that the JVM uses them. You still don't know what within the JVM does it. That is why it is often so hard to find these things, especially in systems that have a multitude of inputs and outputs...
EDIT: Remember that Bruce always says that it wouldn't make sense to show the CPU load or the memory footprint. That is exactly why, you would only see that the JVM uses that much of the CPU and memory, but not what driver/app within the JVM...
That pretty much just "delays" the "when" but doesn't solve the problem. I would not change it unless you are talking about "huge" databases, like in the TB or bigger range
Interesting....never thoughts about an fd leak. I've given up getting more information, I have a ton of stats coming up for even sources, frequencies, etc and non feel correlated. Your logs are the most interesting, but I'm not sure I see those. To be honest a notification and reboot every 2 weeks doesn't bother me a ton, it's lame but shrug.
The hubitat guys seem pretty good, so I assume if it was straight forward they would have fixed it a while ago. I assume they can repro it, or would have ssh'ed into a system exhibiting the problem or ask to do so. So I'd have to assume it's a bit sneaky, in the bowels of the JVM, a 3rd party driver, bsp issue, or de-prioritized.
As you point out the read errors with a file length of "-1" imply it didn't open the file, or it doesn't exist. It's also interesting to see the DB in use which is H2, which makes sense given it's a java system. Since it's an embedded Linux system I'd jumped to the conclusion they would have surely gone with SQLite due to it's robustness in harsh environments, but shrug.
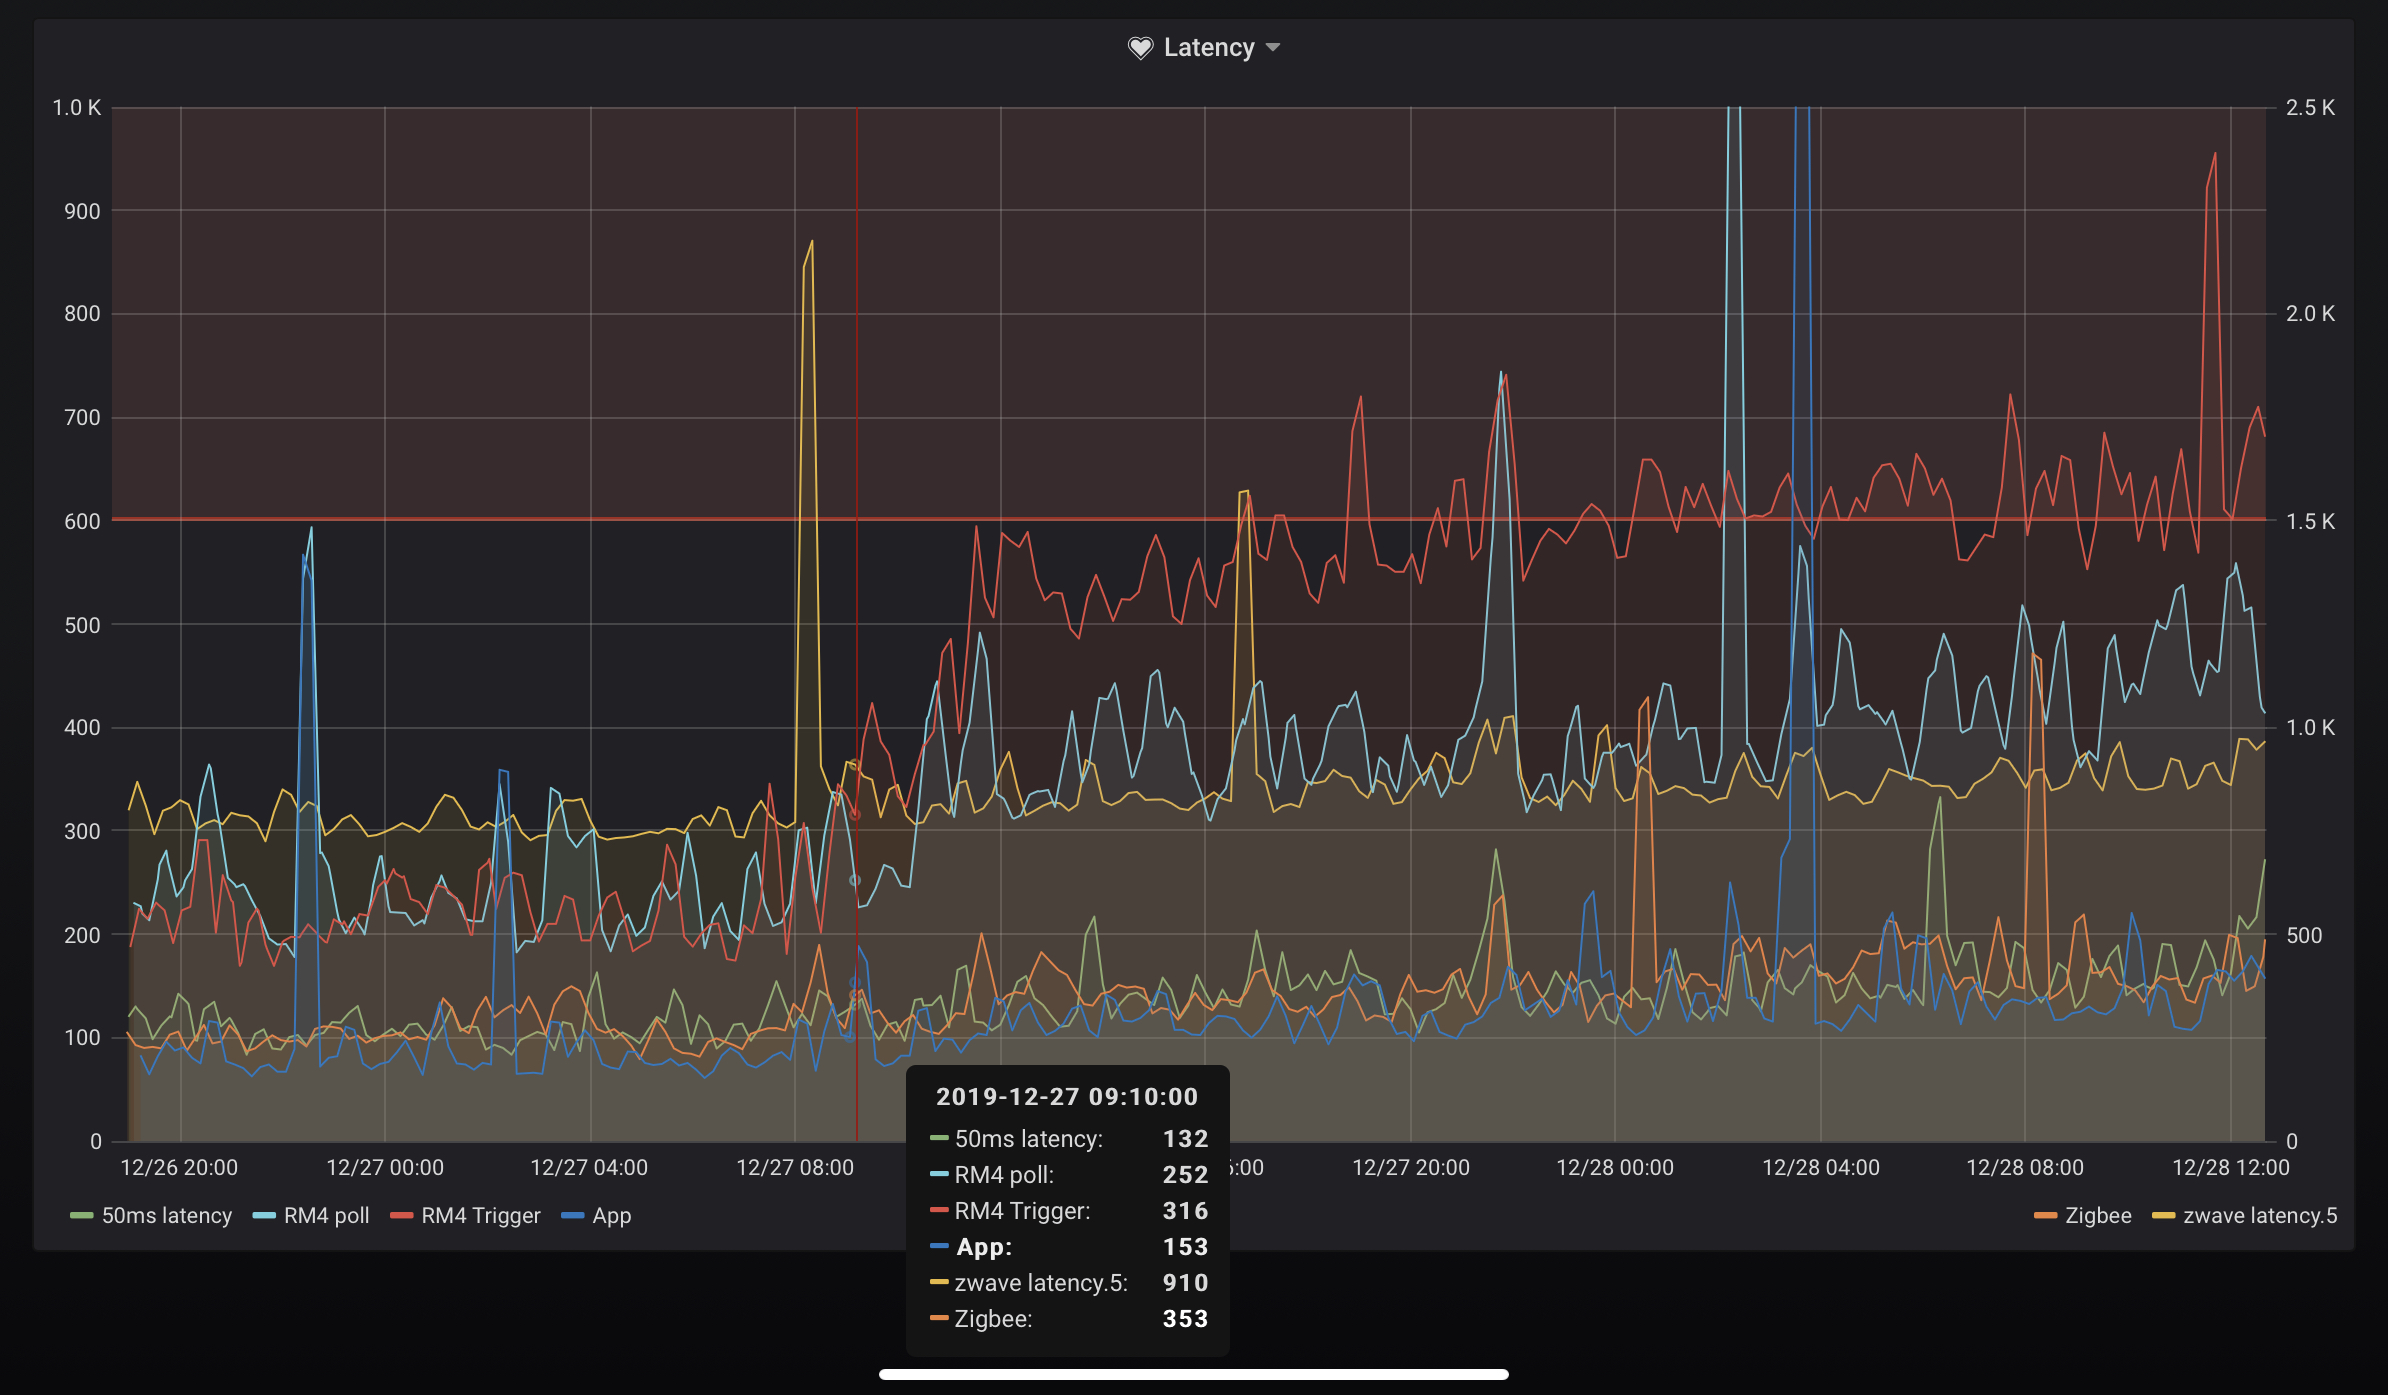
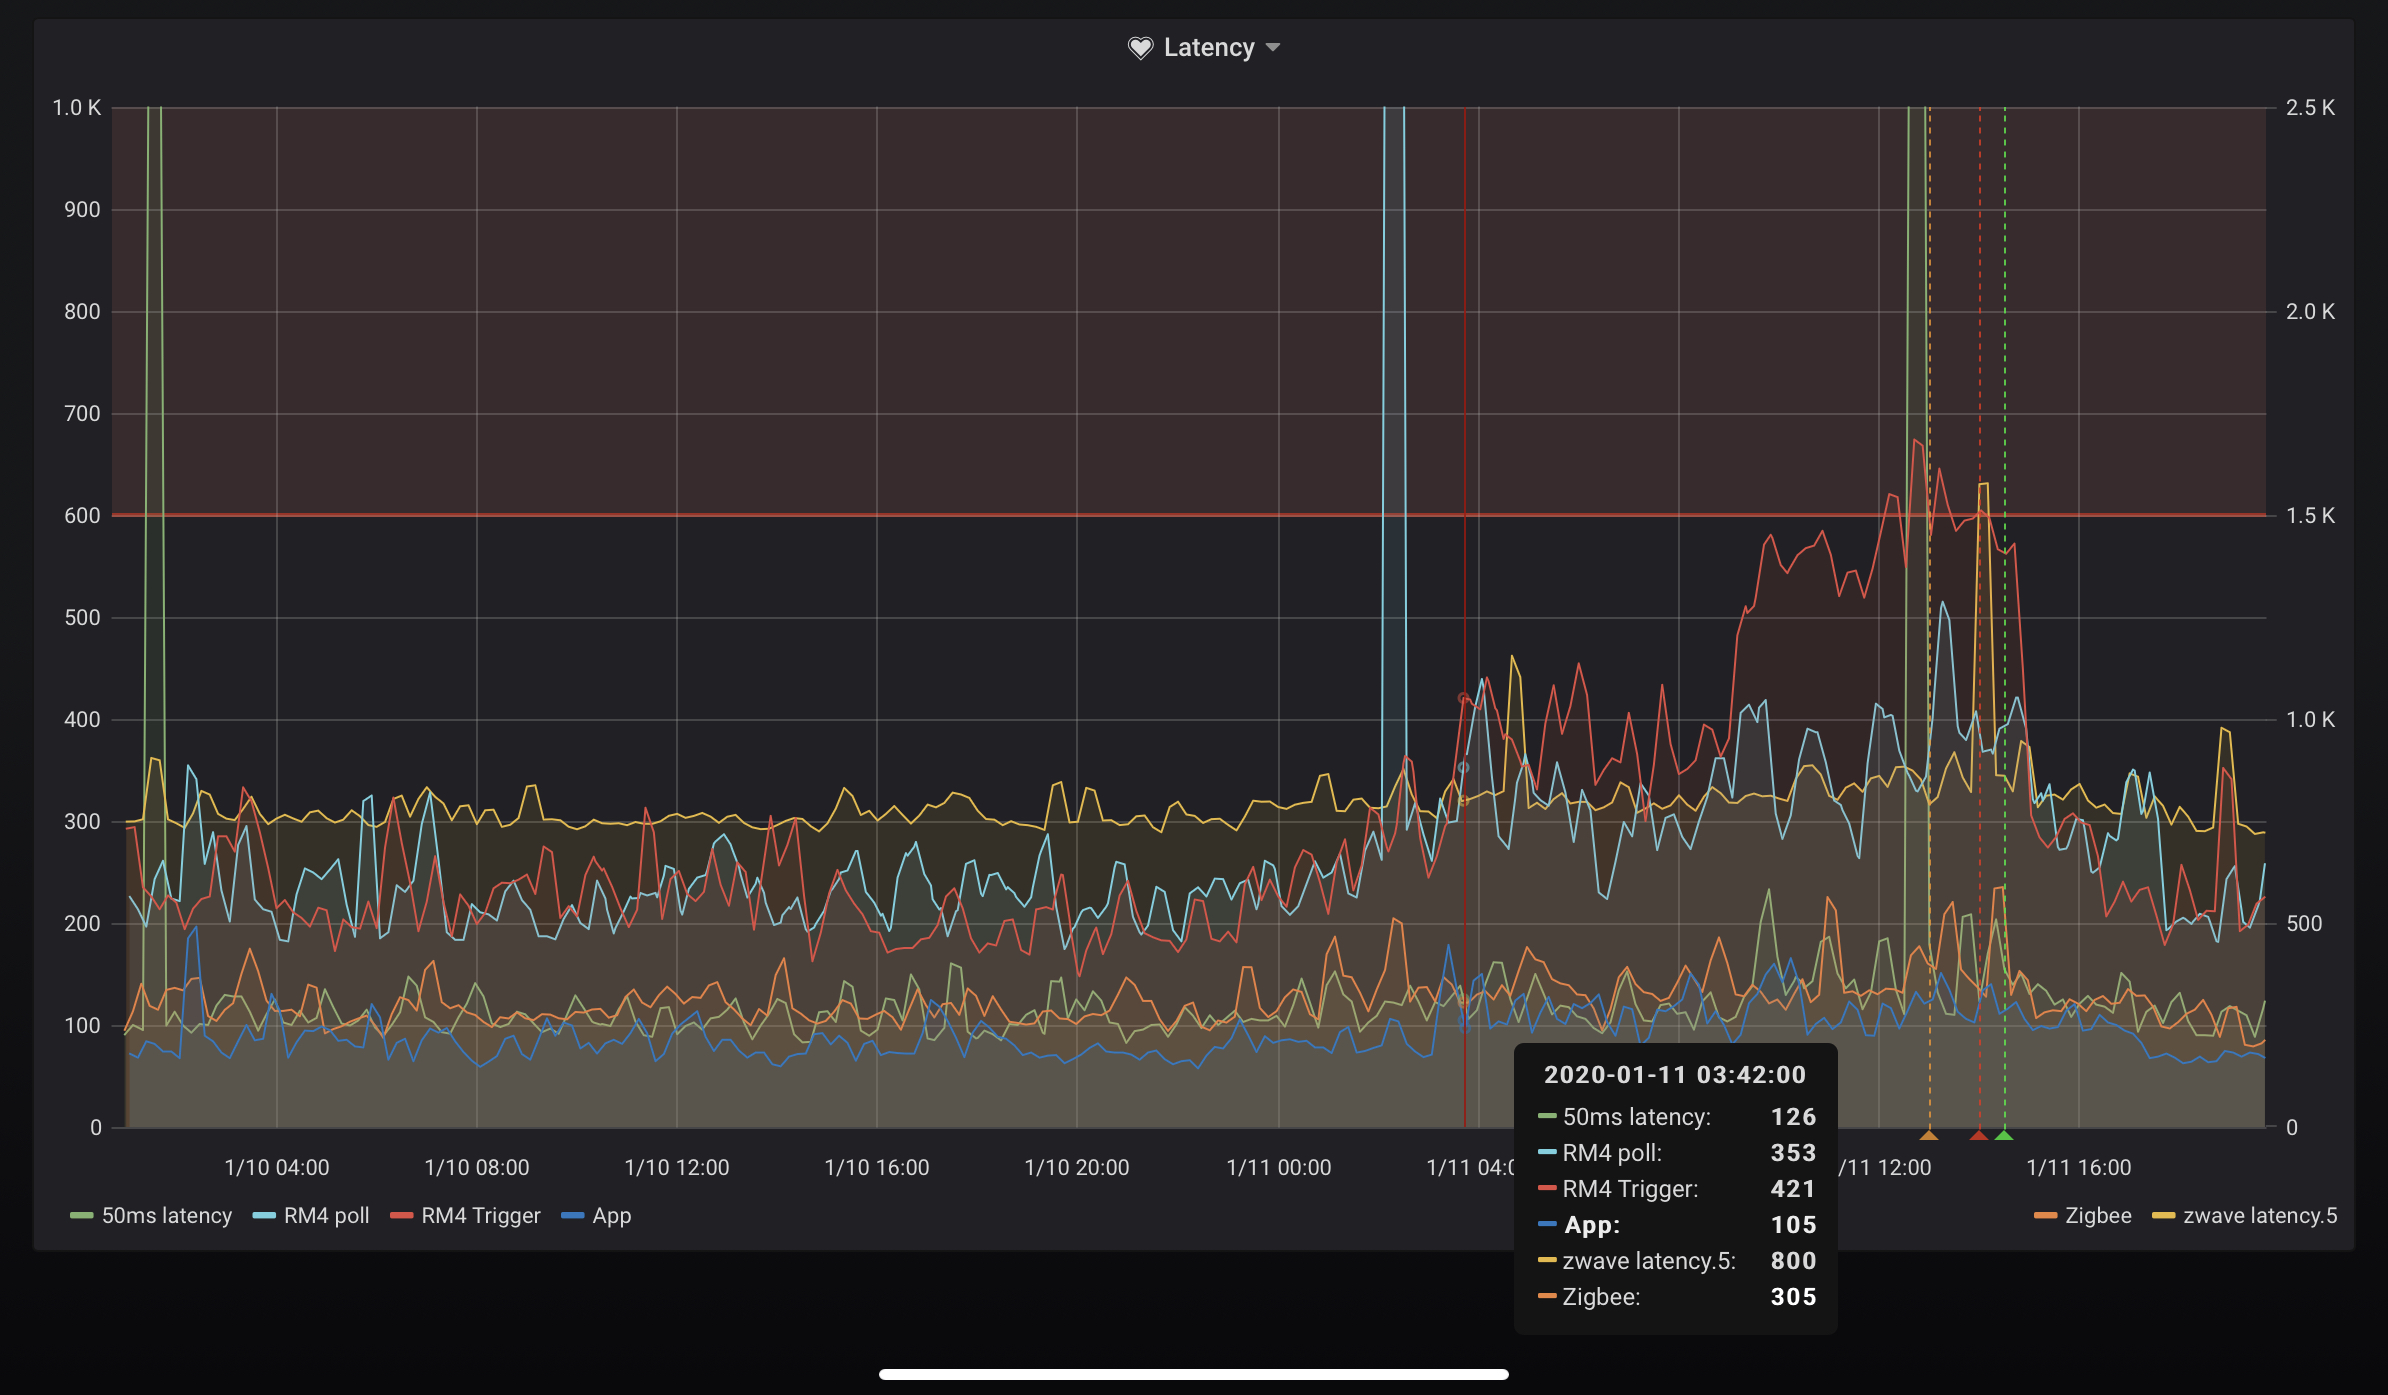
Here's a zoom in the last 2 events, 2nd seems to start around 3am, but I haven't found this to be typical, and maybe it's acutally at 8pm the day before if you look at the RM4 latencies? Sadly the rise is quick on a monthly scale it pretty smooth/slow on an hourly scale. it's just odd that it flattens out. Anyways:
I've been told they can't repro it, that's what support says at least. Thus the WoMM comment I made earlier. I believe they would've fixed it a while ago, if they were focused on that instead of rewriting of RM for the 4th time and such.
That is what solved most of "my" hub slowdowns was removing ALL Rule Machine 4 rules and going back to Rule Machine 3 rules. As I've noticed since the introduction of RM4 back in July after then is when these issues began showing up more frequently. But being blamed on "user apps"
Oh and also eliminating Alexa, Google Home, IFTTT, and Chromecast (which has had issues for months on end with no hotfix)
And yet it does. Java has mechanisms that consume memory outside the (traditional) heap, and it can be done fairly readily (either directly using sun.misc.Unsafe, or jdk.internal.misc.Unsafe, or indirectly - say by mis-handling GZIP, Zip, Deflater, Inflater Input|Output Streams - as in a webserver) or by using dynamic class loading (as scripting engines like Groovy do)
These all show as native memory leaks, ones that'll only really be seen on the host OS, and will eventually cause the machine to come to a grind and require reboot/restart. A health checker on the box itself can detect this before it's too late, and forceably restart the bits (as a work-around) and can consider other resources, like fd's, CLOSE_WAIT's etc, etc.) - I suspect they already do this, most controllers do.
Apart from that, with access to the box, using relatively newer JVM's, you'd use JFR to see what's running in addition to more traditional tools (like heap-dumps, etc) or something even more exotic like eBPF to backtrace which part of the code is leaking file-handles.
Alternatively, the could write something to capture/sample the JFR's and ship them back to Hubitat's team (via opt-in). With enough of them, they could work out what's going wrong.
It'd be interesting to know what they actually do.
I full heartily agree with you. We just need to keep in mind the main audience of the product. I’d bet it will be hard to find many active community users that would actually understand the output of such tools. As for SSH access, sure I would love it, just for my own curiosity, but I am with Hubitat on not allowing it. In my opinion, that will just open up Pandora’s box.
I have an active workaround in place (scheduled reboots + active push notification by my monitoring system) and so far my WAF has not been impacted by it.
Sure, but there are ways to leverage the more active/technical members of the community who do know all about this stuff. For all the issues with Vera, there are a bunch who used that inside knowledge to help their team improve it.