Try to use the latest version of HPM. I added the following note in the original post:
Use at least version 1.9.2 of Hubitat Package Manager (HPM) to install the app. Older versions sometimes fail to correctly add the zigbee-map.html file in the File Manager.
Use "Esc" keyboard key to toggle the controls - @jshimota
Changed
Hide back "duplex" links by default to better see the link colors
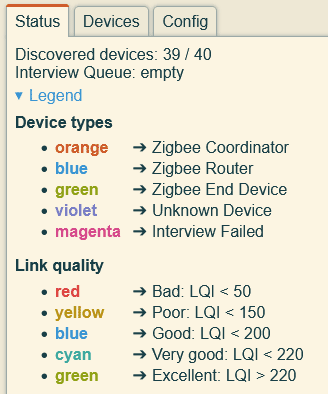
Note: I am willing to change the link color thresholds as I don't understand what LQA/LQI really mean (I know higher is better ). You can find the current color thresholds if you expand the "Legend" section.
in my case i cant really say how the color links are usefull i have a large mesh and some outdoor lights. as far as i can tell they CAN reach/ie are neighbors of other devices but obviously with a low lqi.. so that device would not be used as a route because of the low lqi.
just the fact that it can reach the other devices although crappilly.. i am not sure is that usefull?
i am thinking maybe only change or show the colors in conjunction with actual used routes.. but i am not sure you can get routing info from most devices (ie only the first level routing info from the hub)?
Similarly, I have a lot of red on my map, but my Zigbee network is pretty darn solid, so I'm not sure it's all that helpful, even if it is a nice LQI visualization.
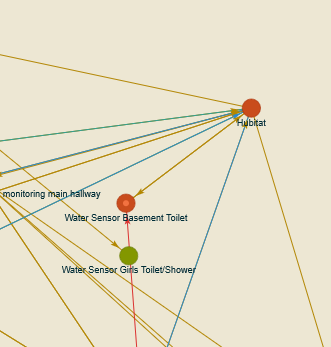
On a completely different note, I'm still baffled at how 1 out of 10 of the exact same water sensor with the exact same driver are showing up as a coordinator when the other 9 are showing up as normal nodes:
Another great update. I feel greedy for saying this (and I'm not even sure if 'inCost/outCost' numbers are exposed via router interviews as they are in getChildandRouteInfo for the hub), but if so they'd be even more informative than LQI.
Reason being is that Zigbee spec (surprisingly) doesn't specify or standardize how LQI is computed by any given hardware implementation... it's left up to each manufacturer to come up with a number (0-255) intended to correlate with RF reception. Spec calls for the LQI to be mapped into a 3-bit link cost number which actually gets used to assign routing preferences where multiple paths are available (that 3-bit cost also gets sent to the 'far end' device during link status intervals to gauge bi-di link quality).
There's a good reason for this level of indirection; it allowed for improvements in determining link quality as technology matured without re-writing the spec. Early methods of LQI determination were simple measures of raw RF energy in the band of the Zigbee channel-- including noise and WiFI interference; later more sophisticated methods take into account actual link error rates and retransmissions to come up with a more meaningful measure.
Anyway ,the implication of this is that comparisons of LQI between devices with different hardware implementations aren't always meaningful (and probably always show 'good or great' LQI numbers). Best example I can think if is that C-3 thru C-7's LQIs which are almost always high (and much less 'spread out') than the C-8's... they're less useful in discriminating between links with good vs. marginal quality.
The quality values are very interesting, thanks for adding that.
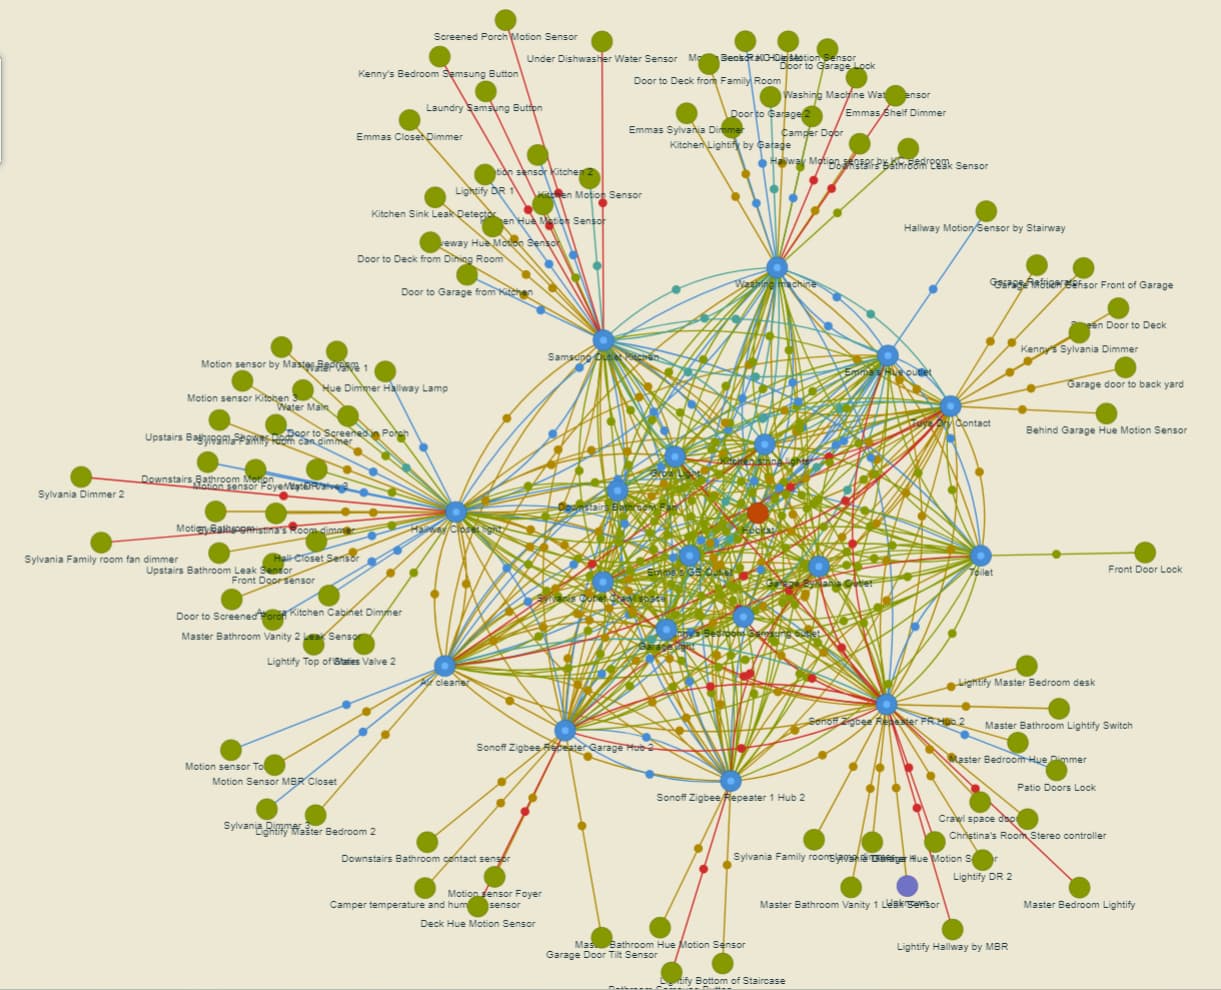
In my case the only links with "excellent" quality are those from the Hubitat itself. Some of those links are also over long distances.
Some rooms have closely spaced Zigbee items but link quality between them low.
In general, link quality from my Ikea repeaters seems low.
I'm sure each device has it's own quirks.
That said... My network has been working fine so the mesh is doing its job. Like you said, the true meaning of the quality values is not clear yet but it will be fun to figure out.
Super grateful and happy! a most excellent and useful tool! thank you @dandanache!
as an aside - I use XCTU as a sniffer and LQI monitor - along with another Digi tool called Assistant. I tried for a long time to get a 2d layout, then locate the devices - but since the tool is external to the HE, device names weren't available and no matter what I tried I couldn't write into the data table so I gave up.
This tool lets me have a useful map with names solving an old 'Want' of mine. Again. Thanks!
I'll add an config option to disable link colors in the next release. It does look like a Christmas tree the way it is right now.
LOL
I have no idea why this happens. It's also weird that there are 2 arrows pointing to it (it was reported as neighbor/child by these 2 devices). What is the device that points to it with the red upward-going arrow? Since it is a battery-powered device, only it's parent should report it (just 1 arrow). Can you power-cycle the sensor (remove and reinsert battery)? This way we force it to talk to its parent (either the Hubitat hub or the other device).
The inCost/outCost numbers are reported in the Routing Table Response (0x8032). I can retrieve the data from there using the same mechanism, but I believe that reconciling the Neighbors Table / Child Table + Routing Table will probably be a mess.
It might also be fun to create a new Zigbee Map using only data from the Routing Tables of all devices.
Also thank you for the details about LQI, I learned something today.
Seems like Hubitat always reports "excellent" quality. I guess it makes sense since it is the most expensive device in your Zigbee network
Feels good to scratch that itch, right? You're most welcome!
I thought the same thing, but couldn't bring myself to post it. I do still find this useful since I have moved some of my repeaters and can now see which end devices might need to be encouraged to find a new parent.
I also noticed that many of my "red" lines are to end devices reporting an lqi of 0. Some of them are very very close to their parent and I can only assume that the 0 means that they haven't reported. Any thoughts on this?
After activating the devices, the lqi reported is a non zero number (255 on some of the very close ones).
Another thought down the infinite rabbit hole that is this wonderful app : this begs for a config slider to filter out lower-quality links, decluttering the map and allowing one to focus on the "important" connections
Interesting.. I know that in the context of the ''every 15 sec" link status reports between routers, cost=0 would indeed mean 'no status provided' for a certain number of intervals, but I'm not really sure how/if that relates to zero LQI from an end device. I assume it would only be reported at the device's check-in intervals (which usually are usually minutes, not seconds and can vary by device).
I'll have to observe my mesh with the new version of the app and see how mine behave..
Released version 1.5.0 with the following changes:
Added
Add config option to show/hide link colors
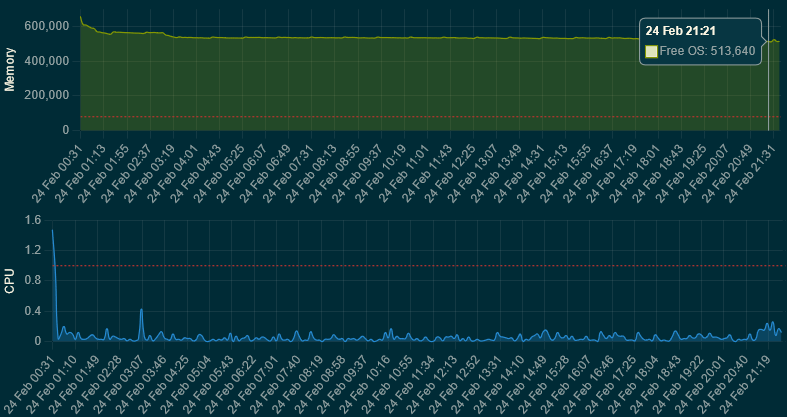
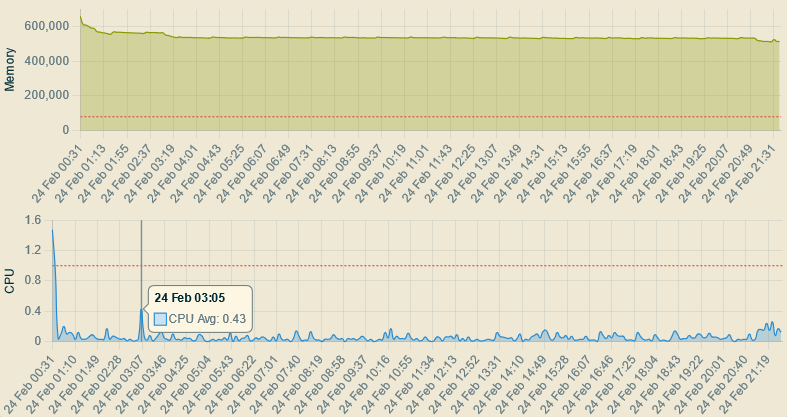
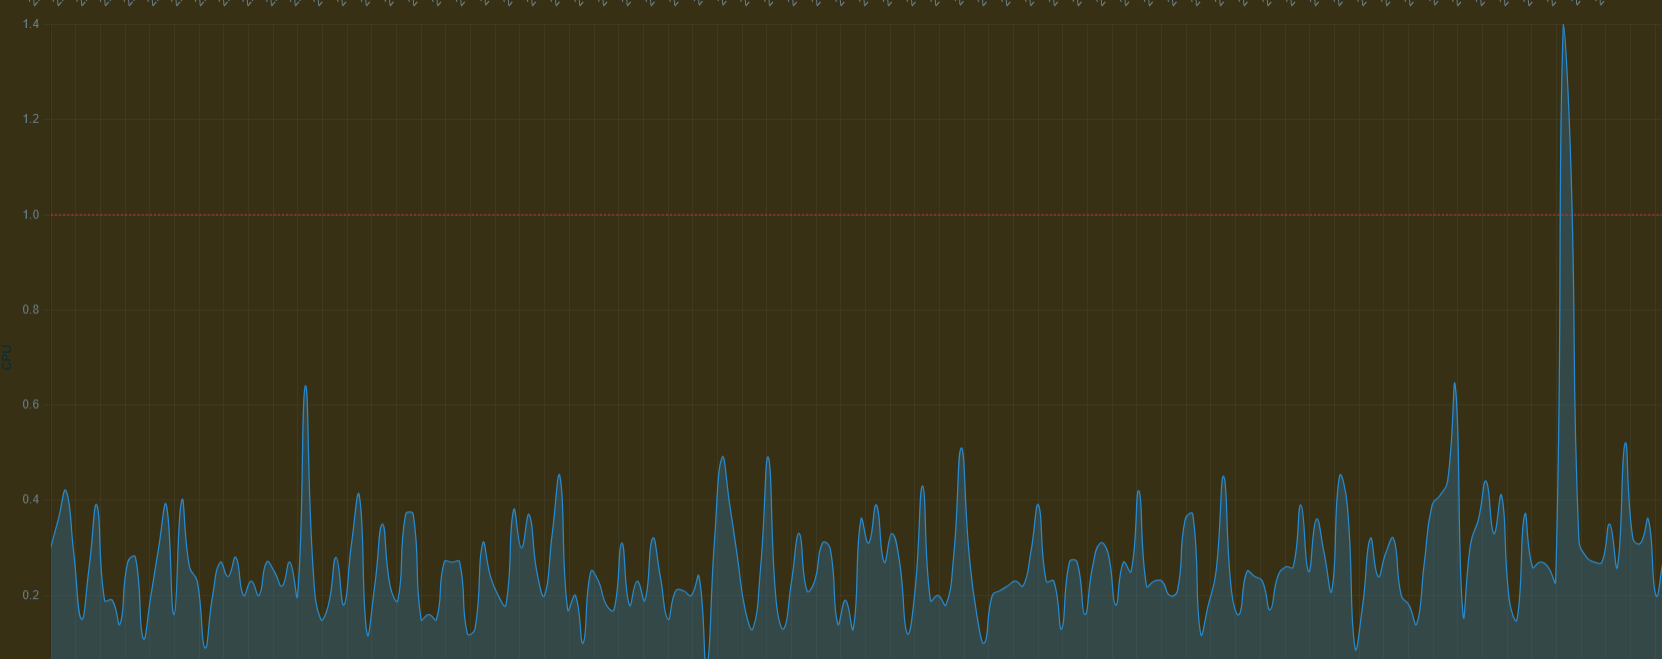
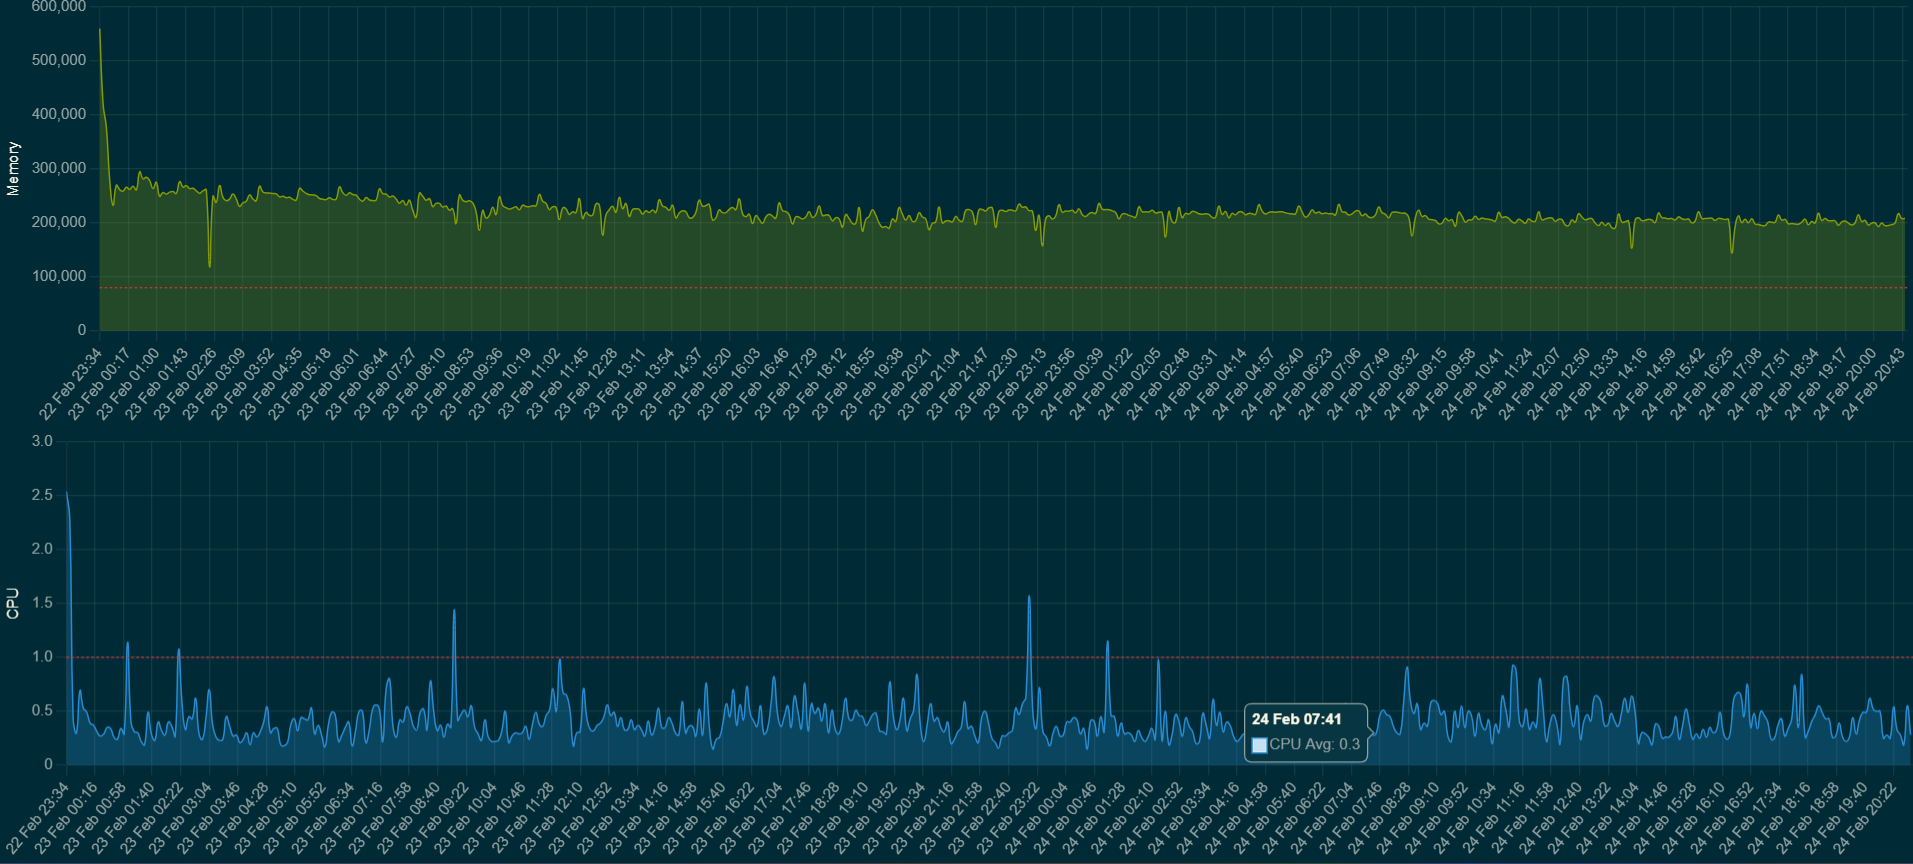
Add graph for hub memory and processor usage history (since last reboot) - @WarlockWeary
Changed
Make node hover effect (see neighbors) more visible - @WarlockWeary
Note: The mem & cpu history graph has nothing to do with Zigbee topology and connectivity, it just looks pretty and I could't resist @WarlockWeary's request It might move to its own app if I can figure out more "graphy" stuff to add, as I don't believe it makes sense to have a standallone app for just 2 graphs.
The mem and CPU graph are handy, now I don't have to do my own when beta testing and posting.
CPU seems a little light I just recompiled WebCore at 50% CPU but the graph has me at 1.4%
I think that everything above 1 is bad, as in proceses are not executed immediately and are put in a queue because the CPU is busy doing something else. That's why I added the red dotted threshold line at 1.0.
I might very well be wrong, as my Linux kernel knowledge is non-existent
If you’re looking at CPU Load, the hub has 4 cores so a load of 4.0 would be approximately 100% usage. Load however is a measure of executing threads as well as those that are in a wait state so the load can actually exceed 4.0.